Sep. 15, 2020 – NASA Sees Tropical Depression Rene Dissipating
NASA’s Aqua satellite captured a visible image of Tropical Depression Rene as it was dissipating in the central North Atlantic Ocean.
On Sept. 15 at 12:30 p.m. EDT. NASA’s Aqua satellite provided a visible image of Tropical Depression Rene dissipating in the north central Atlantic Ocean. Image Courtesy: NASA Worldview, Earth Observing System Data and Information System (EOSDIS).
The Moderate Resolution Imaging Spectroradiometer or MODIS instrument that flies aboard NASA’s Aqua satellite captured a visible image of Rene on Sept. 15 at 12:30 p.m. EDT. Rene appeared elongated from wind shear (outside winds blowing at different levels of the atmosphere) battering the storm. Over the next couple of hours, visible satellite imagery showed that Rene opened into a trough (elongated area) of low pressure and was no longer a tropical cyclone. Several hours later, Rene dissipated into a remnant low-pressure area.
Satellite imagery was created using NASA’s Worldview product at NASA’s Goddard Space Flight Center in Greenbelt, Md.
Rene‘s Curtain Call
At 5 p.m. EDT (2100 UTC) on Sept. 15, NOAA’s National Hurricane Center (NHC) issued the final advisory on Rene, citing that the storm had dissipated. The remnants of Rene were located near latitude 26.9 degrees north and longitude 49.3 degrees west. Rene was located about 1,045 miles (1,685 km) northeast of the Leeward Islands. The remnants were moving toward the west-southwest near 7 mph (11 kph) and this general motion will likely continue for another day or two. Maximum sustained winds were near 30 mph (45 kph) with higher gusts.
The remnants of Rene are expected to move generally southwestward for the next day or two while the associated winds slowly subside.
About NASA’s Worldview and Aqua Satellite
NASA’s Earth Observing System Data and Information System (EOSDIS) Worldview application provides the capability to interactively browse over 700 global, full-resolution satellite imagery layers and then download the underlying data. Many of the available imagery layers are updated within three hours of observation, essentially showing the entire Earth as it looks “right now.”
NASA’s Aqua satellite is one in a fleet of NASA satellites that provide data for hurricane research.
Tropical cyclones/hurricanes are the most powerful weather events on Earth. NASA’s expertise in space and scientific exploration contributes to essential services provided to the American people by other federal agencies, such as hurricane weather forecasting.
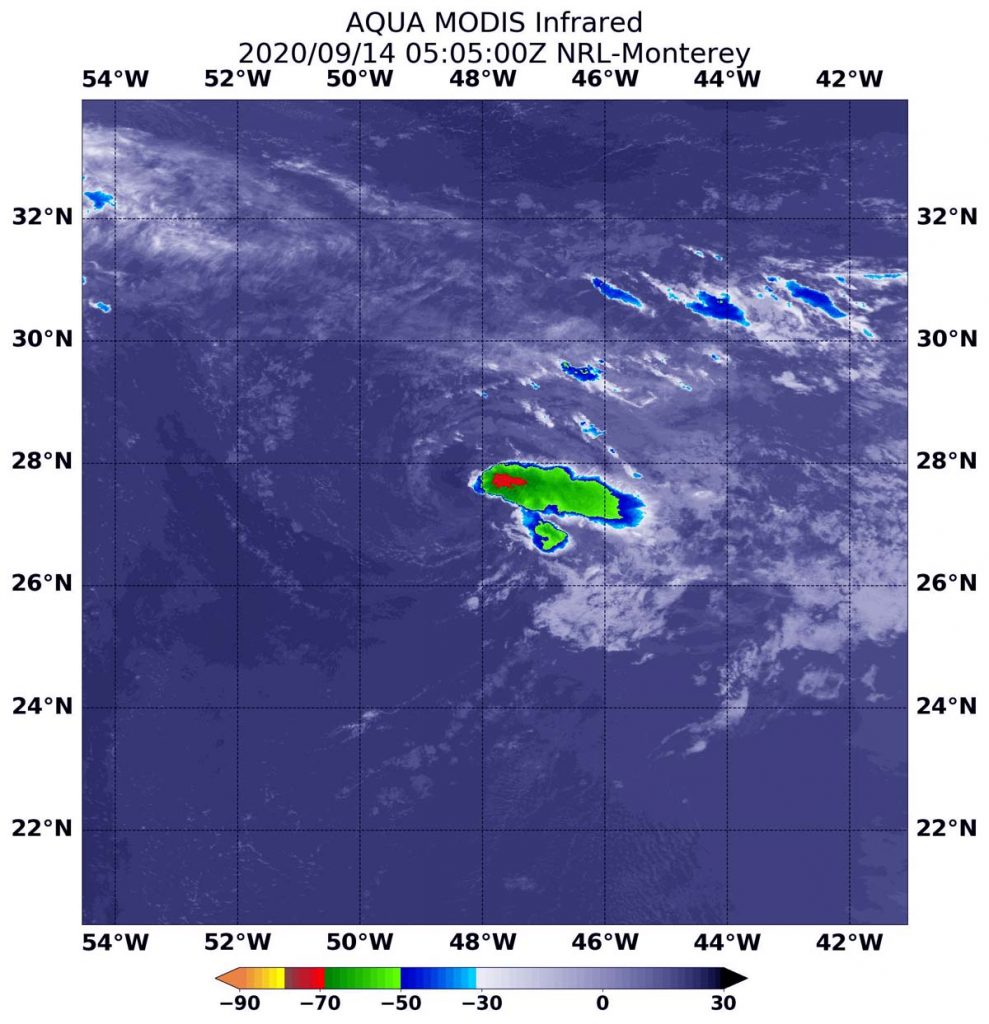
Sep. 14, 2020 – NASA Satellite Imagery Catches Sally’s Development into a Hurricane
Tropical Storm Sally was deemed a hurricane on Sept. 14 just after NASA’s Aqua satellite provided data on the storm.
Infrared Imagery on Sally
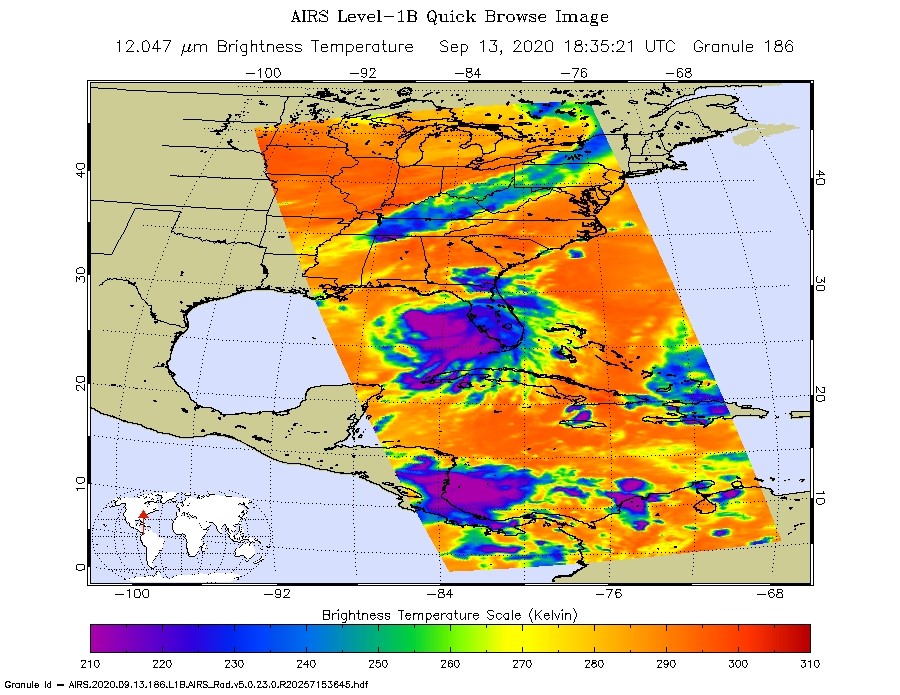
On Sunday, Sept. 13, NASA analyzed Sally’s cloud top temperatures to gauge if the storm was strengthening. Cloud top temperatures provide information to forecasters about where the strongest storms are located within a tropical cyclone. The stronger the storms, the higher they extend into the troposphere, and the colder the cloud temperatures.
On Sept. 13 at 2:35 p.m. EDT (1835 UTC) NASA’s Aqua satellite analyzed a low-pressure area in the eastern Atlantic Ocean using the Atmospheric Infrared Sounder or AIRS instrument. AIRS found coldest cloud top temperatures as cold as or colder than (purple) minus 63 degrees Fahrenheit (minus 53 degrees Celsius) around the center and east of the center. Credit: NASA JPL/Heidar Thrastarson
On Sept. 13 at 2:35 p.m. EDT (1835 UTC) NASA’s Aqua satellite analyzed Tropical Storm Sally using the Atmospheric Infrared Sounder or AIRS instrument. AIRS found coldest cloud top temperatures as cold as or colder than minus 63 degrees Fahrenheit (minus 53 degrees Celsius) around the center and east of the center. NASA research has shown that cloud top temperatures that cold indicate strong storms that have the capability to create heavy rain.
Visible Imagery Helps Confirm Hurricane Status
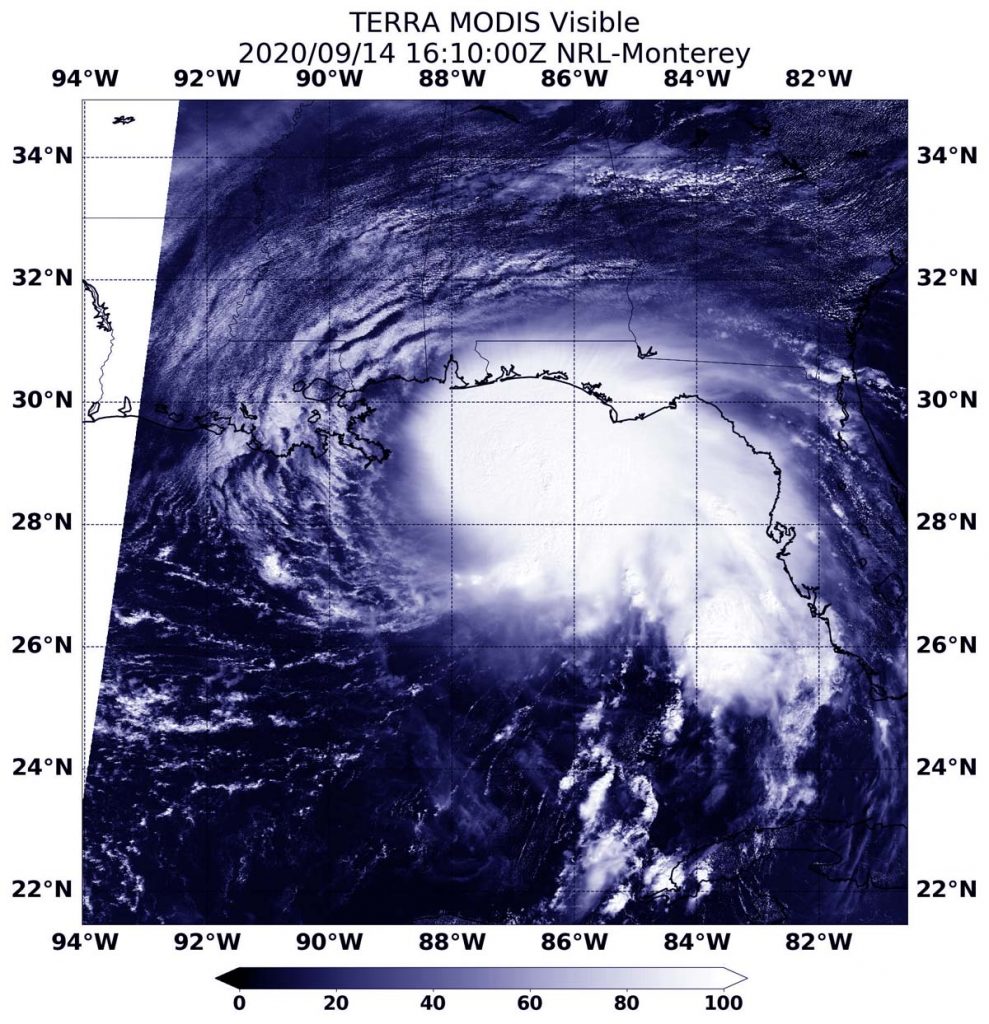
On Sept. 14 at 12:10 p.m. EDT (1610 UTC), the Moderate Resolution Imaging Spectroradiometer (MODIS) instrument aboard NASA’s Terra satellite provided a visible look at Hurricane Sally just as it reached hurricane status in the northern Gulf of Mexico. In the Terra image, the strongest storms appear to be around the center of circulation and the northern and eastern quadrants of the storm, which are skirting Florida’s west coast.
NASA’s Terra satellite provided a visible look at Hurricane Sally on Sept. 14 at 12:10 p.m. EDT just as it reached hurricane status in the northern Gulf of Mexico. Credit: NASA/NRL
At 12:30 p.m. EDT, Daniel Brown, senior hurricane specialist and warning coordination meteorologist at NOAA’s National Hurricane Center in Miami, Fla. noted, “A NOAA Hurricane Hunter aircraft investigating Sally recently measured peak flight-level winds of 88 knot at 700 millibars and SFMR [Stepped Frequency Microwave Radiometer] winds of 78 knot north of the center, and an Air Force reconnaissance aircraft just measured 79 knot flight-level winds at 700 millibars. These data indicate that Sally has rapidly strengthened into a hurricane with an intensity of around 80 knots. In addition, data from the KEVX WSR-88D [the radar at Eglin Air Force Base, Fla.] show an eye forming at around 16,000 foot altitude. This special advisory has been issued to increase the initial and forecast intensity.”
The Stepped Frequency Microwave Radiometer (SFMR) is the primary instrument used by the National Hurricane Center to determine hurricane intensity.
Watches and Warnings in Effect on Sept. 14
A Storm Surge Warning is in effect for Port Fourchon, Louisiana to the Alabama/Florida Border, Lake Pontchartrain, Lake Maurepas, and Lake Borgne and for Mobile Bay. A Hurricane Warning is in effect for Morgan City Louisiana to the Alabama/Florida Border, and for Lake Pontchartrain and Lake Maurepas including metropolitan New Orleans. A Tropical Storm Warning is in effect for the Alabama/Florida Border to Indian Pass, Florida and for Intracoastal City, Louisiana to west of Morgan City.
A Tropical Storm Watch is in effect for Indian Pass to Ochlockonee River, Florida.
Sally’s Status of Sept. 14
At 12:30 p.m. EDT (1630 UTC), the center of Hurricane Sally was located near latitude 28.7 degrees north and longitude 87.0 degrees west. That is 130 miles (210 km) east-southeast of the mouth of the Mississippi River. Sally is moving toward the west-northwest near 7 mph (11 kph). This general motion is expected to continue today, followed by a decrease in forward speed and a turn toward the northwest tonight and a northward turn sometime on Tuesday.
Data from NOAA and Air Force Reserve Hurricane Hunter aircraft indicate that Sally has rapidly strengthened. The maximum sustained winds are near 90 mph (150 kph) with higher gusts. Additional strengthening is forecast during the next day or so. The latest minimum central pressure estimated from reconnaissance aircraft data is 986 millibars.
Sally’s Forecast
On the forecast track, the center of Sally will move over the north-central Gulf of Mexico today, approach southeastern Louisiana tonight, and make landfall in the hurricane warning area on Tuesday or Tuesday night. Afterward, Sally is expected to move slowly north-northeastward near the northern Gulf Coast through Wednesday.
The AIRS instrument is one of six instruments flying on board NASA’s Aqua satellite, launched on May 4, 2002.
NASA Researches Tropical Cyclones
Hurricanes/tropical cyclones are the most powerful weather events on Earth. NASA’s expertise in space and scientific exploration contributes to essential services provided to the American people by other federal agencies, such as hurricane weather forecasting.
For more than five decades, NASA has used the vantage point of space to understand and explore our home planet, improve lives and safeguard our future. NASA brings together technology, science, and unique global Earth observations to provide societal benefits and strengthen our nation. Advancing knowledge of our home planet contributes directly to America’s leadership in space and scientific exploration.
Sep. 14, 2020 – NASA Catches Development of Eastern Atlantic’s Tropical Storm Vicky
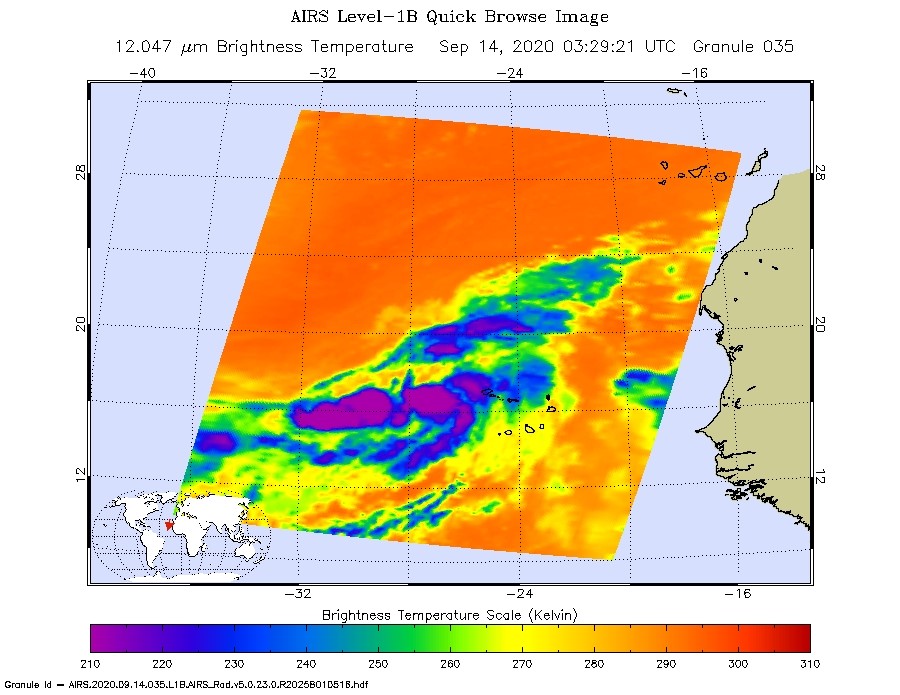
NASA’s Aqua satellite analyzed a low-pressure area in the far eastern Atlantic Ocean, and it showed the system becoming more organized. Soon after Aqua passed overhead, the low became Tropical Depression 21. Hours later, the storm strengthened into Tropical Storm Vicky.
On Sept. 14 at 0329 UTC (Sept. 13 at 11:29 a.m. EDT) NASA’s Aqua satellite analyzed a low-pressure area in the eastern Atlantic Ocean using the Atmospheric Infrared Sounder or AIRS instrument. AIRS found coldest cloud top temperatures as cold as or colder than (purple) minus 63 degrees Fahrenheit (minus 53 degrees Celsius) around the center of circulation, as the storm was forming into Tropical Depression 21. Credit: NASA JPL/Heidar Thrastarson
Infrared Imagery Revealed a Consolidating System
One of the ways NASA researches tropical cyclones is using infrared data that provides temperature information. The AIRS instrument aboard NASA’s Aqua satellite captured a look at those temperatures in the developing low-pressure area and gave insight into the size of the storm and its rainfall potential.
Cloud top temperatures provide information to forecasters about where the strongest storms are located within a tropical cyclone. Tropical cyclones do not always have uniform strength, and some sides are stronger than others. The stronger the storms, the higher they extend into the troposphere, and the colder the cloud temperatures. NASA provides that data to forecasters at NOAA’s National Hurricane Center or NHC so they can incorporate in their forecasting.
On Sept. 14 at 0329 UTC (Sept. 13 at 11:29 a.m. EDT) NASA’s Aqua satellite analyzed the low-pressure area using the Atmospheric Infrared Sounder or AIRS instrument. AIRS found coldest cloud top temperatures as cold as or colder than minus 63 degrees Fahrenheit (minus 53 degrees Celsius) around the center of circulation. NASA research has shown that cloud top temperatures that cold indicate strong storms that have the capability to create heavy rain.
Forecasters looked at wind speeds in the storm to determine that it had strengthened into a tropical storm. The Advanced Scatterometer (ASCAT) winds products are processed by NOAA/NESDIS utilizing measurements from the scatterometer instrument aboard the European Organisation for the Exploitation of Meteorological Satellites (EUMETSAT) Metop satellites.
U.S. Navy Hurricane Specialist Dave Roberts at NOAA’s National Hurricane Center in Miami, Fla. noted, “A METOP A/B ASCAT scatterometer pass over the cyclone showed a large swath of winds in the northeast quadrant on the order of 35 to 39 knots. Deep convection in that region of the cyclone continues to increase as well as near the center of circulation. Accordingly, the initial intensity is raised to 40 knots, making this the twentieth named storm of the season.”
Vicky’s Status of Sept. 14
At 11 a.m. EDT (1500 UTC), Vicky was centered about 350 miles (565 km) west-northwest of the Cabo Verde Islands. The center was near latitude 18.7 degrees north and longitude 28.5 degrees west. Vicky was moving toward the northwest near 6 mph (9 kph) and this motion is forecast to continue into this afternoon. A turn toward the northwest is forecast tonight, with a west-northwestward motion expected on Tuesday and Wednesday.
Maximum sustained winds have increased to near 45 mph (75 kph) with higher gusts. Little change in strength is expected during the next day or so. The estimated minimum central pressure is 1002 millibars.
Vicky’s Forecast
NHC expects Vicky will be a short-lived tropical cyclone as increasing southwesterly wind shear (winds from the outside of the tropical cyclone that batter and weaken them) is expected to quickly weaken Vicky to a depression in a couple days, and the system is expected to degenerate to a remnant low pressure area on Thursday, Sept. 17.
The AIRS instrument is one of six instruments flying on board NASA’s Aqua satellite, launched on May 4, 2002.
NASA Researches Tropical Cyclones
Hurricanes/tropical cyclones are the most powerful weather events on Earth. NASA’s expertise in space and scientific exploration contributes to essential services provided to the American people by other federal agencies, such as hurricane weather forecasting.
For more than five decades, NASA has used the vantage point of space to understand and explore our home planet, improve lives and safeguard our future. NASA brings together technology, science, and unique global Earth observations to provide societal benefits and strengthen our nation. Advancing knowledge of our home planet contributes directly to America’s leadership in space and scientific exploration.
Sep. 14, 2020 – NASA’s Water Vapor Analysis of Tropical Storm Karina Shows Wind Shear Effects
When NASA’s Aqua satellite passed over the Eastern Pacific Ocean, it gathered water vapor data on Tropical Storm Karina. The data showed that the storm was being affected by wind shear from the northeast, pushing the bulk of clouds to the southwest.
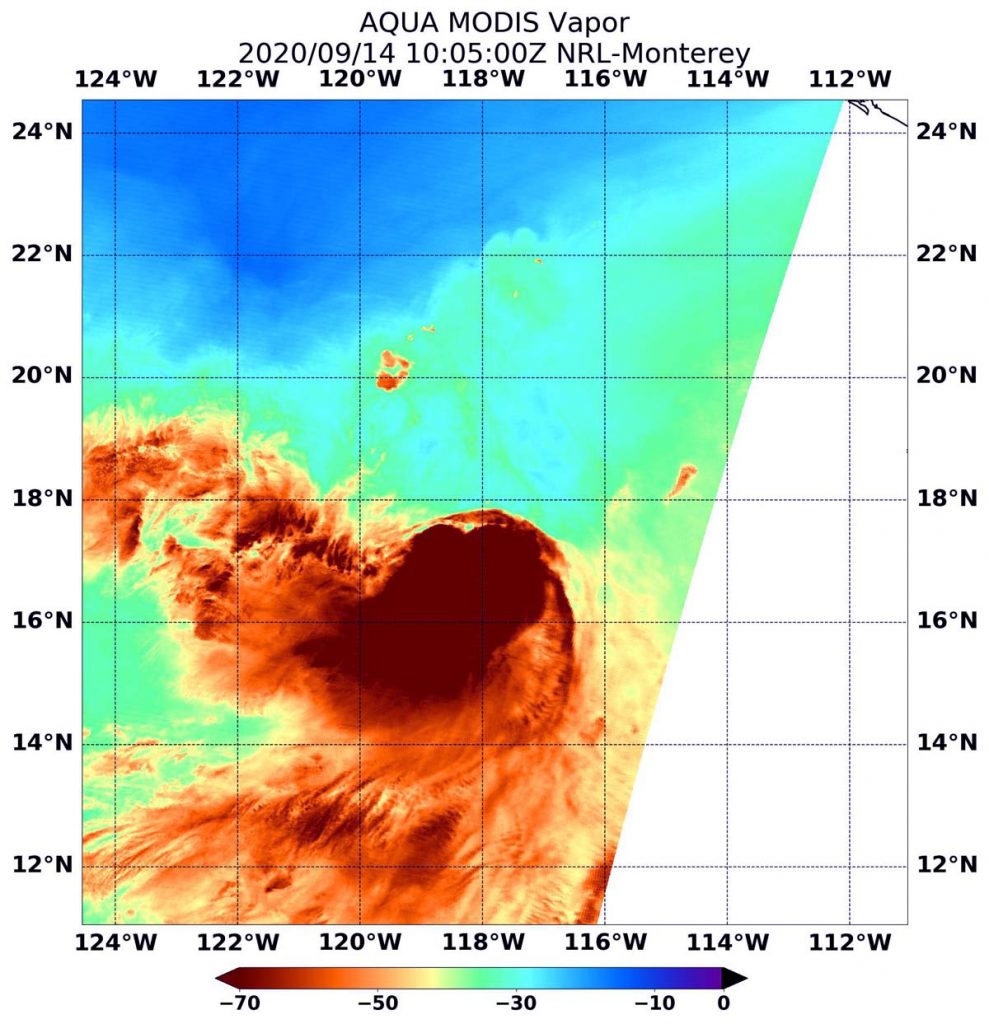
On Sept. 14 at 6:05 a.m. EDT (1005 UTC), NASA’s Aqua satellite passed over Tropical Storm Karina in the Eastern Pacific Ocean and found highest concentrations of water vapor (brown) and coldest cloud top temperatures were around the center. Credits: NASA/NRL
Karina formed late on Saturday, Sept. 12 as Tropical Depression 16E (TD16E). TD16E developed about 470 miles (755 km) south-southwest of the southern tip of Baja California, Mexico. Six hours later at 5 a.m. EDT on Sept. 13, the depression organized and strengthened into a tropical storm and was renamed Karina.
A Look at Water Vapor Content
Water vapor analysis of tropical cyclones tells forecasters how much potential a storm has to develop. Water vapor releases latent heat as it condenses into liquid. That liquid becomes clouds and thunderstorms that make up a tropical cyclone. Temperature is important when trying to understand how strong storms can be. The higher the cloud tops, the colder and stronger the storms.
On Sept. 14 at 6:05 a.m. EDT (1005 UTC), NASA’s Aqua satellite passed over Tropical Storm Karina in the Eastern Pacific Ocean. The Moderate Resolution Imaging Spectroradiometer or MODIS instrument gathered water vapor content and temperature information and found highest concentrations of water vapor and coldest cloud top temperatures were southwest of the center. That is because of strong northeasterly wind shear pushing the strong storms away from the center of circulation.
MODIS data showed coldest cloud top temperatures in those storms were as cold as or colder than minus 70 degrees Fahrenheit (minus 56.6 degrees Celsius) in those storms. Storms with cloud top temperatures that cold have the capability to produce heavy rainfall.
“Karina continues to be a sheared cyclone with the deep convection displaced to the southwest of the exposed low-level center,” noted Jack Beven, a senior hurricane specialist at NOAA’s National Hurricane Center in Miami. “Recent scatterometer [instrument that analyzes winds] data showed winds up to 40 knots in the southern semicircle, and thus the initial intensity remains 40 knots.”
Wind Shear Affecting Karina
The shape of a tropical cyclone provides forecasters with an idea of its organization and strength. When outside winds batter a storm, it can change the storm’s shape. Winds can push most of the associated clouds and rain to one side of a storm.
In general, wind shear is a measure of how the speed and direction of winds change with altitude. Tropical cyclones are like rotating cylinders of winds. Each level needs to be stacked on top each other vertically in order for the storm to maintain strength or intensify. Wind shear occurs when winds at different levels of the atmosphere push against the rotating cylinder of winds, weakening the rotation by pushing it apart at different levels.
Karina’s Status on Sept. 14
At 5 a.m. EDT (2 a.m. PDT/0900 UTC), the center of Tropical Storm Karina was located near latitude 17.9 degrees north and longitude 118.2 degrees west. Karina is centered 640 miles (1,025 km) west-southwest of the southern tip of Baja California, Mexico. Karina is moving toward the west near 13 mph (20 kph). Maximum sustained winds are near 45 mph (75 kph) with higher gusts. Tropical-storm-force winds extend outward up to 150 miles (240 km) from the center. The estimated minimum central pressure is 1001 millibars.
Karina’s Forecast
A turn toward the northwest is expected by tonight, Sept. 14, with this motion continuing for the next few days. Some slight strengthening is forecast in the next 24 hours, with gradual weakening expected to begin on Tuesday.
NASA’s Aqua satellite is one in a fleet of NASA satellites that provide data for hurricane research.
NASA Researches Tropical Cyclones
Hurricanes/tropical cyclones are the most powerful weather events on Earth. NASA’s expertise in space and scientific exploration contributes to essential services provided to the American people by other federal agencies, such as hurricane weather forecasting.
For more than five decades, NASA has used the vantage point of space to understand and explore our home planet, improve lives and safeguard our future. NASA brings together technology, science, and unique global Earth observations to provide societal benefits and strengthen our nation. Advancing knowledge of our home planet contributes directly to America’s leadership in space and scientific exploration.
Sep. 14, 2020 – NASA-NOAA Satellite Helps Confirm Teddy Now a Record-Setting Tropical Storm
NASA-NOAA’s Suomi NPP satellite provided an infrared image of Tropical Depression 20 in that helped confirm it organized and strengthened into Tropical Storm Teddy. Teddy, which has broken a hurricane season record, is expected to become a major hurricane later in the week, according to the National Hurricane Center (NHC).
This nighttime image from NASA-NOAA’s Suomi NPP satellite revealed a more organized Tropical Depression 20 helping confirm it had become Tropical Storm Teddy in the Central Atlantic Ocean around midnight on Sept. 14. Credit: NASA Worldview, Earth Observing System Data and Information System (EOSDIS)
Tropical Depression 20 formed late on Saturday, Sept. 12 in the Central North Atlantic Ocean, about 2,030 miles (3,265 km) east of the Northern Leeward Islands. It maintained tropical depression status until this morning, Sept. 14, when infrared satellite data helped confirm it had strengthened and organized. NHC reported this makes Tropical Storm Teddy the earliest 19th named storm, besting the unnamed tropical storm on October 4, 2005.
NASA’s Night-Time View of Elida’s Intensification
The Visible Infrared Imaging Radiometer Suite (VIIRS) instrument aboard Suomi NPP provided a nighttime image of Tropical Depression 20. The nighttime image, taken around midnight on Sept. 14, revealed that Tropical Depression 20 had become more organized helping confirm that it had become Tropical Storm Teddy in the Central Atlantic Ocean. The image was created using the NASA Worldview application at NASA’s Goddard Space Flight Center in Greenbelt, Md.
NHC Senior Hurricane Forecaster Stacy Stewart noted, “Earlier ASCAT [scatterometer that measures wind speed] data indicated peak winds of 33 knots in the northwestern quadrant of the depression. Since then, convection has increased and so have the various satellite intensity estimates. The initial intensity is increased to 35 knots [40 mph] based on the ASCAT data, and satellite estimates of 35 knots from TAFB [NOAA’s Tropical Analysis and Forecast Branch] and 38 knots from University of Wisconsin-Madison-CIMSS SATCON.” The CIMSS Satellite Consensus (SATCON) product blends tropical cyclone intensity estimates derived from multiple objective algorithms to produce an ensemble estimate of intensity for current tropical cyclones worldwide.
Teddy’s Status on Sept. 14
At 5 a.m. EDT (0900 UTC) on Sept. 14, the center of Tropical Storm Teddy was located near latitude 13.4 degrees north and longitude 40.4 degrees west. Teddy is located about 1,405 miles (2,260 km) east of the Lesser Antilles. Teddy is moving toward the west-northwest near 14 mph (22 kph). Maximum sustained winds have increased to near 40 mph (65 kph) with higher gusts. The estimated minimum central pressure is 1004 millibars.
Teddy’s Forecast
A continued west-northwestward motion is expected for the next day or two followed by a turn toward the northwest by mid-week. Additional strengthening is anticipated, and Teddy is forecast to become a hurricane in a couple of days.
Large swells generated by Tropical Storm Teddy are expected to reach the Lesser Antilles and the northeastern coast of South America on Wednesday. These swells are likely to cause life-threatening surf and rip current conditions.
About NASA’s EOSDIS Worldview
NASA’s Earth Observing System Data and Information System (EOSDIS) Worldview application provides the capability to interactively browse over 700 global, full-resolution satellite imagery layers and then download the underlying data. Many of the available imagery layers are updated within three hours of observation, essentially showing the entire Earth as it looks “right now.”
NASA Researches Earth from Space
For more than five decades, NASA has used the vantage point of space to understand and explore our home planet, improve lives and safeguard our future. NASA brings together technology, science, and unique global Earth observations to provide societal benefits and strengthen our nation. Advancing knowledge of our home planet contributes directly to America’s leadership in space and scientific exploration.
Sep. 14, 2020 – NASA’s Aqua Satellite Finds Rene Barely a Depression Battered by Wind Shear
Tropical Depression Rene continues to be the victim of strong wind shear and forecasters anticipate it will lead to the storm’s demise in the next couple of days. NASA’s Aqua satellite viewed the storm in infrared light to find wind shear was pushing Rene’s strongest storms away from the center, preventing the storm from re-organizing and strengthening.
On Sept. 15 at 1:05 a.m. EDT (0505 UTC), the MODIS instrument that flies aboard NASA’s Aqua satellite gathered infrared data on Rene that confirmed wind shear was adversely affecting the storm. Persistent north-northeasterly vertical wind shear showed strongest storms (red) pushed to the east-southeast of the center where cloud top temperatures were as cold as minus 70 degrees Fahrenheit (minus 56.6 Celsius). Credit: NASA/NRL
NASA’s Aqua Satellite Reveals Effects of Wind Shear
On instrument aboard NASA’s Aqua satellite uses infrared light to analyze cloud top temperatures in a tropical cyclone’s clouds to determine strength. The strongest thunderstorms that reach high into the atmosphere have the coldest cloud top temperatures.
On Sept. 15 at 1:05 a.m. EDT (0505 UTC), the Moderate Resolution Imaging Spectroradiometer or MODIS instrument that flies aboard NASA’s Aqua satellite gathered infrared data on Rene that confirmed wind shear was adversely affecting the storm. Persistent north-northeasterly vertical wind shear showed strongest storms (red) pushed to the east-southeast of the center where cloud top temperatures were as cold as minus 70 degrees Fahrenheit (minus 56.6 Celsius).
National Hurricane Center forecaster Jack Beven noted, “Rene continues to produce just enough deep convection to keep it from degenerating to a remnant low. However, it is expected to degenerate later today due to the ongoing impact of strong west-northwesterly vertical shear and dry air entrainment.”
Wind Shear Affecting Rene
The shape of a tropical cyclone provides forecasters with an idea of its organization and strength. When outside winds batter a storm, it can change the storm’s shape and push much of the associated clouds and rain to one side of it. That is what wind shear does.
In general, wind shear is a measure of how the speed and direction of winds change with altitude. Tropical cyclones are like rotating cylinders of winds. Each level needs to be stacked on top each other vertically in order for the storm to maintain strength or intensify. Wind shear occurs when winds at different levels of the atmosphere push against the rotating cylinder of winds, weakening the rotation by pushing it apart at different levels.
Status of Tropical Depression Rene
At 5 a.m. EDT (0900 UTC), the center of Tropical Depression Rene was located near latitude 27.4 degrees north and longitude 48.3 degrees west. Rene is centered about 1,115 miles (1,795 km) northeast of the Leeward Islands. The depression is moving toward the west near 3 mph (6 km/h). Maximum sustained winds are near 30 mph (45 kph) with higher gusts. The estimated minimum central pressure is 1011 millibars.
Rene’s Forecast
A faster motion toward the west-southwest or southwest is forecast to begin later today, Sept. 14 and continue through dissipation. Weakening is forecast, and Rene is expected to become a remnant low later today and dissipate by Wednesday, Sept. 16.
NASA Researches Tropical Cyclones
Hurricanes/tropical cyclones are the most powerful weather events on Earth. NASA’s expertise in space and scientific exploration contributes to essential services provided to the American people by other federal agencies, such as hurricane weather forecasting.
For more than five decades, NASA has used the vantage point of space to understand and explore our home planet, improve lives and safeguard our future. NASA brings together technology, science, and unique global Earth observations to provide societal benefits and strengthen our nation. Advancing knowledge of our home planet contributes directly to America’s leadership in space and scientific exploration.
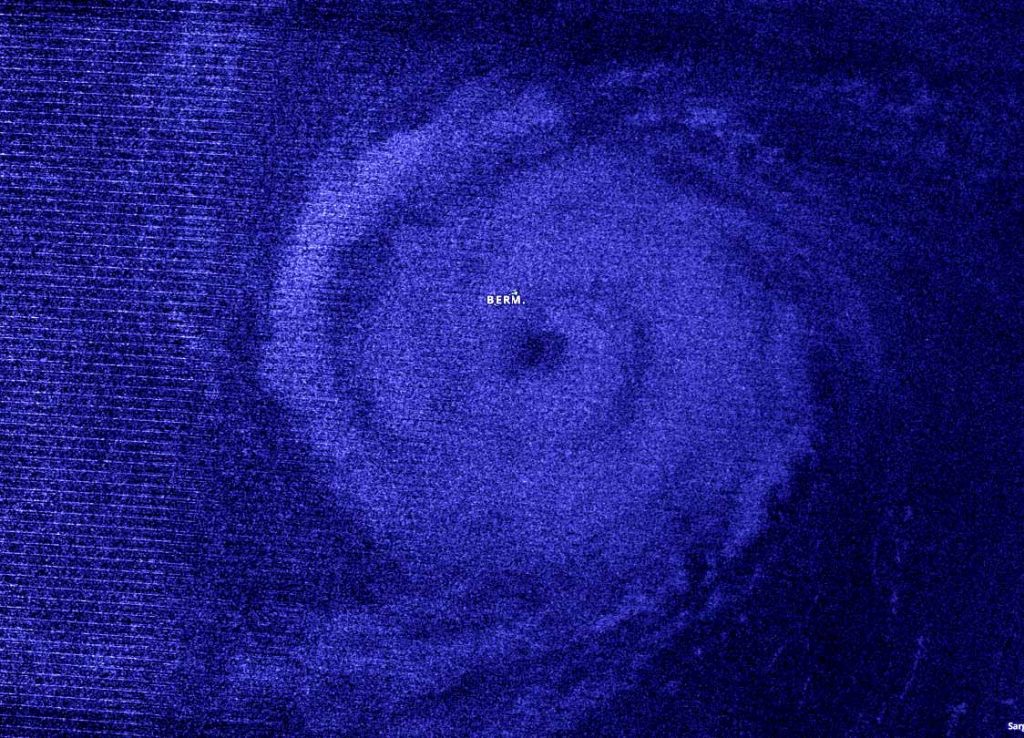
Sep. 14, 2020 – NASA Night-time Image Shows Hurricane Paulette’s Large Eye Approach Bermuda
Night-time imagery from NASA-NOAA’s Suomi NPP satellite showed Hurricane Paulette’s large eye approaching the island of Bermuda. A Hurricane Warning is in effect for Bermuda.
NASA-NOAA’s Suomi NPP satellite passed the Atlantic Ocean at 1:30 a.m. EDT (0530 UTC) and captured a night-time image of Hurricane Paulette as its 35- to 40-mile-wide-eye approached Bermuda. Credit: NASA Worldview, Earth Observing System Data and Information System (EOSDIS)
Bermuda is a British territory in the western Atlantic Ocean. It is located approximately 643 miles (1,035 km) east-southeast of Cape Hatteras, North Carolina.
NASA’s Night-Time View of Elida’s Intensification
The Visible Infrared Imaging Radiometer Suite (VIIRS) instrument aboard Suomi NPP provided a nighttime image of Hurricane Paulette at 1:30 a.m. EDT (0530 UTC). The large eye, between 35 and 40 miles in diameter, was clearly apparent in the nighttime image, and it was surrounded by powerful thunderstorms. Hurricane-force winds extend outward up to 45 miles (75 km) from the center and tropical-storm-force winds extend outward up to 175 miles (280 km).
The image was created using the NASA Worldview application at NASA’s Goddard Space Flight Center in Greenbelt, Md.
Hurricane Paulette’s Status
At 5 a.m. EDT on Sept. 14, the eye of Paulette circled the entire island of Bermuda. The center of the eye of Hurricane Paulette was located over northeastern Bermuda or near latitude 32.3 degrees north and longitude 64.7 degrees west.
NOAA’s National Hurricane Center (NHC) said Paulette is moving toward the north-northwest near 12 mph (19 km/h), and this motion should continue early this morning. A turn toward the north is expected by late morning and will continue into this afternoon. A faster motion toward the northeast is expected by this evening and will continue through Wednesday.
Maximum sustained winds have increased to near 90 mph (150 km/h) with higher gusts. Additional strengthening is likely when Paulette turns northeastward and moves away from Bermuda tonight through Tuesday. Although winds have subsided across much of Bermuda due to Paulette’s eye passage, hurricane-force winds will return shortly when the southern portion of Paulette’s eyewall passes over the island. Tropical-storm-force winds will continue possibly into the early afternoon across the entire island. The estimated minimum central pressure based on surface observations on Bermuda is 973 millibars.
Paulette’s Forecast Track
At 5 a.m. EDT, the NHC noted that on the forecast track, the eye of Paulette will continue to pass over Bermuda during the next couple of hours, followed by passage of the southern portion of the eyewall.
About NASA’s EOSDIS Worldview
NASA’s Earth Observing System Data and Information System (EOSDIS) Worldview application provides the capability to interactively browse over 700 global, full-resolution satellite imagery layers and then download the underlying data. Many of the available imagery layers are updated within three hours of observation, essentially showing the entire Earth as it looks “right now.”
NASA Researches Earth from Space
For more than five decades, NASA has used the vantage point of space to understand and explore our home planet, improve lives and safeguard our future. NASA brings together technology, science, and unique global Earth observations to provide societal benefits and strengthen our nation. Advancing knowledge of our home planet contributes directly to America’s leadership in space and scientific exploration.
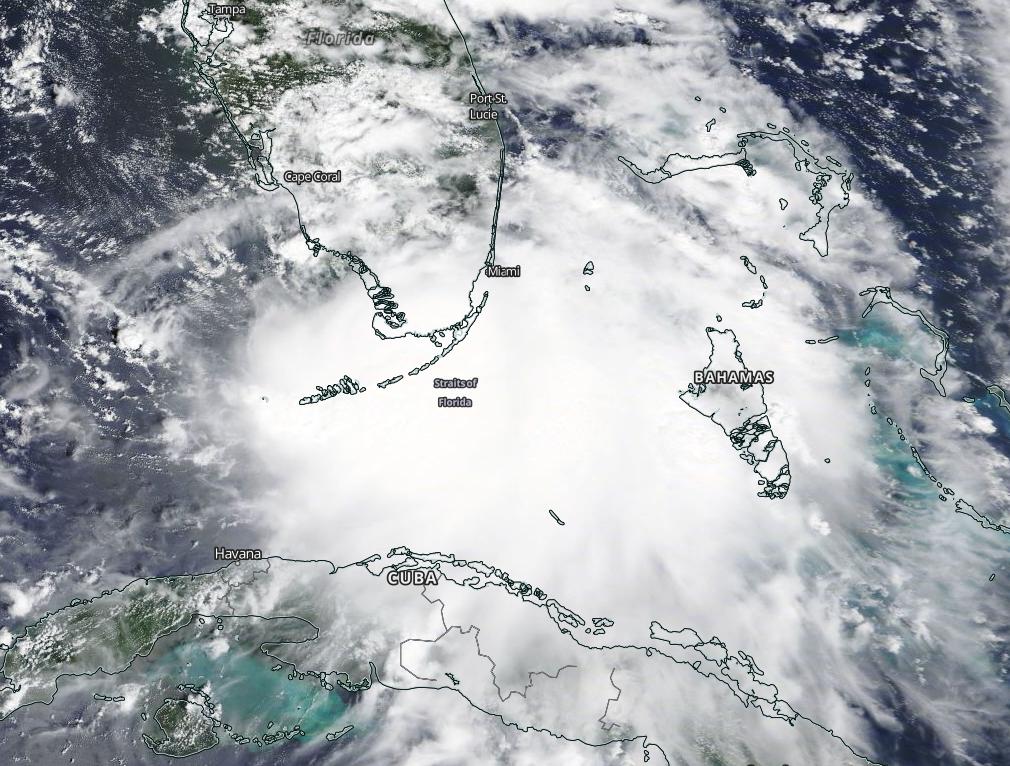
Sep. 13, 2020 – NASA Satellite Confirms Tropical Storm Sally Strengthening, Threatens Gulf States
NASA’s Terra satellite passed over the Gulf of Mexico on Saturday, Sept. 12 and visible imagery helped confirm that the nineteenth tropical cyclone of the Atlantic Ocean hurricane season strengthened into a tropical storm.
On Sept. 12 at 1:30 p.m. EDT, NASA’s Terra satellite captured a visible image as it passed over newly developed Tropical Storm Sally between southern Florida and Cuba. Credit: NASA Worldview
Tropical Depression 19 formed late on Friday, Sept. 11, and by 2 p.m. EDT on Saturday, Sept. 12, it had strengthened into a tropical storm and was renamed Sally. Visible imagery from NASA’s Terra satellite helped confirm the organization of the storm.
On Sept. 12, the Moderate Resolution Imaging Spectroradiometer or MODIS instrument aboard Terra provided a visible image newly developed tropical cyclone. The imagery showed better-defined banding features over the southern portion of the circulation than earlier in the day. Sally appeared more organized on satellite imagery, enough to be classified as a tropical storm.
As Sally strengthened and moved away from the Florida Peninsula during the morning hours of Sept. 13, the National Hurricane Center (NHC) posted many warnings and watches along the northern Gulf coast.
Warnings and Watches on Sept. 13
A Storm Surge Warning is in effect for Port Fourchon, Louisiana to the Mississippi/Alabama Border and for Lake Pontchartrain, Lake Maurepas, and Lake Borgne. A Hurricane Warning is in effect for Morgan City, Louisiana to Ocean Springs, Mississippi and for Lake Pontchartrain and Lake Maurepas including metropolitan New Orleans. A Tropical Storm Warning is in effect for east of Ocean Springs to Indian Pass and from Intracoastal City, Louisiana to west of Morgan City.
A Storm Surge Watch is in effect for the Mississippi/Alabama Border to the Alabama/Florida Border. A Hurricane Watch is in effect for east of Ocean Springs to the Alabama/Florida Border. A Tropical Storm Watch is in effect for Indian Pass to Ochlockonee River, Florida.
Sally’s Status on Sept. 13, 2020
At 11 a.m. EDT (1500 UTC), NHC reported the center of Tropical Storm Sally was located near latitude 27.5 degrees north and longitude 84.9 degrees west. That is about 135 miles (225 km) west of St. Petersburg, Florida.
Sally is moving toward the west-northwest near 12 mph (19 km/h), and a west-northwestward or northwestward motion is expected through Monday. Data from an Air Force Reserve Hurricane Hunter aircraft indicate that the maximum sustained winds have increased to near 60 mph (95 kph) with higher gusts. Strengthening is expected over the next day or so, and Sally is forecast to become a hurricane on Monday with some additional strengthening possible before landfall Monday night.
Sally’s Forecast Track
A decrease in forward speed and a turn toward the north-northwest is forecast on Monday night, and slow north-northwestward motion is expected Tuesday. On the forecast track, the center of Sally will move over the eastern Gulf of Mexico today, move over the north-central Gulf of Mexico tonight and Monday, and approach the north-central Gulf Coast within the hurricane warning area late Monday and Monday night. Sally is expected to move farther inland over southeastern Louisiana on Tuesday and Tuesday night.
Hurricanes/tropical cyclones are the most powerful weather events on Earth. NASA’s expertise in space and scientific exploration contributes to essential services provided to the American people by other federal agencies, such as hurricane weather forecasting.
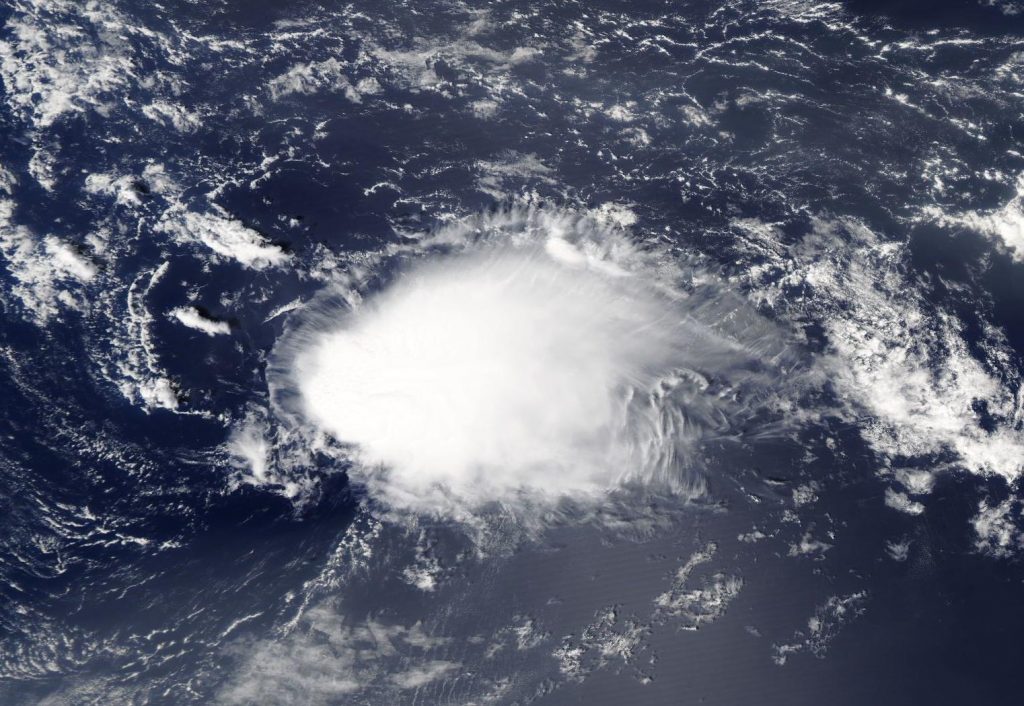
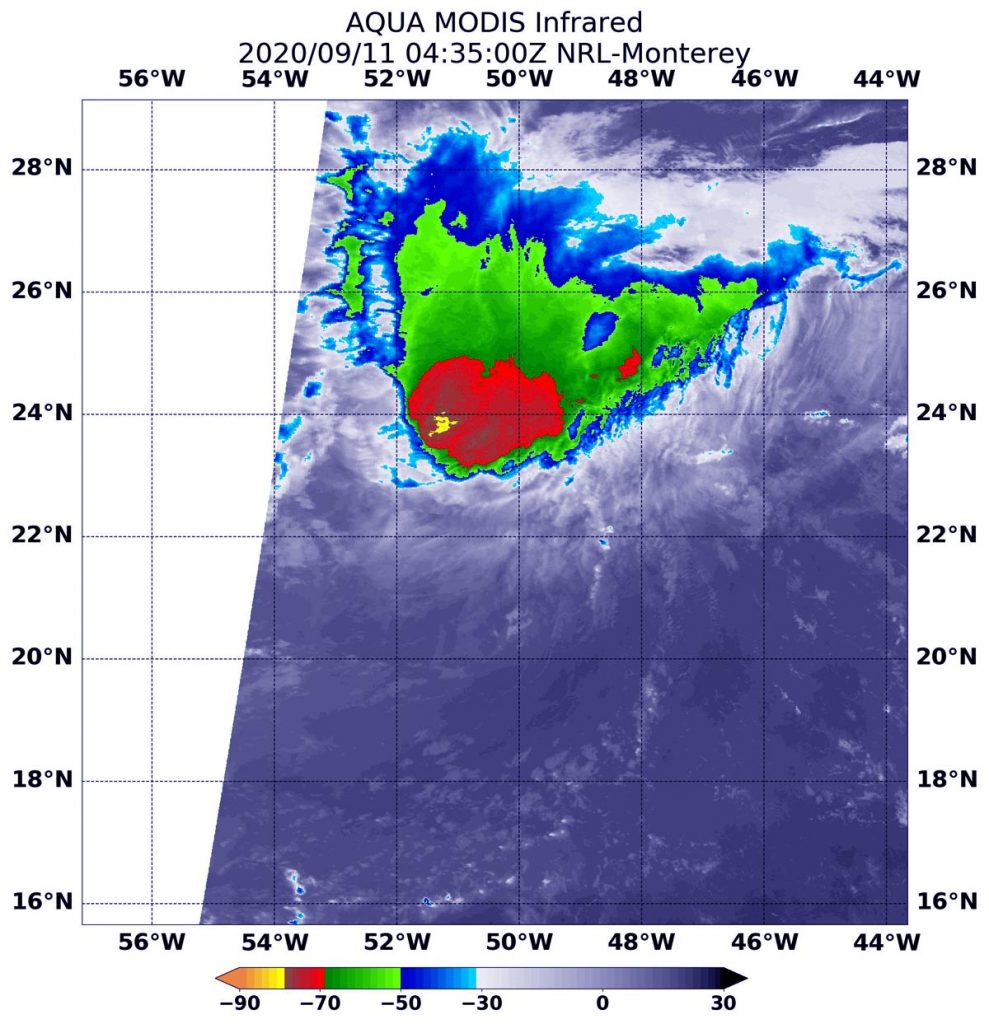
Sep. 11, 2020 – NASA Satellite Finds a Wedge-Shaped Tropical Storm Paulette
Wind shear was affecting both Tropical Storm Paulette and Rene in the Atlantic Ocean on Sept. 11. Infrared imagery from NASA’s Aqua satellite showed that strong southwesterly wind shear pushed against Paulette creating a wedge-shaped storm.
On Sept. 11 at 12:35 a.m. EDT (0435 UTC), the MODIS instrument that flies aboard NASA’s Aqua satellite revealed a small area of the most powerful thunderstorms (yellow) around Paulette’s center where cloud top temperatures were as cold as minus 80 degrees Fahrenheit (minus 62.2 Celsius). A larger area of strong storms (red) with cloud top temperatures as cold as minus 70 degrees Fahrenheit (minus 56.6. degrees Celsius) surrounded the center and were generating large amounts of rain. Credit: NASA/NRL
Wind Shear Affecting Paulette
Tropical cyclones that appear less than round are likely being affected by wind shear or outside winds transitioning into an extra-tropical cyclone or taking on the elongated appearance of a weather front. Today, Sept. 11, wind shear has given Paulette a wedge-shape.
The shape of a tropical cyclone provides forecasters with an idea of its organization and strength. When outside winds batter a storm, it can change the storm’s shape. Winds can push most of the associated clouds and rain to one side of a storm.
In general, wind shear is a measure of how the speed and direction of winds change with altitude. Tropical cyclones are like rotating cylinders of winds. Each level needs to be stacked on top each other vertically in order for the storm to maintain strength or intensify. Wind shear occurs when winds at different levels of the atmosphere push against the rotating cylinder of winds, weakening the rotation by pushing it apart at different levels.
At 5 a.m. EDT (0900 UTC) on Sept. 11, “Paulette continues to experience the effects of 35 to 40 knots of southwesterly vertical shear, which has caused the center to occasionally become exposed to the south and southwest of the primary convective bursts,” noted Jack Beven, Senior Hurricane Specialist at NOAA’s National Hurricane Center in Miami, Fla.
Infrared Data Reveals Effects of Wind Shear
NASA’s Aqua satellite uses infrared light to analyze the strength of storms by providing temperature information about the system’s clouds. The strongest thunderstorms that reach high into the atmosphere have the coldest cloud top temperatures.
On Sept. 11 at 12:35 a.m. EDT (0435 UTC), the Moderate Resolution Imaging Spectroradiometer or MODIS instrument that flies aboard NASA’s Aqua satellite revealed a very small area of Paulette’s most powerful thunderstorms around its center where cloud top temperatures were as cold as minus 80 degrees Fahrenheit (minus 62.2 Celsius). A larger area of strong storms with cloud top temperatures as cold as minus 70 degrees Fahrenheit (minus 56.6. degrees Celsius) surrounded the center. NASA research has found that storms with cloud tops as cold as at least minus 70 degrees Fahrenheit can generate heavy rain.
At 5 a.m. EDT on Sept. 11, NHC noted that the wind shear Paulette is currently experiencing should subside. However, it may be another 24 hours before it subsides enough so that significant strengthening can occur.
Paulette’s Status on Sept. 11
At 5 a.m. EDT (0900 UTC), the center of Tropical Storm Paulette was located near latitude 23.1 degrees north and longitude 51.7 degrees west. That is about 810 miles (1,305 km) east-northeast of the Northern Leeward Islands. Paulette is moving toward the west-northwest near 10 mph (17 kph). Maximum sustained winds are near 65 mph (100 kph) with higher gusts. Little change in strength is expected today. The estimated minimum central pressure is 991 millibars.
Paulette’s Weekend Forecast
NHC forecasters expect a motion toward the northwest for the next few days. On the forecast track, the center of Paulette should approach Bermuda Sunday night and Monday. Gradual strengthening is expected to begin tonight or on Saturday, and Paulette is forecast to become a hurricane this weekend.
Ocean Swells Expected from Paulette
Swells generated by Paulette are expected to reach portions of the Leeward Islands today and will continue to spread westward to portions of the Greater Antilles, Bahamas, Bermuda, and the southeastern United States into the weekend. These swells are likely to cause life-threatening surf and rip current conditions.
NASA Researches Earth from Space
For more than five decades, NASA has used the vantage point of space to understand and explore our home planet, improve lives and safeguard our future. NASA brings together technology, science, and unique global Earth observations to provide societal benefits and strengthen our nation. Advancing knowledge of our home planet contributes directly to America’s leadership in space and scientific exploration.
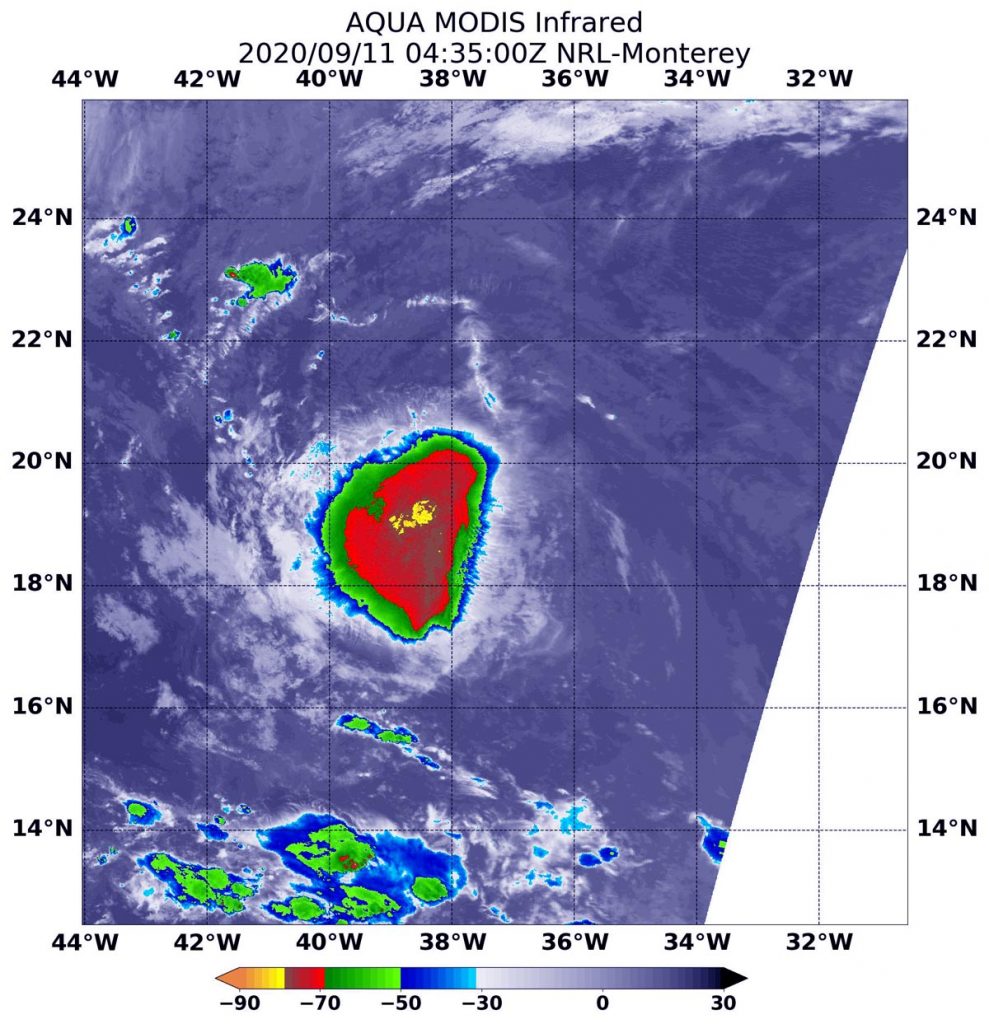
Sep. 11, 2020 – NASA Satellite Finds an Elongated Tropical Storm Rene Caused by Wind Shear
Infrared imagery from NASA’s Aqua satellite showed an elongated Tropical Storm Rene being battered by wind shear in the Central Atlantic Ocean. Tropical cyclones that appear less than round are likely being affected by wind shear or outside winds transitioning into an extra-tropical cyclone or taking on the elongated appearance of a weather front. Outside winds have given Rene’s strongest storms an appearance like that of a triangle.
On Sept. 11 at 12:35 a.m. EDT (0435 UTC), the MODIS instrument that flies aboard NASA’s Aqua satellite revealed a small area of the most powerful thunderstorms (yellow) around Rene’s center where cloud top temperatures were as cold as minus 80 degrees Fahrenheit (minus 62.2 Celsius). A larger area of strong storms (red) with cloud top temperatures as cold as minus 70 degrees Fahrenheit (minus 56.6. degrees Celsius) surrounded the center and were generating large amounts of rain. Credit: NASA/NRL
Wind Shear Affecting Rene
The shape of a tropical cyclone provides forecasters with an idea of its organization and strength. When outside winds batter a storm, it can change the storm’s shape. Winds can push most of the associated clouds and rain to one side of a storm.
In general, wind shear is a measure of how the speed and direction of winds change with altitude. Tropical cyclones are like rotating cylinders of winds. Each level needs to be stacked on top each other vertically in order for the storm to maintain strength or intensify. Wind shear occurs when winds at different levels of the atmosphere push against the rotating cylinder of winds, weakening the rotation by pushing it apart at different levels.
Infrared Data Reveals Effects of Wind Shear
NASA’s Aqua satellite uses infrared light to analyze the strength of storms by providing temperature information about the system’s clouds. The strongest thunderstorms that reach high into the atmosphere have the coldest cloud top temperatures.
On Sept. 11 at 12:35 a.m. EDT (0435 UTC), the Moderate Resolution Imaging Spectroradiometer or MODIS instrument that flies aboard NASA’s Aqua satellite revealed a small area of Rene’s most powerful thunderstorms around its center where cloud top temperatures were as cold as minus 80 degrees Fahrenheit (minus 62.2 Celsius). A larger area of strong storms with cloud top temperatures as cold as minus 70 degrees Fahrenheit (minus 56.6. degrees Celsius) surrounded the center in what looks like a triangular shape. NASA research has found that storms with cloud tops as cold as at least minus 70 degrees Fahrenheit can generate heavy rain.
At 5 a.m. EDT on Sept. 11, U.S. Navy Hurricane Specialist, Dave Roberts of NOAA’s National Hurricane Center in Miami, Fla. noted in the Rene discussion, “A microwave pass revealed that Rene’s surface center is farther separated from the shrinking deep convection. Model soundings indicate that east-southeasterly 30 to 25 knot [vertical wind] shear near 300 millibars is temporarily undercutting the diffluent southerly flow aloft.” An air pressure of 300 millibars is about 30,000 feet (9,100 meters) high in the atmosphere, but it can vary between 27,000 to 32,000 feet (8,200 to 9,600 meters).
The wind shear Rene is currently experiencing is expected to relax during the next 36 to 48 hours (from 5 a.m. EDT on Sept. 11) which should allow for gradual intensification. “By mid-period, Rene is forecast to move into an area of increasing west-northwesterly shear, which should induce a weakening trend,” Roberts noted.
Rene’s Status on Sept. 11
At 5 a.m. EDT (0900 UTC), the center of Tropical Storm Rene was located near latitude 19.7 degrees north and longitude 38.5 degrees west. Rene is 985 miles (1,585 km) west-northwest of the Cabo Verde Islands. Rene is moving toward the west-northwest near 10 mph (17 kph). This general motion is expected to continue through Friday night, followed by a turn toward the northwest on Saturday. Maximum sustained winds are near 45 mph (75 kph) with higher gusts. The estimated minimum central pressure is 1002 millibars.
Rene’s Weekend Forecast
NHC forecasters expect a north-northwestward and northward motion with a decrease in forward speed on Sunday and Sunday night [Sept. 13]. Gradual strengthening is forecast during the couple of days. Afterward, weakening is expected to begin by Sunday night.
NASA Researches Earth from Space
For more than five decades, NASA has used the vantage point of space to understand and explore our home planet, improve lives and safeguard our future. NASA brings together technology, science, and unique global Earth observations to provide societal benefits and strengthen our nation. Advancing knowledge of our home planet contributes directly to America’s leadership in space and scientific exploration.