Savannah (Southern Indian Ocean)

Mar. 21, 2019 – Tropical Cyclone Savannah Dissipating in Suomi NPP Satellite Imagery

Tropical Cyclone Savannah appeared as a wispy area of low pressure on imagery from NASA-NOAA’s Suomi NPP satellite.
Suomi NPP Image of Savannah
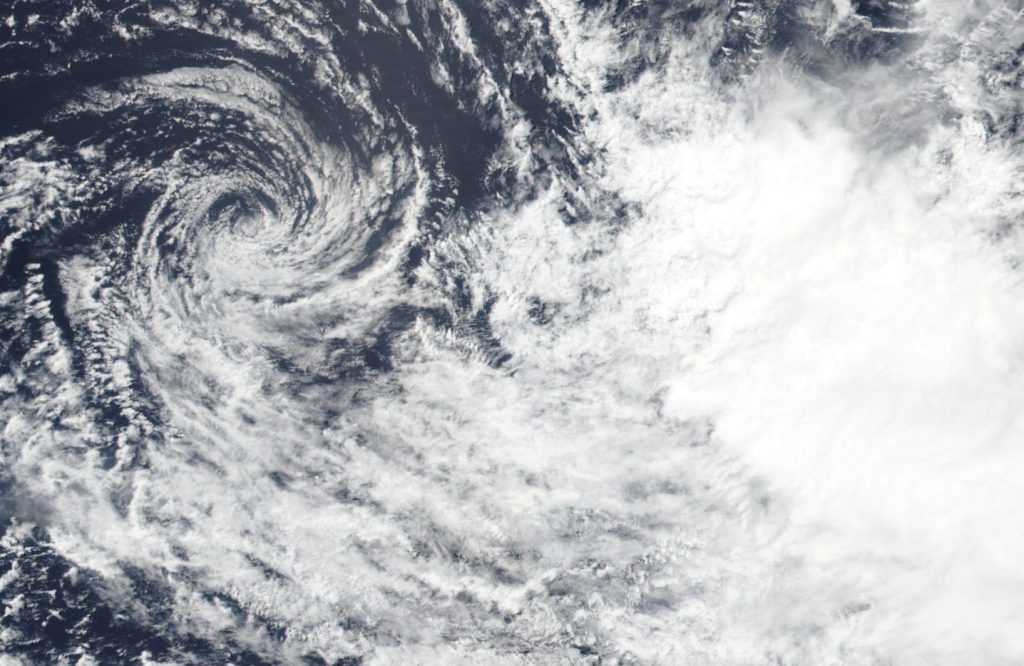
NASA-NOAA’s Suomi NPP satellite passed over the Southern Indian Ocean and captured a visible image of Tropical Cyclone Savannah dissipating on March 21. Credit: NASA Worldview, Earth Observing System Data and Information System (EOSDIS).

Suomi NPP passed over Savannah on March 21, 2019 and the Visible Infrared Imaging Radiometer Suite (VIIRS) instrument provided a visible image of the storm as wind shear continued to tear it apart. The VIIRS image showed wispy clouds around the center of circulation, and the bulk of clouds pushed off far from the center to the southeast. That’s because of strong vertical wind shear from the northwest of the storm.

In general, wind shear is a measure of how the speed and direction of winds change with altitude. Tropical cyclones are like rotating cylinders of winds. Each level needs to be stacked on top each other vertically in order for the storm to maintain strength or intensify. Wind shear occurs when winds at different levels of the atmosphere push against the rotating cylinder of winds, weakening the rotation by pushing it apart at different levels.

The wind shear affecting Savannah has been strong for the last couple of days.

The Joint Typhoon Warning Center (JTWC) provided the final warning on the system at 5 a.m. EDT (0900 UTC) when it was located 1,026 nautical miles southeast of Diego Garcia near

19.8 degrees south latitude and 84.3 degrees east longitude. Savannah’s maximum sustained winds had dropped to 35 knots (40 mph).

Savannah is expected to dissipate later in the day on March 21.

By Rob Gutro 
NASA’s Goddard Space Flight Center

Savannah (Southern Indian Ocean)

Mar. 20, 2019 – NASA’s Terra Satellite Eyes a Weaker Tropical Cyclone Savannah

Tropical Cyclone Savannah visibly showed the effects of wind shear in imagery from NASA’s Terra satellite.

Terra image of Savannah
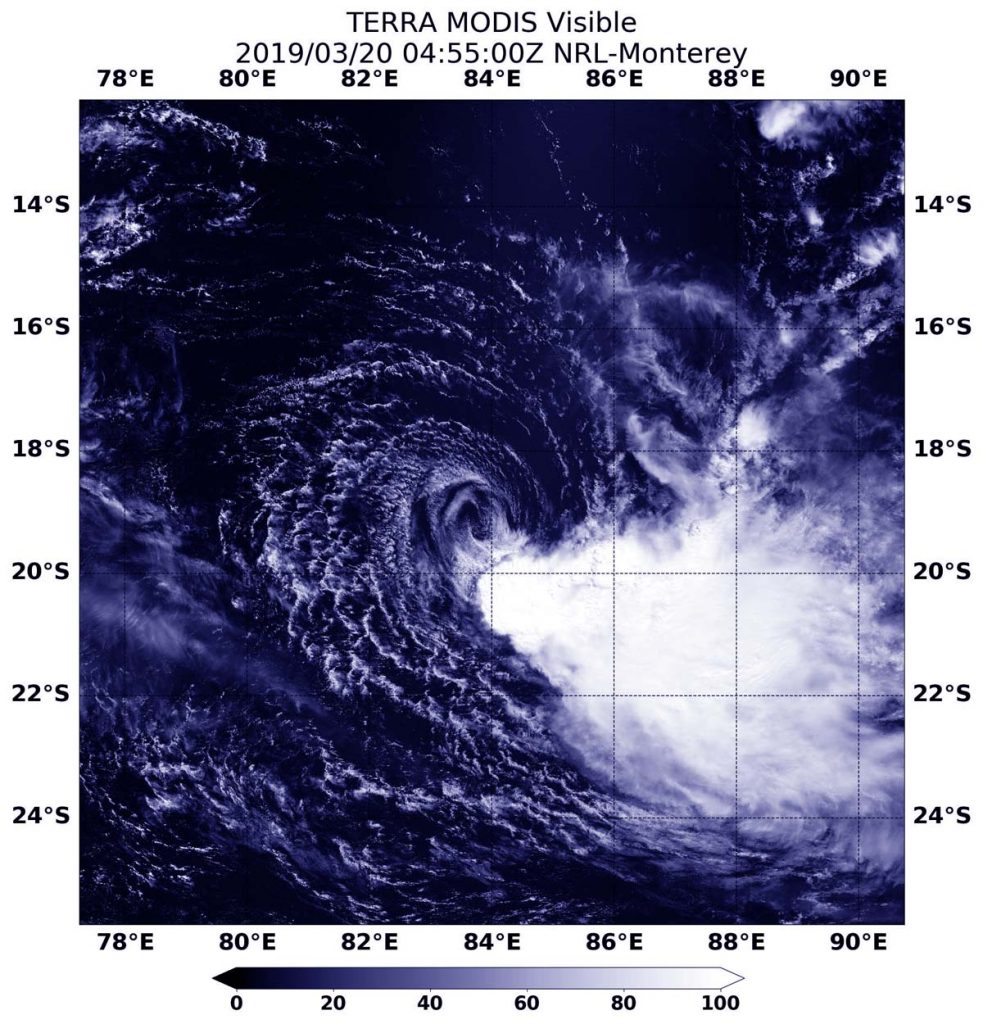
On March 20, 2019, the MODIS instrument aboard NASA’s Terra satellite provided a visible image of Tropical Cyclone Savannah in the Southern Indian Ocean. Credit: NASA/NRL

On March 20, 2019 at 12:55 a.m. EDT (0455 UTC) the Moderate Resolution Imaging Spectroradiometer or MODIS instrument aboard NASA’s Terra satellite captured a visible image of the storm that revealed the bulk of clouds and showers were pushed southeast of the center from strong vertical wind shear. That wind shear was at a rate of 25 to 40 knots. Although most of the clouds were pushed away from the center, a ghostly ring of clouds still circled the circulation center.

At 11 a.m. EDT (1500 UTC) on March 20, 2019, maximum sustained winds near Savannah’s center were near 40 knots (46 mph/74 kph). Savannah was centered near 19.1 degrees south latitude and 83.3 degrees east longitude. That’s about 964 nautical miles (1,109 miles/1785 kilometers) southeast of Diego Garcia. Diego García is an atoll just south of the equator in the central Indian Ocean. Savannah was slowly tracking to the west.

The Joint Typhoon Warning Center forecasts Savannah to track west-southwestward over the next 36 hours while gradually dissipating under the persistent influence of strong vertical wind shear.

By Rob Gutro
NASA’s Goddard Space Flight Center

Savannah (Southern Indian Ocean)

Mar. 19, 2019 – NASA’s Terra Satellite Finds Wind Shear Weakening Savannah

NASA’s Terra satellite passed over the Southern Indian Ocean captured an image of Tropical Cyclone Savannah that showed wind shear was taking a toll on the storm.

Terra image of Savannah
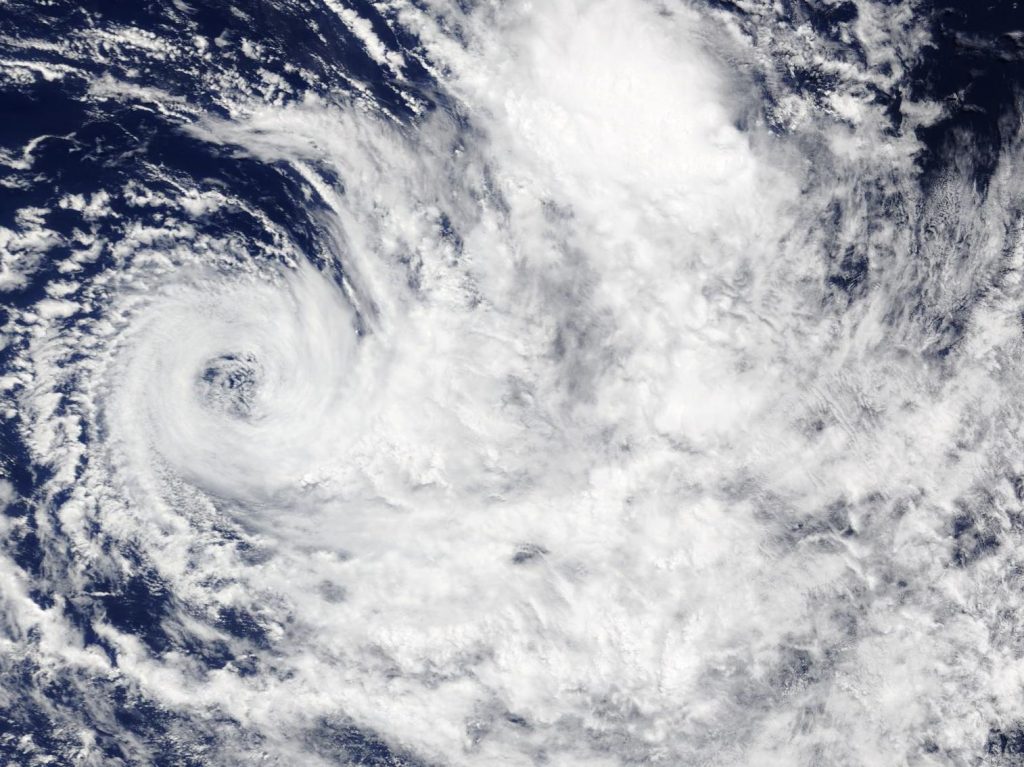
On March 19, NASA’s Terra satellite captured a visible image of Tropical Cyclone Savannah being affected by wind shear in the Southern Indian Ocean.
Credit: NASA Worldview, Earth Observing System Data and Information System (EOSDIS)

On March 19 the Moderate Resolution Imaging Spectroradiometer or MODIS instrument aboard NASA’s Terra satellite provided a visible image of Tropical Cyclone Savannah. Satellite imagery showed a ring of thunderstorms around the center of circulation, but the bulk of clouds had been pushed to the east and south of the center. Savannah was being affected by northwesterly vertical wind shear.

In general, wind shear is a measure of how the speed and direction of winds change with altitude. Wind shear can tear a tropical cyclone apart or weaken it. Moderate winds from the northwest are pushing against Savannah and blowing the bulk of clouds to the southeast of the center.

At 5 a.m. EDT (0900 UTC) the center of Savannah was located near latitude 18.2 degrees south and longitude 87.5 degrees east. That’s about 1,019 nautical miles southeast of Diego Garcia. Savannah was moving to the west. Maximum sustained winds were near 40 knots (46 mph/74 kph).

The Joint Typhoon Warning Center forecast calls for Savannah to continue weakening. Savannah is expected to maintain its west southwesterly trajectory until dissipation, over the next two days.

By Rob Gutro
NASA’s Goddard Space Flight Center

Savannah (Southern Indian Ocean)

Mar. 15, 2019 – Satellite Sees Tropical Cyclone Savannah Moving Away from Indonesia

Tropical Cyclone Savannah continued to move in southerly direction in the Southern Indian Ocean, and move away from Indonesia. NASA-NOAA’s Suomi NPP satellite provided a visible image of the storm. Savannah is no threat to land areas.

Suomi NPP Image of Savannah
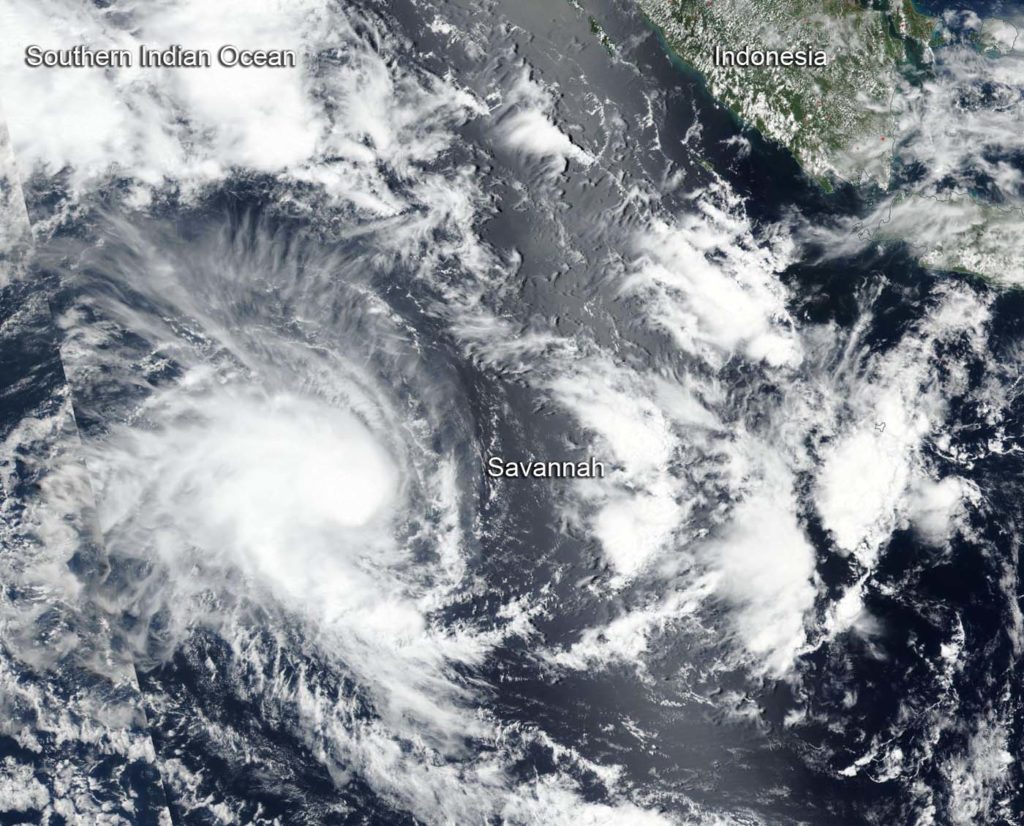
NASA-NOAA’s Suomi NPP satellite passed over the Southern Indian Ocean and captured a visible image of Tropical Cyclone Savannah on March 15, as it continued to move away from Indonesia. Credit: NASA Worldview, Earth Observing System Data and Information System (EOSDIS).

Savannah formed on March 14 as Tropical Cyclone 19S and once it strengthened into a tropical storm it was renamed.

Suomi NPP passed over Savannah on March 15 and the Visible Infrared Imaging Radiometer Suite (VIIRS) instrument provided a visible image of the storm. The VIIRS image showed a rounded area of storms around the low-level center of circulation with a band of thunderstorms feeding into the center, extending to the southeast. The Joint Typhoon Warning Center (JTWC) noted “animated enhanced infrared satellite imagery depicts a consolidating system with a central dense overcast feature persisting over the low-level circulation center.” A microwave image showed tightly-curved bands of thunderstorms wrapping around an eye feature, indicating the storm was strengthening.

Savannah is forecast to move towards the southwest over the coming days, continuing on its path away from Indonesia. At 11 a.m. EDT (1500 UTC), Savannah was near 14.4 degrees south longitude and 98.4 degrees east latitude, about 185 nautical miles southwest of Cocos Island. Maximum sustained winds were near 55 knots (63 mph/102 kph).

Forecasters at the Joint Typhoon Warning Center noted that Savannah will move southwest, later turning west-southwest, while intensifying to 80 knots after three days. The storm will then start to weaken.

By Rob Gutro 
NASA’s Goddard Space Flight Center