Trevor (Southwestern Pacific Ocean)

March 22, 2019 – Tropical Cyclone Trevor Fills Australia’s Gulf of Carpentaria in NASA Image
On March 22, 2019, the MODIS instrument aboard NASA's Aqua satellite provided a visible image of Tropical Cyclone Trevor, filling up the Gulf of Carpentaria. Credit: NASA Worldview, Earth Observing System Data and Information System (EOSDIS)
On March 22, 2019, the MODIS instrument aboard NASA’s Aqua satellite provided a visible image of Tropical Cyclone Trevor, filling up the Gulf of Carpentaria. Credit: NASA Worldview, Earth Observing System Data and Information System (EOSDIS)

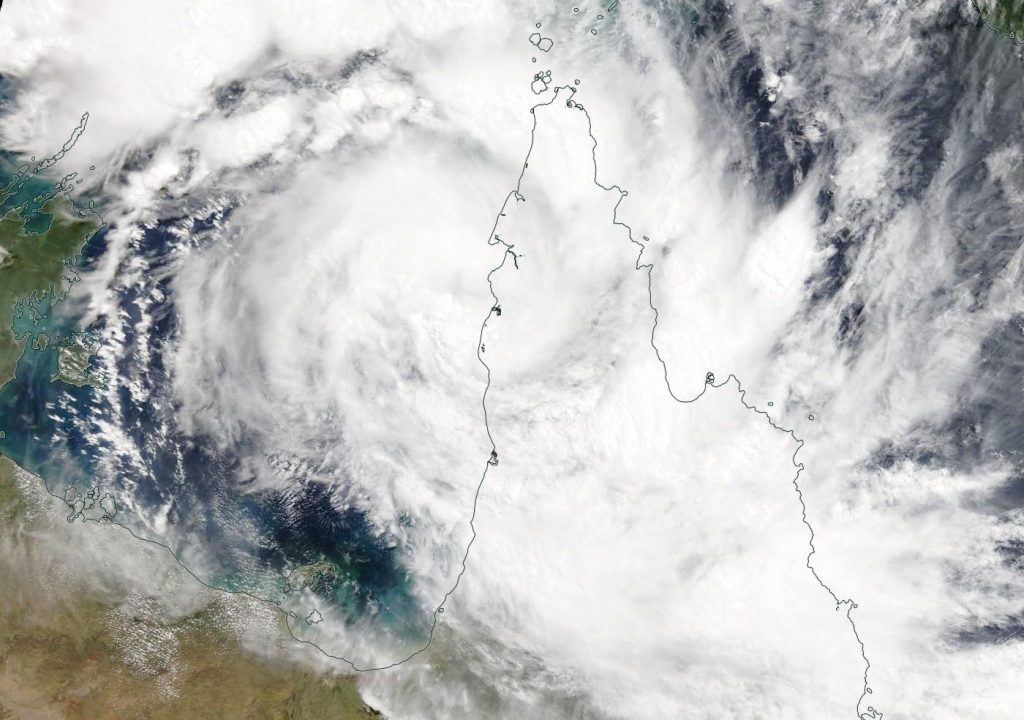
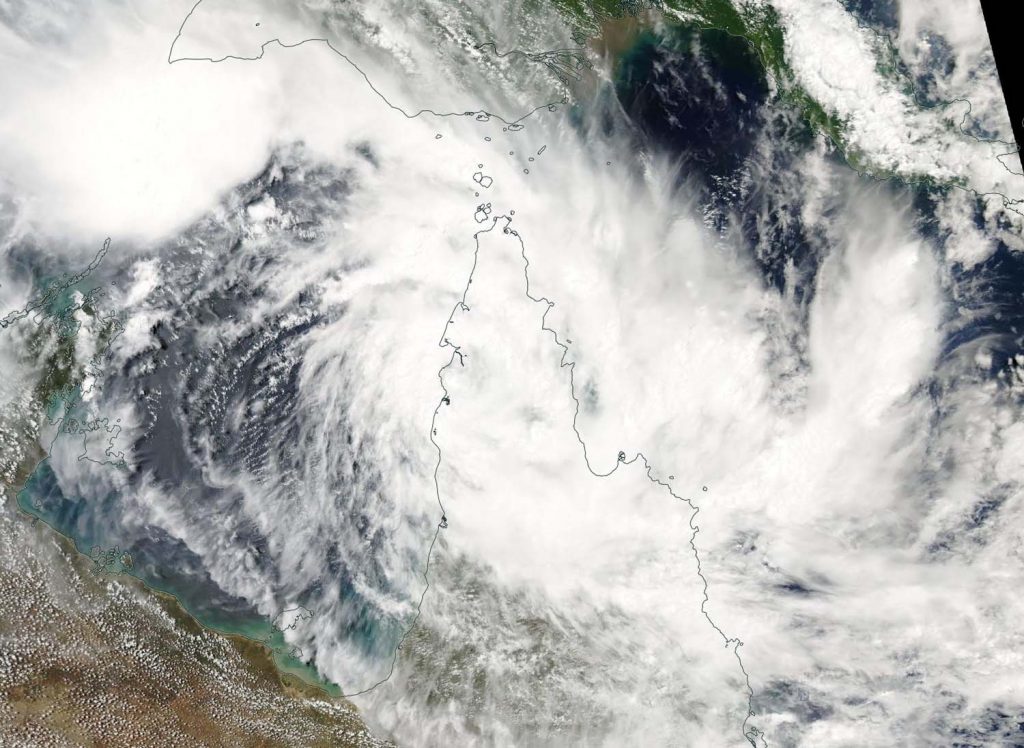
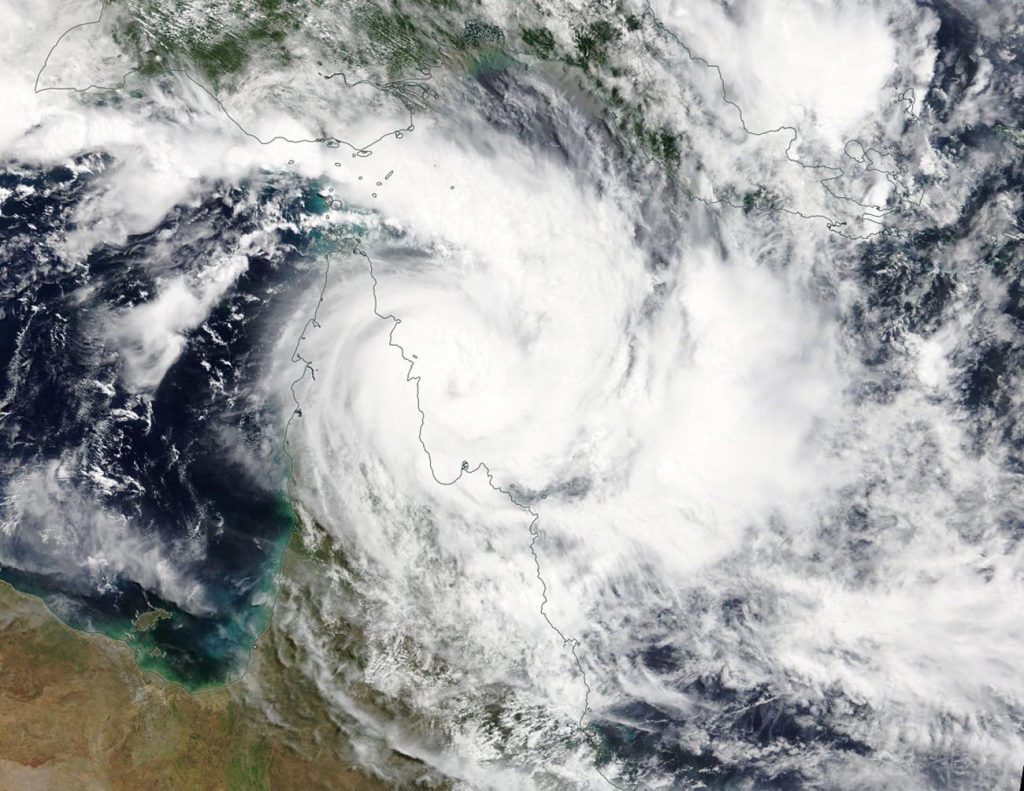
Visible imagery from NASA’s Aqua satellite showed Tropical Cyclone Trevor filling up Australia’s Gulf of Carpentaria.

The Gulf of Carpentaria is a large, shallow sea. It is surrounded on three sides by northern Australia and bounded by the Arafura Sea to the north.

Trevor had crossed the Cape York Peninsula on March 21 and moved into the Gulf. On On March 22 the Moderate Resolution Imaging Spectroradiometer or MODIS instrument aboard NASA’s Aqua satellite provided a visible image of Trevor. Satellite imagery revealed that Trevor’s clouds had filled up the Gulf. It showed that bands of thunderstorms circled more tightly around the center of circulation than the previous day.

The Australian Bureau of Meteorology or ABM updated warnings and watches on March 22, 2019. The Warning Zone includes Alyangula in the Northern Territory to Burketown in Queensland, and inland parts of the eastern Carpentaria District and the northwest Gulf Country, including Groote Eylandt, Mornington Island, Borroloola, Robinson River, Wollogorang, McArthur River, Cape Crawford, Creswell Downs, Brunette Downs and Doomadgee. The Watch Zone includes inland parts of the northwest Gulf Country in Queensland and the western Carpentaria and central Barkly Districts in the Northern Territory.

At 8 a.m. EDT (9:30 p.m. Australian Central Standard Time or ACST) on March 22, 2019, maximum sustained winds near Trevor’s center were near 90 miles (150 kilometers) per hour. Trevor was centered near 15.0 degrees south latitude and 138.9 degrees east longitude. That’s about 110 miles (185 kilometers) north or Mornington Island.

ABM noted “Dangerous conditions are expected tonight along the southern Gulf of Carpentaria coast as Severe Tropical Cyclone Trevor approaches. The cyclone is expected to cross the coast during Saturday morning, March 23, between Port McArthur and the Northern Territory/Queensland border.”

Destructive winds, very heavy rainfall and storm surge are expected with this storm. ABM said “Coastal residents between Port Roper and the NT/Queensland Border are specifically warned of a very dangerous storm tide as the cyclone center approaches the coast. Tides will rise significantly above the normal high tide, with damaging waves and very dangerous flooding during Friday night and Saturday. As the cyclone approaches the coast, a storm tide is also expected between the Northern Territory/Queensland border and Burketown. Large waves may produce minor flooding along the foreshore.”

For updated forecasts from the Australian Bureau of Meteorology, visit: http://www.bom.gov.au

By Rob Gutro
NASA’s Goddard Space Flight Center, Greenbelt, Md.

Trevor (Southwestern Pacific Ocean)

Mar. 21, 2019 – NASA Sees Tropical Cyclone Trevor Move Into Gulf of Carpentaria

Tropical Cyclone Trevor has crossed Queensland, Australia’s Cape York Peninsula and re-emerged into the Gulf of Carpentaria. Visible imagery from NASA’s Terra satellite confirmed the movement back over water.

Terra image of Trevor
On March 21, 2019, the MODIS instrument aboard NASA’s Terra satellite provided a visible image of Tropical Cyclone Trevor re-emerge over waters in Australia’s Gulf of Carpentaria. Credit: NASA Worldview, Earth Observing System Data and Information System (EOSDIS)

Tropical Cyclone Trevor is expected to intensify in the Gulf of Carpentaria. A severe impact on the southwestern Gulf of Carpentaria coast is likely over the weekend, according to the Australian Bureau of Meteorology or ABM.

On March 21 the Moderate Resolution Imaging Spectroradiometer or MODIS instrument aboard NASA’s Terra satellite provided a visible image of Trevor. Trevor hadn’t strengthened enough over water yet to develop an eye in visible imagery, but the center was surrounded by powerful thunderstorms. Microwave satellite imagery suggests that an eye has re-developed.

ABM updated warnings and watches on March 21, 2019. The Warning zone stretches from Cape Shield in the Northern Territory to Burketown in Queensland, including Borroloola, Groote Eylandt and Mornington Island, and Kowanyama to Aurukun. Watch Zone goes from Burketown to Karumba.

At 11 a.m. EDT on March 21, (12:30 a.m. AWST Australian Eastern Standard Time on March 22), maximum sustained winds near Trevor’s center were near 68 miles (110 kilometers) per hour. Trevor was a strong tropical storm. Trevor was located near 13.9 degrees South latitude and 140.6 degrees East longitude, about be 84 miles (135 kilometers) west southwest of Aurukun and 283 miles (455 kilometers) east of Alyangula. Tropical Cyclone Trevor is located over water in the eastern Gulf of Carpentaria.

ABM forecasts that “Tropical Cyclone Trevor will intensify further as it adopts a more general southwest movement across the Gulf of Carpentaria tonight and during Friday. It is likely to cross the Northern Territory coast during Saturday as a category 4 severe tropical cyclone.” Trevor is expected to make landfall near Borroloola.

For updated forecasts from the Australian Bureau of Meteorology, visit: http://www.bom.gov.au

By Rob Gutro
NASA’s Goddard Space Flight Center

Savannah (Southern Indian Ocean)

Mar. 21, 2019 – Tropical Cyclone Savannah Dissipating in Suomi NPP Satellite Imagery

Tropical Cyclone Savannah appeared as a wispy area of low pressure on imagery from NASA-NOAA’s Suomi NPP satellite.

Suomi NPP Image of Savannah
NASA-NOAA’s Suomi NPP satellite passed over the Southern Indian Ocean and captured a visible image of Tropical Cyclone Savannah dissipating on March 21. Credit: NASA Worldview, Earth Observing System Data and Information System (EOSDIS).

Suomi NPP passed over Savannah on March 21, 2019 and the Visible Infrared Imaging Radiometer Suite (VIIRS) instrument provided a visible image of the storm as wind shear continued to tear it apart. The VIIRS image showed wispy clouds around the center of circulation, and the bulk of clouds pushed off far from the center to the southeast. That’s because of strong vertical wind shear from the northwest of the storm.

In general, wind shear is a measure of how the speed and direction of winds change with altitude. Tropical cyclones are like rotating cylinders of winds. Each level needs to be stacked on top each other vertically in order for the storm to maintain strength or intensify. Wind shear occurs when winds at different levels of the atmosphere push against the rotating cylinder of winds, weakening the rotation by pushing it apart at different levels.

The wind shear affecting Savannah has been strong for the last couple of days.

The Joint Typhoon Warning Center (JTWC) provided the final warning on the system at 5 a.m. EDT (0900 UTC) when it was located 1,026 nautical miles southeast of Diego Garcia near

19.8 degrees south latitude and 84.3 degrees east longitude. Savannah’s maximum sustained winds had dropped to 35 knots (40 mph).

Savannah is expected to dissipate later in the day on March 21.

By Rob Gutro 
NASA’s Goddard Space Flight Center

Veronica (Southern Indian Ocean)

Mar. 21, 2019 – NASA Sees Tropical Cyclone Veronica Affecting Australia’s Pilbara Coast

Visible imagery from NASA’s Terra satellite showed Tropical Cyclone Veronica skirting the Pilbara coast of Western Australia.

Terra image of Veronica
On March 21, 2019, the MODIS instrument aboard NASA’s Terra satellite provided a visible image of Tropical Cyclone Veronica in the Southern Indian Ocean, and affecting the Pilbara coast of Western Australia. Credit: NASA Worldview, Earth Observing System Data and Information System (EOSDIS)

On March 21 the Moderate Resolution Imaging Spectroradiometer or MODIS instrument aboard NASA’s Terra satellite provided a visible image of Veronica. Veronica had a 10 nautical mile wide pinhole eye surrounded by powerful thunderstorms. Bands of thunderstorms spiraled into the center of circulation from the northwest and east. Veronica’s southeastern quadrant was spreading clouds along the Pilbara coastline of northern Western Australia.

The Australian Bureau of Meteorology or ABM updated warnings and watches on March 21, 2019. The Warning zone stretches from Pardoo to Mardie including Port Hedland, Karratha and Barrow Island. The Watch zone stretches from Pardoo to Wallal Downs, Mardie to Onslow and extending to the inland Pilbara to include Pannawonica, Tom Price and Marble Bar.

At 8:48 a.m. EDT (8:48 p.m. AWST Australian Western Standard Time) on March 21, 2019, maximum sustained winds near Veronica’s center were near 121 miles (195 kilometers) per hour. Veronica was centered near 17.3 degrees south latitude and 117.3 degrees east longitude. That’s about 223 miles (360 kilometers) north-northwest of Port Hedland and 239 miles (385 kilometers) north of Karratha.

AMB noted in that advisory, “Severe Tropical Cyclone Veronica, a Category 4 system, is moving slowly towards the Pilbara coast. The cyclone should continue its south to southwest track tonight and Friday before taking a more south southeast track on Saturday. Whilst it is possible that the cyclone may weaken before reaching the Pilbara coast, a severe coastal impact is likely.”

ABM forecasts Veronica to move in a southerly direction and make landfall on March 24, near Whim Creek. Whim Creek is located between Port Hedland to the northeast and Exmouth to the southwest.

For updated forecasts from the Australian Bureau of Meteorology, visit: http://www.bom.gov.au

By Rob Gutro
NASA’s Goddard Space Flight Center

Savannah (Southern Indian Ocean)

Mar. 20, 2019 – NASA’s Terra Satellite Eyes a Weaker Tropical Cyclone Savannah

Tropical Cyclone Savannah visibly showed the effects of wind shear in imagery from NASA’s Terra satellite.

Terra image of Savannah
On March 20, 2019, the MODIS instrument aboard NASA’s Terra satellite provided a visible image of Tropical Cyclone Savannah in the Southern Indian Ocean. Credit: NASA/NRL

On March 20, 2019 at 12:55 a.m. EDT (0455 UTC) the Moderate Resolution Imaging Spectroradiometer or MODIS instrument aboard NASA’s Terra satellite captured a visible image of the storm that revealed the bulk of clouds and showers were pushed southeast of the center from strong vertical wind shear. That wind shear was at a rate of 25 to 40 knots. Although most of the clouds were pushed away from the center, a ghostly ring of clouds still circled the circulation center.

At 11 a.m. EDT (1500 UTC) on March 20, 2019, maximum sustained winds near Savannah’s center were near 40 knots (46 mph/74 kph). Savannah was centered near 19.1 degrees south latitude and 83.3 degrees east longitude. That’s about 964 nautical miles (1,109 miles/1785 kilometers) southeast of Diego Garcia. Diego García is an atoll just south of the equator in the central Indian Ocean. Savannah was slowly tracking to the west.

The Joint Typhoon Warning Center forecasts Savannah to track west-southwestward over the next 36 hours while gradually dissipating under the persistent influence of strong vertical wind shear.

By Rob Gutro
NASA’s Goddard Space Flight Center

Veronica (Southern Indian Ocean)

Mar. 20, 2019 – NASA’s Aqua Satellite Sees Tropical Cyclone Veronica Develop Off Western Australia’s Coast

NASA’s Aqua satellite provided a view of Tropical Cyclone Veronica after it developed off the northern coast of Western Australia.

Aqua image of Veronica
On March 20, 2019, the MODIS instrument aboard NASA’s Aqua satellite provided a visible image of Tropical Cyclone Veronica in the Southern Indian Ocean, off the coast of Western Australia. Credit: NASA Worldview, Earth Observing System Data and Information System

On March 20, 2019 the Moderate Resolution Imaging Spectroradiometer or MODIS instrument aboard NASA’s Aqua satellite captured a visible image of the storm that revealed bands of thunderstorms spiraling into the center of circulation. The Joint Typhoon Warning Center noted that the system continued to consolidate as rain bands wrapped tighter toward a pinhole formative eye. When Aqua passed over Veronica, the storm’s southeastern quadrant was brushing the Dampier Peninsula. That peninsula is located north of Broome and Roebuck Bay in Western Australia and bordered by the Indian Ocean to the west and north and King Sound to the east.

Although there are not yet any warnings in place, the Australian Bureau of Meteorology or ABM has posted a watch area from Pardoo to Mardie, including Port Hedland and Karratha, Western Australia. A Blue Alert is in effect for people in or near communities between Mardie and Pardoo, including Port Hedland, South Hedland, Wickham, Roebourne, Point Samson, Karratha and Dampier. ABM recommends those residents to prepare for cyclonic weather and organize an emergency kit including first aid kit, torch, portable radio, spare batteries, food and water.

At 8:47 a.m. EDT (8:47 p.m. AWST Australia local time) on March 20, 2019, maximum sustained winds near Veronica’s center were near 75 miles (120 kilometers) per hour, making it a Category 1 hurricane on the Saffir-Simpson Hurricane Wind Scale. Trevor was centered near 15.8 degrees south latitude and 118.0 degrees east longitude. That’s about 314 miles (505 kilometers) north of Port Hedland. ABM noted “The cyclone is expected to continue tracking west southwest tonight and during Thursday, March 21. On Friday, March 22, the system will intensify further as it adopts a more southerly track, towards the Pilbara coast.”

ABM forecasts that Veronica will turn to the south and head toward Karratha by March 23. Residents along the Pilbara coast should prepare for Veronica.

For updated forecasts from the Australian Bureau of Meteorology, visit: http://www.bom.gov.au

By Rob Gutro
NASA’s Goddard Space Flight Center

Trevor (Southwestern Pacific Ocean)

Mar. 20, 2019 – NASA’s Terra Satellite Tracks Tropical Cyclone Trevor Over Cape York Peninsula

Visible imagery from NASA’s Terra satellite showed Tropical Cyclone Trevor was moving west over Queensland, Australia’s Cape York Peninsula and toward the Gulf of Carpentaria.

Aqua image of Trevor
On March 20, 2019, the MODIS instrument aboard NASA’s Terra satellite provided a visible image of Tropical Cyclone Trevor as it began exiting Queensland, Australia’s Cape York Peninsula and moving into the Gulf of Carpentaria. Credit: NASA Worldview, Earth Observing System Data and Information System (EOSDIS)

On March 20 the Moderate Resolution Imaging Spectroradiometer or MODIS instrument aboard NASA’s Terra satellite provided a visible image of Trevor.

The Australian Bureau of Meteorology or ABM has posted warnings and watches. The Warning zone ranges from Pormpuraaw to Cape York. The Watch zone includes Nhulunbuy to Northern Territory/Queensland border and Kowanyama to Pormpuraaw.

At 9:21 a.m. EDT (11:21 p.m. AEST Australia local time) on March 20, 2019, maximum sustained winds near Trevor’s center were near 40 miles (65 kilometers) per hour. Trevor was centered near 12.9 degrees south latitude and 141.8 degrees east longitude. That’s about 19 miles (30 kilometers) south-southwest of Weipa. The cyclone is expected to move offshore over the eastern Gulf of Carpentaria tonight, where it is expected to rapidly intensify.

ABM forecasts that Trevor will move to the west-southwest through the Gulf of Carpentaria over the next couple of days and make landfall on March 23, north of Port McArthur, Northern Territory. ABM noted “It is likely to cross the Northern Territory coast during Saturday as a category 4 severe tropical cyclone.”

For updated forecasts from the Australian Bureau of Meteorology, visit: http://www.bom.gov.au


By Rob Gutro
NASA’s Goddard Space Flight Center

Savannah (Southern Indian Ocean)

Mar. 19, 2019 – NASA’s Terra Satellite Finds Wind Shear Weakening Savannah

NASA’s Terra satellite passed over the Southern Indian Ocean captured an image of Tropical Cyclone Savannah that showed wind shear was taking a toll on the storm.

Terra image of Savannah
On March 19, NASA’s Terra satellite captured a visible image of Tropical Cyclone Savannah being affected by wind shear in the Southern Indian Ocean.
Credit: NASA Worldview, Earth Observing System Data and Information System (EOSDIS)

On March 19 the Moderate Resolution Imaging Spectroradiometer or MODIS instrument aboard NASA’s Terra satellite provided a visible image of Tropical Cyclone Savannah. Satellite imagery showed a ring of thunderstorms around the center of circulation, but the bulk of clouds had been pushed to the east and south of the center. Savannah was being affected by northwesterly vertical wind shear.

In general, wind shear is a measure of how the speed and direction of winds change with altitude. Wind shear can tear a tropical cyclone apart or weaken it. Moderate winds from the northwest are pushing against Savannah and blowing the bulk of clouds to the southeast of the center.

At 5 a.m. EDT (0900 UTC) the center of Savannah was located near latitude 18.2 degrees south and longitude 87.5 degrees east. That’s about 1,019 nautical miles southeast of Diego Garcia. Savannah was moving to the west. Maximum sustained winds were near 40 knots (46 mph/74 kph).

The Joint Typhoon Warning Center forecast calls for Savannah to continue weakening. Savannah is expected to maintain its west southwesterly trajectory until dissipation, over the next two days.

By Rob Gutro
NASA’s Goddard Space Flight Center

Trevor (Southwestern Pacific Ocean)

Mar. 19, 2019 – NASA Tracks Tropical Cyclone Trevor Approaching Australia’s Cape York Peninsula

Tropical Cyclone Trevor appeared to have a cloud-filled eye in visible imagery from NASA-NOAA’s Suomi NPP satellite.

Terra image of Trevor
On March 19 the VIIRS instrument aboard NASA-NOAA’s Suomi NPP satellite captured a visible image of Tropical Cyclone Trevor in the Southern Pacific Ocean as it was approaching the Cape York Peninsula of Queensland, Australia. Credit: NASA Worldview, Earth Observing System Data and Information System (EOSDIS)

On March 19, 2019 the Visible Infrared Imaging Radiometer Suite (VIIRS) instrument aboard NASA-NOAA’s Suomi NPP satellite captured visible image of Tropical Cyclone Trevor as it continued moving west through the Coral Sea, Southern Pacific Ocean, and toward a landfall in Queensland, Australia’s Cape York Peninsula. VIIRS imagery showed powerful thunderstorms wrapping into the low-level center. At the time of the image, Trevor’s western quadrant was already over the Peninsula, and the eye appeared covered by high clouds.

After the Suomi NPP image, Trevor crossed the coast in the evening (local time) and remains slow moving just south of Lockhart River.

On March 18 (EDT), the Australian Bureau of Meteorology or ABM posted a warning from Orford Ness to Cape Melville, including Lockhart River and Coen, and Pormpuraaw to Cape York, including Weipa and Aurukun.

At 8:51 a.m. EDT (10:51 p.m. AEST local time, Australia), the ABM noted that maximum sustained winds near the center were 130 kilometers per hour (80 mph). Trevor’s center was located near 12.9 degrees south and 143.3 degrees east, about 15 kilometers (8 miles) south of Lockhart River and 160 kilometers (9 miles) east southeast of Weipa. Trevor was moving to the west.

ABM said “The cyclone will weaken as it crosses the northern Peninsula tonight and Wednesday, but is expected to remain a category 1 cyclone until it enters the Gulf of Carpentaria later on Wednesday. It is expected to re-intensify rapidly once it enters the Gulf of Carpentaria and track towards the Northern Territory.”

For updated forecasts from ABM, visit: http://www.bom.gov.au/cyclone/index.shtml

By Rob Gutro
NASA’s Goddard Space Flight Center

03W (Northwestern Pacific Ocean)

Mar. 18, 2019 – NASA-NOAA Satellite Catches Last Burst of Energy in Tropical Depression 03W

Tropical Depression 03W has dissipated in the Northwestern Pacific Ocean, but not without one last show of strength on infrared satellite imagery.

Suomi NPP image of 03W
On March 18 at 1:30 a.m. EDT (0530 UTC), the VIIRS instrument aboard NASA-NOAA’s Suomi NPP satellite looked at Tropical Depression 03W in infrared light. VIIRS found coldest cloud top temperatures off-center as cold as or colder than minus 80 degrees (yellow) Fahrenheit (minus 62.2 degrees Celsius). Credit: NASA/NRL

NASA-NOAA’s Suomi NPP satellite provided an infrared look at Tropical Depression 03W that revealed a burst of strong storms pushing high into the troposphere. 03W’s circulation center was also displaced from the bulk of clouds and precipitation. That’s an indication that vertical wind shear is affecting the storm.

What is Vertical Wind Shear?

In general, wind shear is a measure of how the speed and direction of winds change with altitude. In order to understand how it affects a tropical cyclone or hurricane, think of a tropical cyclone as a series of vertically stacked tires, all rotating. As you go up from the ground, each tire represents the rotation of the storm’s center at a higher level in the atmosphere. The different levels of rotating winds in the center of tropical cyclones need to be stacked on top each other to strengthen. If there are winds higher up that push some of the tires askew near the top, it affects the balance and rotation of the tires below. That’s what happens when vertical wind shear pushes against a storm. It pushes the center and weakens (or wobbles) the rotation of all of the tires.

The Satellite Data Reveal

On March 18 at 1:30 a.m. EDT (0530 UTC), the Visible Infrared Imaging Radiometer Suite (VIIRS) instrument aboard NASA-NOAA’s Suomi NPP satellite analyzed Tropical Storm Depression 03W off-center were as cold as or colder than minus 80 degrees Fahrenheit (minus 62.2 degrees Celsius). NASA research has found that cloud top temperatures as cold as or colder than the 70F/56.6C threshold have the capability to generate heavy rainfall.

The final warning for 03W was issued by the Joint Typhoon Warning Center or JTWC on March 18 at 0900 UTC (5 a.m. EDT). At that time, Tropical depression 03W, also known in the Philippines as Chedeng, was located near 6.6 degrees north latitude and 128.5 degrees east longitude. That’s about 170 nautical miles east of Davao, Philippines. Maximum sustained winds were down to 20 knots (23 mph/37 kph) in the remnant low pressure area.

The remnant low pressure area was moving to the west and are expected to move toward Mindanao, Philippines.

By Rob Gutro
NASA’s Goddard Space Flight Center