Sep. 15, 2020 – A NASA-NOAA Nighttime View Finds a Slightly Better Organized Tropical Storm Karina
NASA-NOAA’s Suomi NPP satellite provided an infrared look at Tropical Storm Karina in the Eastern Pacific Ocean that gave forecasters a nighttime view of the storm. It revealed a slightly more organized tropical storm.
NASA-NOAA’s Suomi NPP satellite passed over the Eastern Pacific Ocean on Sept. 15 at 6:50 a.m. EDT (3:50 a.m. PDT/1050 UTC) and captured an early morning image of Tropical Storm Karina. Credit: NASA Worldview, Earth Observing System Data and Information System (EOSDIS)
NASA’s Night-Time View
On Sept. 15 at 6:50 a.m. EDT (3:50 a.m. PDT/1050 UTC), the Visible Infrared Imaging Radiometer Suite (VIIRS) instrument aboard Suomi NPP passed over the Eastern Pacific Ocean and captured an early morning image of Tropical Storm Karina. The image showed that Karina continued to become a little better organized with a concentrated area of deep convection near and over the estimated low-level center. The image was created using the NASA Worldview application at NASA’s Goddard Space Flight Center in Greenbelt, Md.
By 11 a.m. EDT (8 a.m. PDT) on Sept. 15, Andrew Latto, Hurricane Specialist at NOAA’s National Hurricane Center in Miami, Fla. noted in the storm’s Discussion, “Karina has changed little in organization over the past several hours. [It has] a concentrated area of deep convection mostly over the southwestern portion of the circulation and over the estimated position of the low-level center.”
Karina’s Status on Sept. 15
At 11 a.m. EDT (1500 UTC), the center of Tropical Storm Karina was located near latitude 20.4 degrees north and longitude 121.1 degrees west. That is about 740 miles (1,190 km) west of the southern tip of Baja California, Mexico.
Karina was moving toward the northwest near 10 mph (17 kph), and this motion is expected to continue for the next couple of days. A turn to the west and then toward the west-southwest is expected late this week. Maximum sustained winds were near 60 mph (95 kph) with higher gusts. Some weakening is forecast during the next 48 hours. The estimated minimum central pressure was 996 millibars.
Karina’s Forecast
“The cyclone is forecast to move over progressively cooler waters and into a drier, more stable atmosphere over the next couple of days. These conditions should induce a weakening trend soon, and the deep convection is expected to gradually wane during that time,” Latto said in the Discussion.
Gradual weakening should begin by tonight, and Karina is forecast to become a remnant low in two or three days.
About NASA’s EOSDIS Worldview
NASA’s Earth Observing System Data and Information System (EOSDIS) Worldview application provides the capability to interactively browse over 700 global, full-resolution satellite imagery layers and then download the underlying data. Many of the available imagery layers are updated within three hours of observation, essentially showing the entire Earth as it looks “right now.”
NASA Researches Earth from Space
For more than five decades, NASA has used the vantage point of space to understand and explore our home planet, improve lives and safeguard our future. NASA brings together technology, science, and unique global Earth observations to provide societal benefits and strengthen our nation. Advancing knowledge of our home planet contributes directly to America’s leadership in space and scientific exploration.
Sep. 15, 2020 – Water Vapor Imagery Reveals Hurricane Paulette’s Strongest Side, Dry Air
NASA’s Aqua satellite analyzed Hurricane Paulette’s water vapor content as it continued to move away from Bermuda and found structural changes, the strongest side, and dry air moving in.
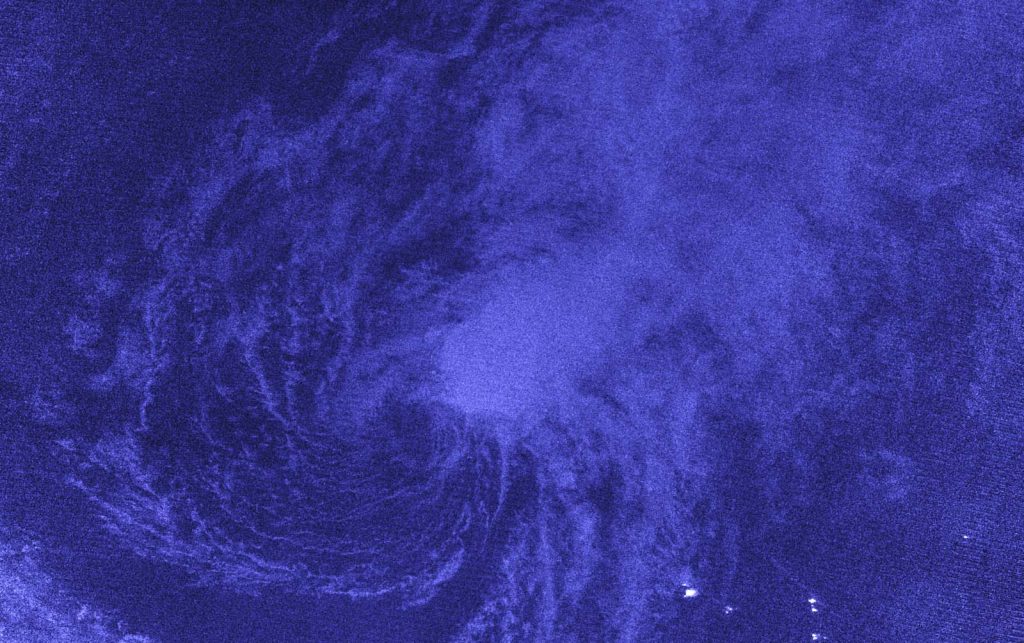
On Sept. 15 at 3:25 a.m. EDT (0725 UTC), the MODIS instrument aboard NASA’s Aqua satellite gathered water vapor information about Hurricane Paulette. Highest concentrations of water vapor (dark brown) and coldest cloud top temperatures were around the center and northeast of the center. Credits: NASA/NRL
Water Vapor Imagery’s Indications
Water vapor analysis of tropical cyclones tells forecasters how much potential a storm has to develop. Water vapor releases latent heat as it condenses into liquid. That liquid becomes clouds and thunderstorms that make up a tropical cyclone. Temperature is important when trying to understand how strong storms can be. The higher the cloud tops, the colder and stronger they are.
The Moderate Resolution Imaging Spectroradiometer or MODIS instrument aboard NASA’s Aqua satellite gathered water vapor content and temperature information on Paulette on Sept. 15 at 3:25 a.m. EDT (0725 UTC). The MODIS data showed highest concentrations of water vapor and coldest cloud top temperatures were north of the center of circulation. That area had coldest cloud top temperatures that were as cold as or colder than minus 70 degrees Fahrenheit (minus 56.6 degrees Celsius) in those storms. Storms with cloud top temperatures that cold have the capability to produce heavy rainfall.
The Advanced Microwave Scanning Radiometer 2 (AMSR2) onboard the GCOM-W1 satellite is a remote sensing instrument for measuring weak microwave emission from the surface and the atmosphere of the Earth. U.S. Navy Hurricane Specialist Dave Roberts at NOAA’s National Hurricane Center in Miami, Fla. noted, “At 1:53 a.m. EDT (0533 UTC) the AMSR2 overpass on Paulette already reveals structural changes associated with the approaching mid-latitude baroclinic zone. The microwave image and GOES-16 satellite’s mid- to upper-level water vapor imagery show drier more stable air beginning to intrude into the western portion of the cyclone. Additionally, Paulette’s rain shield is more confined to the northern half of the system, while drying out in the southern semi-circle. Only fragments of the eyewall remain in that particular area.”
Paulette’s Status on Sept. 15
At 11 a.m. EDT (1500 UTC), the center of Hurricane Paulette was located near latitude 38.3 degrees north and longitude 57.9 degrees west. That is about 570 miles (915 km) northeast of Bermuda. Paulette is moving toward the northeast near 29 mph (46 kph). Maximum sustained winds are near 105 mph (165 kph) with higher gusts. The estimated minimum central pressure is 965 millibars.
Paulette’s Forecast
The NHC said, “Some strengthening is possible through tonight, but rapid weakening is forecast to begin on Wednesday as the cyclone undergoes extratropical transition. Paulette should complete its transition to an extratropical cyclone on Thursday. A faster motion toward the east-northeast is expected through Thursday. Afterward, Paulette is forecast to slow down and turn toward the east-southeast and south-southeast late Thursday and Friday.”
NASA Researches Tropical Cyclones
Hurricanes/tropical cyclones are the most powerful weather events on Earth. NASA’s expertise in space and scientific exploration contributes to essential services provided to the American people by other federal agencies, such as hurricane weather forecasting.
NASA’s Aqua satellite is one in a fleet of NASA satellites that provide data for hurricane research.
For more than five decades, NASA has used the vantage point of space to understand and explore our home planet, improve lives and safeguard our future. NASA brings together technology, science, and unique global Earth observations to provide societal benefits and strengthen our nation. Advancing knowledge of our home planet contributes directly to America’s leadership in space and scientific exploration.
Sep. 15, 2020 – NASA Satellite Imagery Shows Teddy Consolidating
When a tropical cyclone consolidates, it means that it is getting more organized and its circulation is improving. An improved circulation helps make for a stronger storm. Infrared imagery from NASA’s Aqua satellite showed that Teddy was consolidating in the Central North Atlantic Ocean.
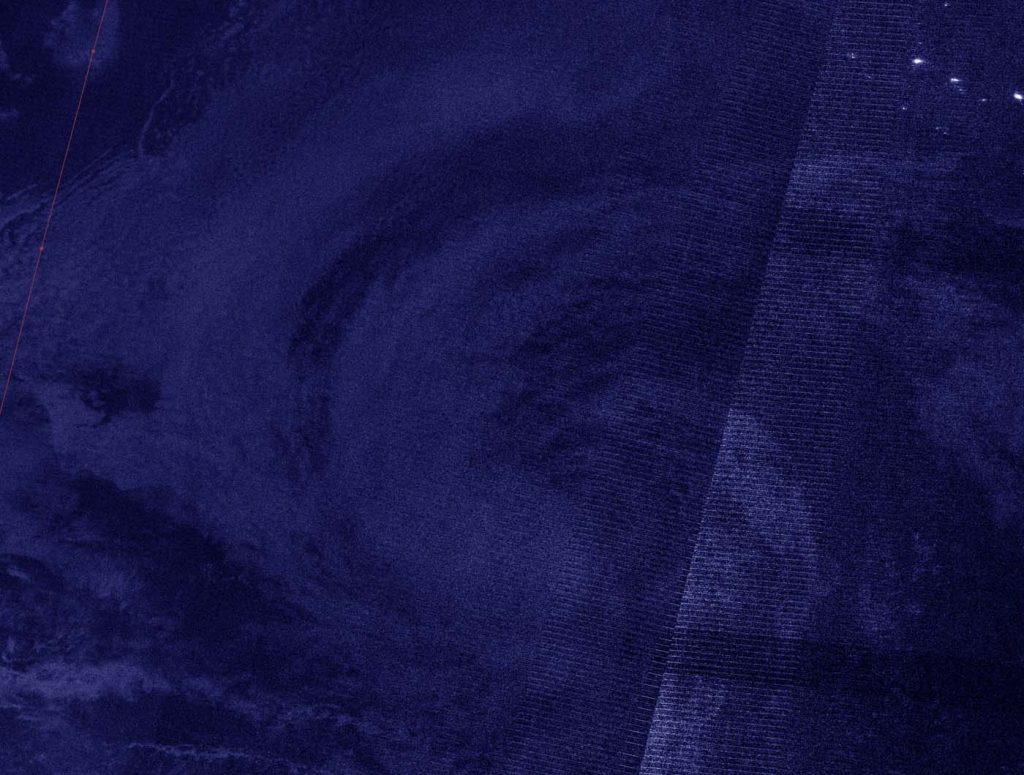
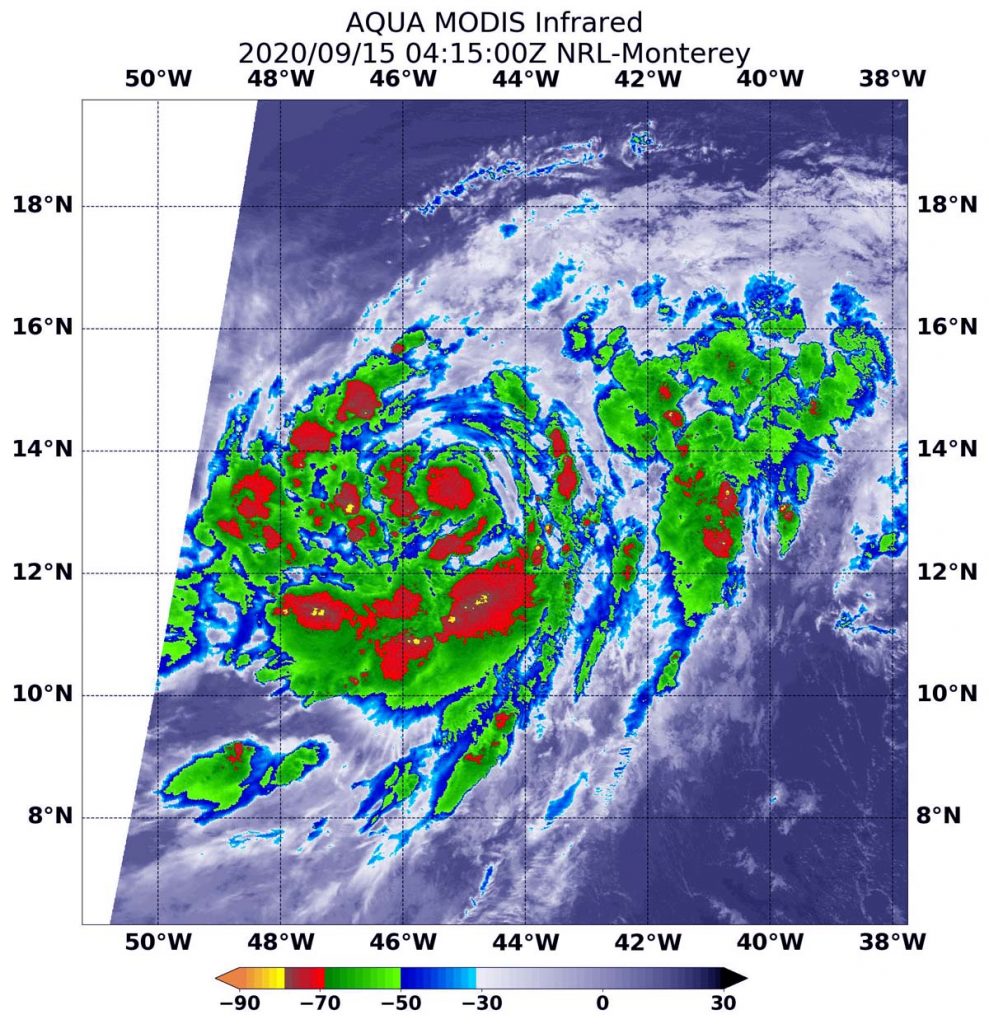
On Sept. 15 at 12:15 a.m. EDT (0415 UTC), the Moderate Resolution Imaging Spectroradiometer or MODIS instrument aboard NASA’s Aqua satellite gathered temperature information about Teddy’s cloud tops. Some cloud top temperatures were as cold as or colder than minus 70 degrees (red) Fahrenheit (minus 56.6 Celsius) and building thunderstorms around the storm’s core. Credit: NASA/NRL
Infrared Data Reveals Teddy is organizing
On Sept. 15 at 12:15 a.m. EDT (0415 UTC), the Moderate Resolution Imaging Spectroradiometer or MODIS instrument aboard NASA’s Aqua satellite gathered temperature information about Teddy’s cloud tops. Infrared data provides temperature information, and the strongest thunderstorms that reach high into the atmosphere have the coldest cloud top temperatures.
MODIS found some cloud top temperatures were as cold as or colder than minus 70 degrees Fahrenheit (minus 56.6 Celsius). Cloud top temperatures that cold indicate strong storms with the potential to generate heavy rainfall. The infrared data showed that Teddy’s structure is slowly improving. The infrared imagery and visible imagery revealed that the building of thunderstorms around the storm’s core has increased, despite the continued presence of dry slots.
Teddy’s Status on Sept. 15
At 11 a.m. EDT (1500 UTC), the center of Tropical Storm Teddy was located near latitude 14.0 degrees north and longitude 47.0 degrees west. Teddy is located about 960 miles (1,545 km) east of the Lesser Antilles. Teddy is moving toward the west-northwest near 13 mph (20 kph). A steady northwest motion at 10 to 15 mph is expected through the end of the week.
Maximum sustained winds have increased to near 65 mph (100 kph) with higher gusts. Additional strengthening is forecast for the next several days. Teddy will likely become a hurricane later today or tonight and could reach major hurricane strength in a few days. The estimated minimum central pressure is 999 millibars.
Teddy’s Forecast
“Teddy’s low [wind] shear and warm sea surface temperature environment should be conducive for further strengthening, and the NHC intensity forecast is largely unchanged,” noted David Zelinsky, Hurricane Model Diagnostician and Meteorologist at the NHC. “Some dry air in the environment could restrict Teddy’s intensification rate, but is not expected to prevent Teddy from becoming a hurricane later today or tonight. Continued strengthening is expected thereafter and Teddy is forecast to become a major hurricane within the next few days.”
NASA Researches Tropical Cyclones
Hurricanes/tropical cyclones are the most powerful weather events on Earth. NASA’s expertise in space and scientific exploration contributes to essential services provided to the American people by other federal agencies, such as hurricane weather forecasting.
NASA’s Aqua satellite is one in a fleet of NASA satellites that provide data for hurricane research.
For more than five decades, NASA has used the vantage point of space to understand and explore our home planet, improve lives and safeguard our future. NASA brings together technology, science, and unique global Earth observations to provide societal benefits and strengthen our nation. Advancing knowledge of our home planet contributes directly to America’s leadership in space and scientific exploration.
Sep. 15, 2020 – NASA Aqua Satellite Casts Three Eyes on Sally and Finds Heavy Rain Potential
NASA’s Aqua satellite analyzed the cloud top temperatures and water vapor content in Hurricane Sally as it crawls toward landfall, and found the potential for large amounts of rainfall, which, coupled with slow movement, can lead to catastrophic flooding. Two instruments provided three views of Sally’s temperatures and water vapor that revealed the soaking capability of the slow-moving hurricane.
At 8 a.m. EDT on Sept. 15, NOAA’s National Hurricane Center (NHC) cautioned, “Historic flooding is possible from Sally with extreme life-threatening flash flooding likely through Wednesday [Sept. 16] along portions of the northern Gulf Coast.” Forecasters are using NASA’s infrared and water vapor data to analyze the rainfall potential from Sally.
Warnings and Watches in Effect on Sept. 15
NHC issued a Storm Surge Warning for the mouth of the Mississippi River to the Okaloosa/Walton County Line, Florida and for Mobile Bay. A Hurricane Warning is in effect for east of the Mouth of the Pearl River to Navarre, Florida. A Tropical Storm Warning is in effect for east of Navarre, Florida to Indian Pass, Florida and from the mouth of the Pearl River westward to Grand Isle, Louisiana, including Lake Pontchartrain and Lake Maurepas and metropolitan New Orleans.
On Sept. 15 at 3:25 a.m. EDT (0725 UTC), the MODIS instrument that flies aboard NASA’s Aqua satellite revealed the most powerful thunderstorms (yellow) were around Hurricane Sally’s center and in the northeastern quadrant. There, cloud top temperatures were as cold as or colder than minus 80 degrees Fahrenheit (minus 62.2 Celsius.) They were located over the Gulf of Mexico and just offshore from coastal Alabama, Mississippi and the Florida Panhandle. Strong storms (red) with cloud top temperatures as cold as minus 70 degrees Fahrenheit (minus 56.6. degrees Celsius) surrounded both areas and were generating large amounts of rain. Credit: NASA/NRL
NASA’s Infrared Data Reveals Heavy Rainmakers
Tropical cyclones consist of hundreds of thunderstorms, and infrared data can show where the strongest storms are located. That is because infrared data provides temperature information, and the strongest thunderstorms that reach highest into the atmosphere have the coldest cloud top temperatures. Two instruments aboard NASA’s Aqua satellite provided infrared data on Sally’s cloud tops.
On Sept. 15 at 3:25 a.m. EDT (0725 UTC), the Moderate Resolution Imaging Spectroradiometer or MODIS instrument that flies aboard NASA’s Aqua satellite revealed the most powerful thunderstorms were around Hurricane Sally’s center and in the northeastern quadrant. In those areas, cloud top temperatures were as cold as or colder than minus 80 degrees Fahrenheit (minus 62.2 Celsius). They were located over the Gulf of Mexico and just offshore from coastal Alabama, Mississippi and the Florida Panhandle. Strong storms with cloud top temperatures as cold as minus 70 degrees Fahrenheit (minus 56.6. degrees Celsius) surrounded both areas and were generating large amounts of rain.
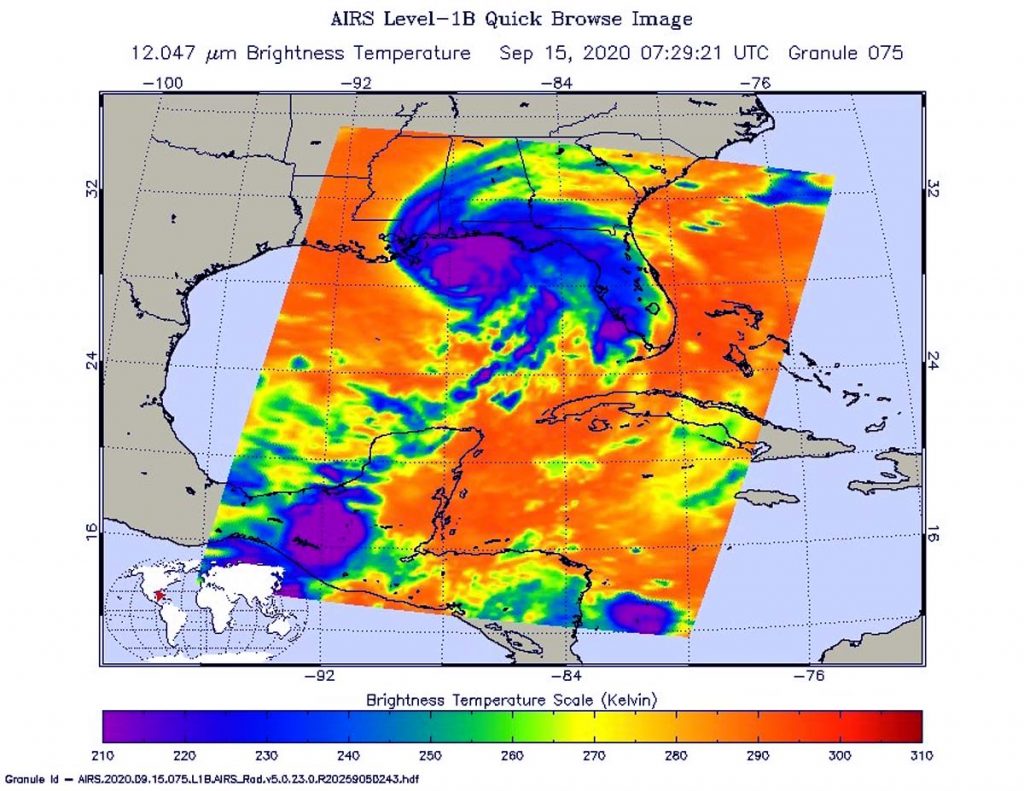
On Sept. 15 at 3:29 a.m. EDT (0729 UTC) NASA’s Aqua satellite analyzed Sally’s cloud top temperatures using the AIRS instrument. AIRS showed the strongest storms were offshore in the northern Gulf of Mexico where they were as cold as or colder than 210 Kelvin (purple) minus 81 degrees Fahrenheit (minus 63.1 degrees Celsius). Credit: NASA JPL/Heidar Thrastarson
Four minutes later, another instrument aboard NASA’s Aqua satellite analyzed Sally’s cloud top temperatures to verify the data from MODIS. The Atmospheric Infrared Sounder or AIRS instrument or AIRS instrument showed the strongest storms were offshore in the northern Gulf of Mexico where they were as cold as or colder than 210 Kelvin (minus 81 degrees Fahrenheit (minus 63.1 degrees Celsius). NASA research has shown that cloud top temperatures that cold indicate strong storms that have the capability to create heavy rain.
On Sept. 15 at 3:25 a.m. EDT (0725 UTC) Aqua’s MODIS instrument also gathered water vapor content and temperature information on Sally. The MODIS image showed highest concentrations of water vapor (dark brown) and coldest cloud top temperatures were around the center of circulation and in the northeastern quadrant of the storm. The water vapor data showed coldest cloud top temperatures were as cold as or colder than minus 70 degrees Fahrenheit (minus 56.6 degrees Celsius) in those storms. Credits: NASA/NRL
Water Vapor Content
Water vapor analysis of tropical cyclones tells forecasters how much potential a storm has to develop. Water vapor releases latent heat as it condenses into liquid. That liquid becomes clouds and thunderstorms that make up a tropical cyclone. Temperature is important when trying to understand how strong storms can be. The higher the cloud tops, the colder and stronger the storms.
On Sept. 15 at 3:25 a.m. EDT (0725 UTC) Aqua’s MODIS instrument also gathered water vapor content and temperature information on Sally. The MODIS image showed the highest concentrations of water vapor and coldest cloud top temperatures were around the center of circulation and in the northeastern quadrant of the storm. The water vapor data showed the coldest cloud top temperatures were as cold as or colder than minus 70 degrees Fahrenheit (minus 56.6 degrees Celsius) in those storms. Storms with cloud top temperatures that cold have the capability to produce heavy rainfall.
Sally’s Rainfall Forecast from NHC
The NHC warns, “Sally is expected to be a slow moving system as it approaches land producing 10 to 20 inches of rainfall with isolated amounts of 30 inches along and just inland of the central Gulf Coast from the western Florida Panhandle to far southeastern Mississippi. Historic flooding is possible with extreme life-threatening flash flooding likely through Wednesday. In addition, this rainfall will lead to widespread moderate to major flooding on area rivers.
Sally is forecast to move inland early Wednesday and move across the Southeast producing rainfall of 4 to 8 inches, with isolated maximum amounts of 12 inches, across portions of southeastern Mississippi, southern and central Alabama, northern Georgia, and the western Carolinas. Significant flash and urban flooding is likely, as well as widespread minor to moderate flooding on some rivers.”
Sally’s Status on Sept. 15
At 8 a.m. EDT (1200 UTC) on Sept. 15, the National Hurricane Center noted the center of Hurricane Sally was located near latitude 29.1 degrees north and longitude 88.0 degrees west. That is about 65 miles (110 km) east of the mouth of the Mississippi River.
Sally is moving toward the northwest near 2 mph (4 kph), and this general motion is expected to continue this morning. A northward turn is expected this afternoon, followed by a slow north-northeastward to northeastward motion tonight and continuing through Wednesday night. Maximum sustained winds are near 85 mph (140 kph) with higher gusts. The estimated minimum central pressure based on data from the Air Force Hurricane Hunter aircraft is 982 millibars.
Sally’s Forecast Track
NHC said, “Although little change in strength is forecast until landfall occurs, Sally is still expected to be a dangerous hurricane when it moves onshore along the north-central Gulf coast. On the forecast track, the center of Sally will pass near the coast of southeastern Louisiana today, and make landfall in the hurricane warning area tonight or Wednesday morning.”
NASA Researches Tropical Cyclones
Hurricanes are the most powerful weather event on Earth. NASA’s expertise in space and scientific exploration contributes to essential services provided to the American people by other federal agencies, such as hurricane weather forecasting.
NASA’s Aqua satellite is one in a fleet of NASA satellites that provide data for hurricane research.
For more than five decades, NASA has used the vantage point of space to understand and explore our home planet, improve lives and safeguard our future. NASA brings together technology, science, and unique global Earth observations to provide societal benefits and strengthen our nation. Advancing knowledge of our home planet contributes directly to America’s leadership in space and scientific exploration.
Infrared imagery is like having night vision, and NASA-NOAA’s Suomi NPP satellite provided a nighttime view of Tropical Storm Vicky that revealed outside winds are weakening the storm.
NASA-NOAA’s Suomi NPP satellite passed the eastern north Atlantic Ocean overnight on Sept. 15 at 0335 UTC (Sept. 14 at 11:35 p.m. EDT) and captured a night-time image of Tropical Storm Vicky that revealed wind shear was pushing the bulk of its clouds to the northeastern quadrant of the storm. Credit: NASA Worldview, Earth Observing System Data and Information System (EOSDIS)
About Wind Shear
The shape of a tropical cyclone provides forecasters with an idea of its organization and strength. When outside winds batter a storm, it can change the storm’s shape. Winds can push most of the associated clouds and rain to one side of a storm. Outside winds from the southwest are pushing against Tropical Storm Vicky.
In general, wind shear is a measure of how the speed and direction of winds change with altitude. Tropical cyclones are like rotating cylinders of winds. Each level needs to be stacked on top each other vertically in order for the storm to maintain strength or intensify. Wind shear occurs when winds at different levels of the atmosphere push against the rotating cylinder of winds, weakening the rotation by pushing it apart at different levels.
NASA’s Night-Time View of Vicky’s Wind Shear
The Visible Infrared Imaging Radiometer Suite (VIIRS) instrument aboard Suomi NPP provided a nighttime image of Vicky on Sept. 15 at 0335 UTC (Sept. 14 at 11:35 p.m. EDT) using infrared imagery. That imagery revealed strong southwesterly wind shear was pushing the bulk of its clouds to the northeastern quadrant of the storm.
In the NHC Discussion at 5 a.m. EDT on Sept. 15, Eric Blake, senior hurricane specialist at NOAA’s National Hurricane Center in Miami, Fla. noted, “Vicky remains sheared this morning with strong upper-level winds causing any deep convection to be located northeast of the center. The low-level circulation has also become distorted as well, with new bursts of convection causing the mean circulation to re-form to the north.”
The image was created using the NASA Worldview application at NASA’s Goddard Space Flight Center in Greenbelt, Md.
Vicky’s Status on Sept. 15
NOAA’s National Hurricane Center (NHC) noted at 5 a.m. EDT (0900 UTC), the center of Tropical Storm Vicky was located near latitude 20.3 degrees north and longitude 30.1 degrees west. Vicky is 500 miles (800 km) northwest of the Cabo Verde Islands. Vicky is moving toward the northwest near 9 mph (15 kph), and a turn toward the west-northwest is expected within the next day or so, followed by a turn toward the west. Maximum sustained winds are near 50 mph (85 kph) with higher gusts. The estimated minimum central pressure is 1004 millibars.
Vicky’s Fading Forecast
Weakening is forecast due to strong upper-level winds during the next 48 hours, and Vicky is likely to degenerate into remnant low by Wednesday, Sept. 16.
About NASA’s EOSDIS Worldview
NASA’s Earth Observing System Data and Information System (EOSDIS) Worldview application provides the capability to interactively browse over 700 global, full-resolution satellite imagery layers and then download the underlying data. Many of the available imagery layers are updated within three hours of observation, essentially showing the entire Earth as it looks “right now.”
NASA Researches Earth from Space
For more than five decades, NASA has used the vantage point of space to understand and explore our home planet, improve lives and safeguard our future. NASA brings together technology, science, and unique global Earth observations to provide societal benefits and strengthen our nation. Advancing knowledge of our home planet contributes directly to America’s leadership in space and scientific exploration.
Sep. 15, 2020 – NASA Sees Tropical Depression Rene Dissipating
NASA’s Aqua satellite captured a visible image of Tropical Depression Rene as it was dissipating in the central North Atlantic Ocean.
On Sept. 15 at 12:30 p.m. EDT. NASA’s Aqua satellite provided a visible image of Tropical Depression Rene dissipating in the north central Atlantic Ocean. Image Courtesy: NASA Worldview, Earth Observing System Data and Information System (EOSDIS).
The Moderate Resolution Imaging Spectroradiometer or MODIS instrument that flies aboard NASA’s Aqua satellite captured a visible image of Rene on Sept. 15 at 12:30 p.m. EDT. Rene appeared elongated from wind shear (outside winds blowing at different levels of the atmosphere) battering the storm. Over the next couple of hours, visible satellite imagery showed that Rene opened into a trough (elongated area) of low pressure and was no longer a tropical cyclone. Several hours later, Rene dissipated into a remnant low-pressure area.
Satellite imagery was created using NASA’s Worldview product at NASA’s Goddard Space Flight Center in Greenbelt, Md.
Rene‘s Curtain Call
At 5 p.m. EDT (2100 UTC) on Sept. 15, NOAA’s National Hurricane Center (NHC) issued the final advisory on Rene, citing that the storm had dissipated. The remnants of Rene were located near latitude 26.9 degrees north and longitude 49.3 degrees west. Rene was located about 1,045 miles (1,685 km) northeast of the Leeward Islands. The remnants were moving toward the west-southwest near 7 mph (11 kph) and this general motion will likely continue for another day or two. Maximum sustained winds were near 30 mph (45 kph) with higher gusts.
The remnants of Rene are expected to move generally southwestward for the next day or two while the associated winds slowly subside.
About NASA’s Worldview and Aqua Satellite
NASA’s Earth Observing System Data and Information System (EOSDIS) Worldview application provides the capability to interactively browse over 700 global, full-resolution satellite imagery layers and then download the underlying data. Many of the available imagery layers are updated within three hours of observation, essentially showing the entire Earth as it looks “right now.”
NASA’s Aqua satellite is one in a fleet of NASA satellites that provide data for hurricane research.
Tropical cyclones/hurricanes are the most powerful weather events on Earth. NASA’s expertise in space and scientific exploration contributes to essential services provided to the American people by other federal agencies, such as hurricane weather forecasting.
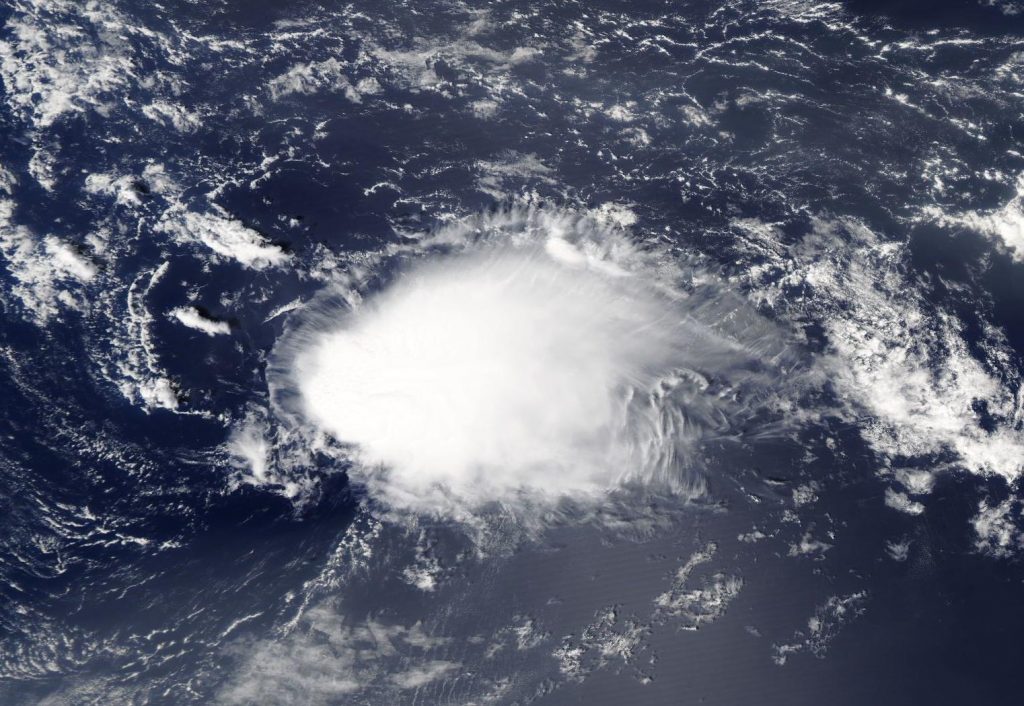
Sep. 14, 2020 – NASA Satellite Imagery Catches Sally’s Development into a Hurricane
Tropical Storm Sally was deemed a hurricane on Sept. 14 just after NASA’s Aqua satellite provided data on the storm.
Infrared Imagery on Sally
On Sunday, Sept. 13, NASA analyzed Sally’s cloud top temperatures to gauge if the storm was strengthening. Cloud top temperatures provide information to forecasters about where the strongest storms are located within a tropical cyclone. The stronger the storms, the higher they extend into the troposphere, and the colder the cloud temperatures.
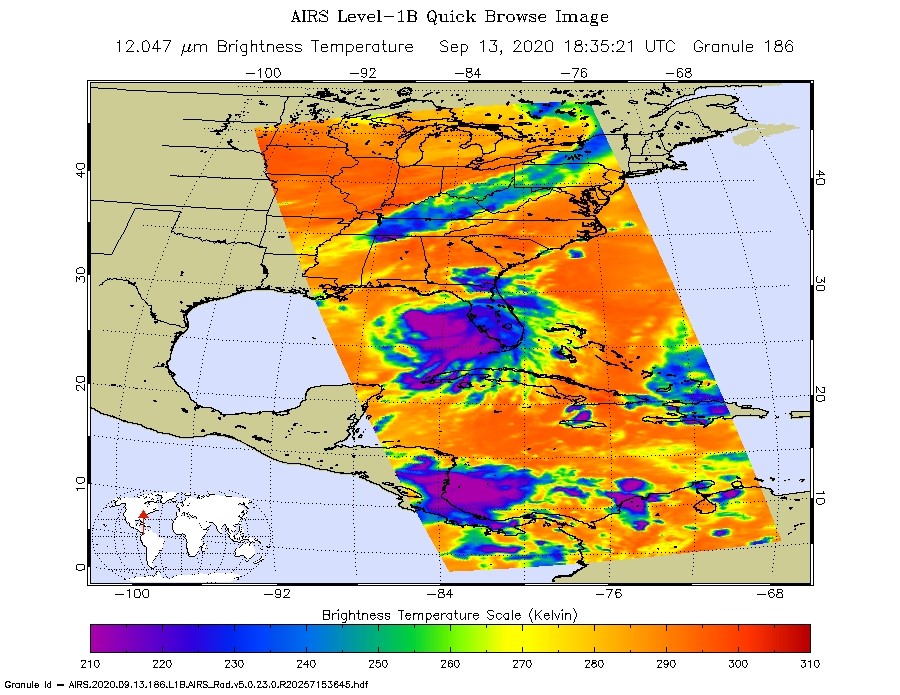
On Sept. 13 at 2:35 p.m. EDT (1835 UTC) NASA’s Aqua satellite analyzed a low-pressure area in the eastern Atlantic Ocean using the Atmospheric Infrared Sounder or AIRS instrument. AIRS found coldest cloud top temperatures as cold as or colder than (purple) minus 63 degrees Fahrenheit (minus 53 degrees Celsius) around the center and east of the center. Credit: NASA JPL/Heidar Thrastarson
On Sept. 13 at 2:35 p.m. EDT (1835 UTC) NASA’s Aqua satellite analyzed Tropical Storm Sally using the Atmospheric Infrared Sounder or AIRS instrument. AIRS found coldest cloud top temperatures as cold as or colder than minus 63 degrees Fahrenheit (minus 53 degrees Celsius) around the center and east of the center. NASA research has shown that cloud top temperatures that cold indicate strong storms that have the capability to create heavy rain.
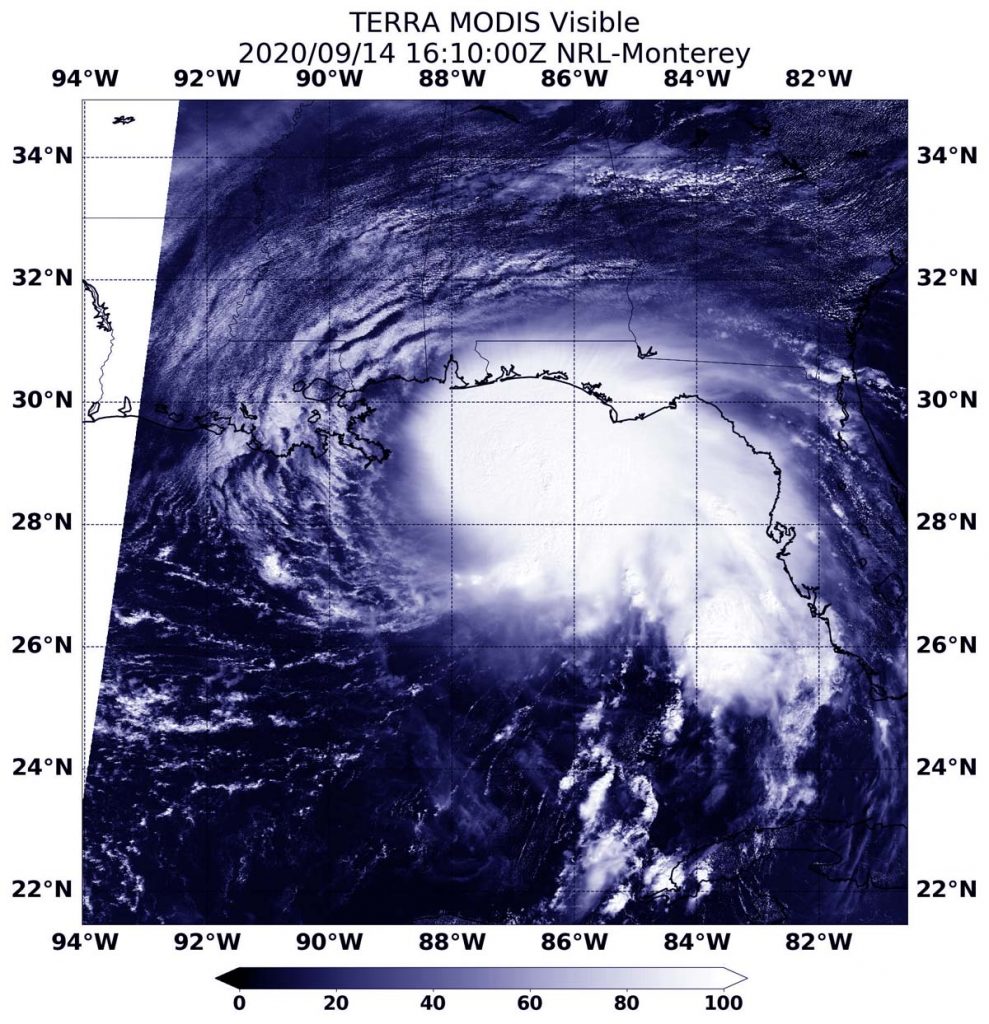
Visible Imagery Helps Confirm Hurricane Status
On Sept. 14 at 12:10 p.m. EDT (1610 UTC), the Moderate Resolution Imaging Spectroradiometer (MODIS) instrument aboard NASA’s Terra satellite provided a visible look at Hurricane Sally just as it reached hurricane status in the northern Gulf of Mexico. In the Terra image, the strongest storms appear to be around the center of circulation and the northern and eastern quadrants of the storm, which are skirting Florida’s west coast.
NASA’s Terra satellite provided a visible look at Hurricane Sally on Sept. 14 at 12:10 p.m. EDT just as it reached hurricane status in the northern Gulf of Mexico. Credit: NASA/NRL
At 12:30 p.m. EDT, Daniel Brown, senior hurricane specialist and warning coordination meteorologist at NOAA’s National Hurricane Center in Miami, Fla. noted, “A NOAA Hurricane Hunter aircraft investigating Sally recently measured peak flight-level winds of 88 knot at 700 millibars and SFMR [Stepped Frequency Microwave Radiometer] winds of 78 knot north of the center, and an Air Force reconnaissance aircraft just measured 79 knot flight-level winds at 700 millibars. These data indicate that Sally has rapidly strengthened into a hurricane with an intensity of around 80 knots. In addition, data from the KEVX WSR-88D [the radar at Eglin Air Force Base, Fla.] show an eye forming at around 16,000 foot altitude. This special advisory has been issued to increase the initial and forecast intensity.”
The Stepped Frequency Microwave Radiometer (SFMR) is the primary instrument used by the National Hurricane Center to determine hurricane intensity.
Watches and Warnings in Effect on Sept. 14
A Storm Surge Warning is in effect for Port Fourchon, Louisiana to the Alabama/Florida Border, Lake Pontchartrain, Lake Maurepas, and Lake Borgne and for Mobile Bay. A Hurricane Warning is in effect for Morgan City Louisiana to the Alabama/Florida Border, and for Lake Pontchartrain and Lake Maurepas including metropolitan New Orleans. A Tropical Storm Warning is in effect for the Alabama/Florida Border to Indian Pass, Florida and for Intracoastal City, Louisiana to west of Morgan City.
A Tropical Storm Watch is in effect for Indian Pass to Ochlockonee River, Florida.
Sally’s Status of Sept. 14
At 12:30 p.m. EDT (1630 UTC), the center of Hurricane Sally was located near latitude 28.7 degrees north and longitude 87.0 degrees west. That is 130 miles (210 km) east-southeast of the mouth of the Mississippi River. Sally is moving toward the west-northwest near 7 mph (11 kph). This general motion is expected to continue today, followed by a decrease in forward speed and a turn toward the northwest tonight and a northward turn sometime on Tuesday.
Data from NOAA and Air Force Reserve Hurricane Hunter aircraft indicate that Sally has rapidly strengthened. The maximum sustained winds are near 90 mph (150 kph) with higher gusts. Additional strengthening is forecast during the next day or so. The latest minimum central pressure estimated from reconnaissance aircraft data is 986 millibars.
Sally’s Forecast
On the forecast track, the center of Sally will move over the north-central Gulf of Mexico today, approach southeastern Louisiana tonight, and make landfall in the hurricane warning area on Tuesday or Tuesday night. Afterward, Sally is expected to move slowly north-northeastward near the northern Gulf Coast through Wednesday.
The AIRS instrument is one of six instruments flying on board NASA’s Aqua satellite, launched on May 4, 2002.
NASA Researches Tropical Cyclones
Hurricanes/tropical cyclones are the most powerful weather events on Earth. NASA’s expertise in space and scientific exploration contributes to essential services provided to the American people by other federal agencies, such as hurricane weather forecasting.
For more than five decades, NASA has used the vantage point of space to understand and explore our home planet, improve lives and safeguard our future. NASA brings together technology, science, and unique global Earth observations to provide societal benefits and strengthen our nation. Advancing knowledge of our home planet contributes directly to America’s leadership in space and scientific exploration.
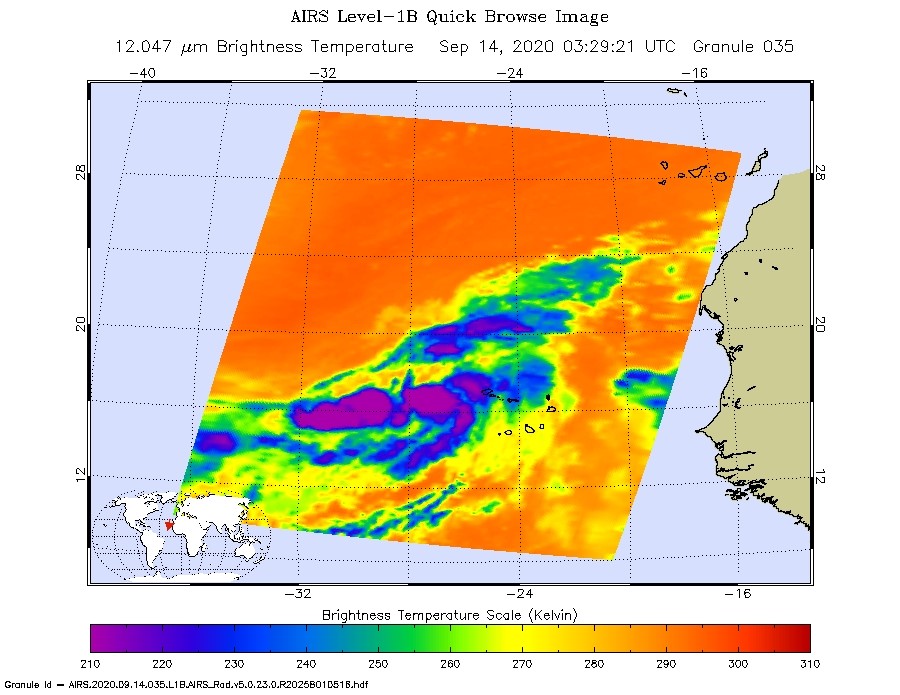
Sep. 14, 2020 – NASA Catches Development of Eastern Atlantic’s Tropical Storm Vicky
NASA’s Aqua satellite analyzed a low-pressure area in the far eastern Atlantic Ocean, and it showed the system becoming more organized. Soon after Aqua passed overhead, the low became Tropical Depression 21. Hours later, the storm strengthened into Tropical Storm Vicky.
On Sept. 14 at 0329 UTC (Sept. 13 at 11:29 a.m. EDT) NASA’s Aqua satellite analyzed a low-pressure area in the eastern Atlantic Ocean using the Atmospheric Infrared Sounder or AIRS instrument. AIRS found coldest cloud top temperatures as cold as or colder than (purple) minus 63 degrees Fahrenheit (minus 53 degrees Celsius) around the center of circulation, as the storm was forming into Tropical Depression 21. Credit: NASA JPL/Heidar Thrastarson
Infrared Imagery Revealed a Consolidating System
One of the ways NASA researches tropical cyclones is using infrared data that provides temperature information. The AIRS instrument aboard NASA’s Aqua satellite captured a look at those temperatures in the developing low-pressure area and gave insight into the size of the storm and its rainfall potential.
Cloud top temperatures provide information to forecasters about where the strongest storms are located within a tropical cyclone. Tropical cyclones do not always have uniform strength, and some sides are stronger than others. The stronger the storms, the higher they extend into the troposphere, and the colder the cloud temperatures. NASA provides that data to forecasters at NOAA’s National Hurricane Center or NHC so they can incorporate in their forecasting.
On Sept. 14 at 0329 UTC (Sept. 13 at 11:29 a.m. EDT) NASA’s Aqua satellite analyzed the low-pressure area using the Atmospheric Infrared Sounder or AIRS instrument. AIRS found coldest cloud top temperatures as cold as or colder than minus 63 degrees Fahrenheit (minus 53 degrees Celsius) around the center of circulation. NASA research has shown that cloud top temperatures that cold indicate strong storms that have the capability to create heavy rain.
Forecasters looked at wind speeds in the storm to determine that it had strengthened into a tropical storm. The Advanced Scatterometer (ASCAT) winds products are processed by NOAA/NESDIS utilizing measurements from the scatterometer instrument aboard the European Organisation for the Exploitation of Meteorological Satellites (EUMETSAT) Metop satellites.
U.S. Navy Hurricane Specialist Dave Roberts at NOAA’s National Hurricane Center in Miami, Fla. noted, “A METOP A/B ASCAT scatterometer pass over the cyclone showed a large swath of winds in the northeast quadrant on the order of 35 to 39 knots. Deep convection in that region of the cyclone continues to increase as well as near the center of circulation. Accordingly, the initial intensity is raised to 40 knots, making this the twentieth named storm of the season.”
Vicky’s Status of Sept. 14
At 11 a.m. EDT (1500 UTC), Vicky was centered about 350 miles (565 km) west-northwest of the Cabo Verde Islands. The center was near latitude 18.7 degrees north and longitude 28.5 degrees west. Vicky was moving toward the northwest near 6 mph (9 kph) and this motion is forecast to continue into this afternoon. A turn toward the northwest is forecast tonight, with a west-northwestward motion expected on Tuesday and Wednesday.
Maximum sustained winds have increased to near 45 mph (75 kph) with higher gusts. Little change in strength is expected during the next day or so. The estimated minimum central pressure is 1002 millibars.
Vicky’s Forecast
NHC expects Vicky will be a short-lived tropical cyclone as increasing southwesterly wind shear (winds from the outside of the tropical cyclone that batter and weaken them) is expected to quickly weaken Vicky to a depression in a couple days, and the system is expected to degenerate to a remnant low pressure area on Thursday, Sept. 17.
The AIRS instrument is one of six instruments flying on board NASA’s Aqua satellite, launched on May 4, 2002.
NASA Researches Tropical Cyclones
Hurricanes/tropical cyclones are the most powerful weather events on Earth. NASA’s expertise in space and scientific exploration contributes to essential services provided to the American people by other federal agencies, such as hurricane weather forecasting.
For more than five decades, NASA has used the vantage point of space to understand and explore our home planet, improve lives and safeguard our future. NASA brings together technology, science, and unique global Earth observations to provide societal benefits and strengthen our nation. Advancing knowledge of our home planet contributes directly to America’s leadership in space and scientific exploration.
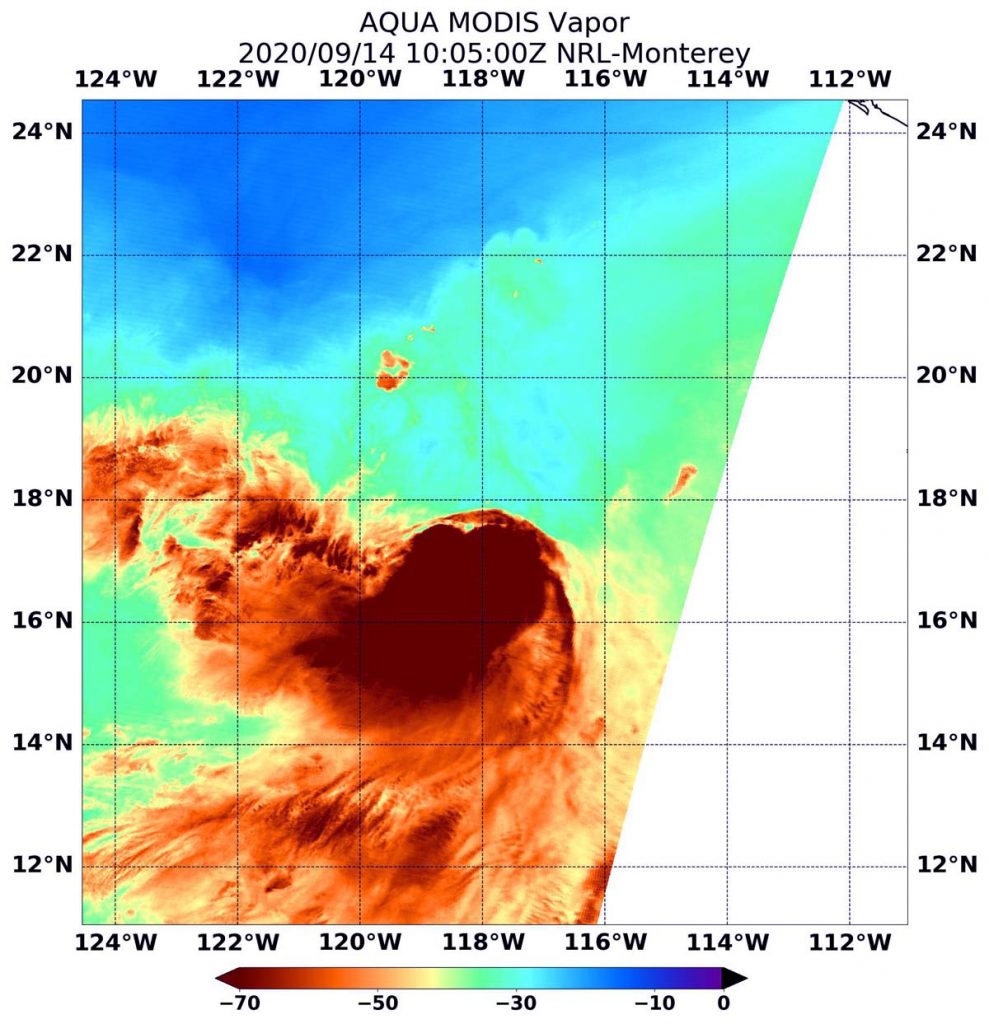
Sep. 14, 2020 – NASA’s Water Vapor Analysis of Tropical Storm Karina Shows Wind Shear Effects
When NASA’s Aqua satellite passed over the Eastern Pacific Ocean, it gathered water vapor data on Tropical Storm Karina. The data showed that the storm was being affected by wind shear from the northeast, pushing the bulk of clouds to the southwest.
On Sept. 14 at 6:05 a.m. EDT (1005 UTC), NASA’s Aqua satellite passed over Tropical Storm Karina in the Eastern Pacific Ocean and found highest concentrations of water vapor (brown) and coldest cloud top temperatures were around the center. Credits: NASA/NRL
Karina formed late on Saturday, Sept. 12 as Tropical Depression 16E (TD16E). TD16E developed about 470 miles (755 km) south-southwest of the southern tip of Baja California, Mexico. Six hours later at 5 a.m. EDT on Sept. 13, the depression organized and strengthened into a tropical storm and was renamed Karina.
A Look at Water Vapor Content
Water vapor analysis of tropical cyclones tells forecasters how much potential a storm has to develop. Water vapor releases latent heat as it condenses into liquid. That liquid becomes clouds and thunderstorms that make up a tropical cyclone. Temperature is important when trying to understand how strong storms can be. The higher the cloud tops, the colder and stronger the storms.
On Sept. 14 at 6:05 a.m. EDT (1005 UTC), NASA’s Aqua satellite passed over Tropical Storm Karina in the Eastern Pacific Ocean. The Moderate Resolution Imaging Spectroradiometer or MODIS instrument gathered water vapor content and temperature information and found highest concentrations of water vapor and coldest cloud top temperatures were southwest of the center. That is because of strong northeasterly wind shear pushing the strong storms away from the center of circulation.
MODIS data showed coldest cloud top temperatures in those storms were as cold as or colder than minus 70 degrees Fahrenheit (minus 56.6 degrees Celsius) in those storms. Storms with cloud top temperatures that cold have the capability to produce heavy rainfall.
“Karina continues to be a sheared cyclone with the deep convection displaced to the southwest of the exposed low-level center,” noted Jack Beven, a senior hurricane specialist at NOAA’s National Hurricane Center in Miami. “Recent scatterometer [instrument that analyzes winds] data showed winds up to 40 knots in the southern semicircle, and thus the initial intensity remains 40 knots.”
Wind Shear Affecting Karina
The shape of a tropical cyclone provides forecasters with an idea of its organization and strength. When outside winds batter a storm, it can change the storm’s shape. Winds can push most of the associated clouds and rain to one side of a storm.
In general, wind shear is a measure of how the speed and direction of winds change with altitude. Tropical cyclones are like rotating cylinders of winds. Each level needs to be stacked on top each other vertically in order for the storm to maintain strength or intensify. Wind shear occurs when winds at different levels of the atmosphere push against the rotating cylinder of winds, weakening the rotation by pushing it apart at different levels.
Karina’s Status on Sept. 14
At 5 a.m. EDT (2 a.m. PDT/0900 UTC), the center of Tropical Storm Karina was located near latitude 17.9 degrees north and longitude 118.2 degrees west. Karina is centered 640 miles (1,025 km) west-southwest of the southern tip of Baja California, Mexico. Karina is moving toward the west near 13 mph (20 kph). Maximum sustained winds are near 45 mph (75 kph) with higher gusts. Tropical-storm-force winds extend outward up to 150 miles (240 km) from the center. The estimated minimum central pressure is 1001 millibars.
Karina’s Forecast
A turn toward the northwest is expected by tonight, Sept. 14, with this motion continuing for the next few days. Some slight strengthening is forecast in the next 24 hours, with gradual weakening expected to begin on Tuesday.
NASA’s Aqua satellite is one in a fleet of NASA satellites that provide data for hurricane research.
NASA Researches Tropical Cyclones
Hurricanes/tropical cyclones are the most powerful weather events on Earth. NASA’s expertise in space and scientific exploration contributes to essential services provided to the American people by other federal agencies, such as hurricane weather forecasting.
For more than five decades, NASA has used the vantage point of space to understand and explore our home planet, improve lives and safeguard our future. NASA brings together technology, science, and unique global Earth observations to provide societal benefits and strengthen our nation. Advancing knowledge of our home planet contributes directly to America’s leadership in space and scientific exploration.
Sep. 14, 2020 – NASA-NOAA Satellite Helps Confirm Teddy Now a Record-Setting Tropical Storm
NASA-NOAA’s Suomi NPP satellite provided an infrared image of Tropical Depression 20 in that helped confirm it organized and strengthened into Tropical Storm Teddy. Teddy, which has broken a hurricane season record, is expected to become a major hurricane later in the week, according to the National Hurricane Center (NHC).
This nighttime image from NASA-NOAA’s Suomi NPP satellite revealed a more organized Tropical Depression 20 helping confirm it had become Tropical Storm Teddy in the Central Atlantic Ocean around midnight on Sept. 14. Credit: NASA Worldview, Earth Observing System Data and Information System (EOSDIS)
Tropical Depression 20 formed late on Saturday, Sept. 12 in the Central North Atlantic Ocean, about 2,030 miles (3,265 km) east of the Northern Leeward Islands. It maintained tropical depression status until this morning, Sept. 14, when infrared satellite data helped confirm it had strengthened and organized. NHC reported this makes Tropical Storm Teddy the earliest 19th named storm, besting the unnamed tropical storm on October 4, 2005.
NASA’s Night-Time View of Elida’s Intensification
The Visible Infrared Imaging Radiometer Suite (VIIRS) instrument aboard Suomi NPP provided a nighttime image of Tropical Depression 20. The nighttime image, taken around midnight on Sept. 14, revealed that Tropical Depression 20 had become more organized helping confirm that it had become Tropical Storm Teddy in the Central Atlantic Ocean. The image was created using the NASA Worldview application at NASA’s Goddard Space Flight Center in Greenbelt, Md.
NHC Senior Hurricane Forecaster Stacy Stewart noted, “Earlier ASCAT [scatterometer that measures wind speed] data indicated peak winds of 33 knots in the northwestern quadrant of the depression. Since then, convection has increased and so have the various satellite intensity estimates. The initial intensity is increased to 35 knots [40 mph] based on the ASCAT data, and satellite estimates of 35 knots from TAFB [NOAA’s Tropical Analysis and Forecast Branch] and 38 knots from University of Wisconsin-Madison-CIMSS SATCON.” The CIMSS Satellite Consensus (SATCON) product blends tropical cyclone intensity estimates derived from multiple objective algorithms to produce an ensemble estimate of intensity for current tropical cyclones worldwide.
Teddy’s Status on Sept. 14
At 5 a.m. EDT (0900 UTC) on Sept. 14, the center of Tropical Storm Teddy was located near latitude 13.4 degrees north and longitude 40.4 degrees west. Teddy is located about 1,405 miles (2,260 km) east of the Lesser Antilles. Teddy is moving toward the west-northwest near 14 mph (22 kph). Maximum sustained winds have increased to near 40 mph (65 kph) with higher gusts. The estimated minimum central pressure is 1004 millibars.
Teddy’s Forecast
A continued west-northwestward motion is expected for the next day or two followed by a turn toward the northwest by mid-week. Additional strengthening is anticipated, and Teddy is forecast to become a hurricane in a couple of days.
Large swells generated by Tropical Storm Teddy are expected to reach the Lesser Antilles and the northeastern coast of South America on Wednesday. These swells are likely to cause life-threatening surf and rip current conditions.
About NASA’s EOSDIS Worldview
NASA’s Earth Observing System Data and Information System (EOSDIS) Worldview application provides the capability to interactively browse over 700 global, full-resolution satellite imagery layers and then download the underlying data. Many of the available imagery layers are updated within three hours of observation, essentially showing the entire Earth as it looks “right now.”
NASA Researches Earth from Space
For more than five decades, NASA has used the vantage point of space to understand and explore our home planet, improve lives and safeguard our future. NASA brings together technology, science, and unique global Earth observations to provide societal benefits and strengthen our nation. Advancing knowledge of our home planet contributes directly to America’s leadership in space and scientific exploration.