Kenneth (Southern Indian Ocean)

Apr. 26, 2019 – NASA Sees Remnants of Tropical Cyclone Kenneth Over Northern Mozambique

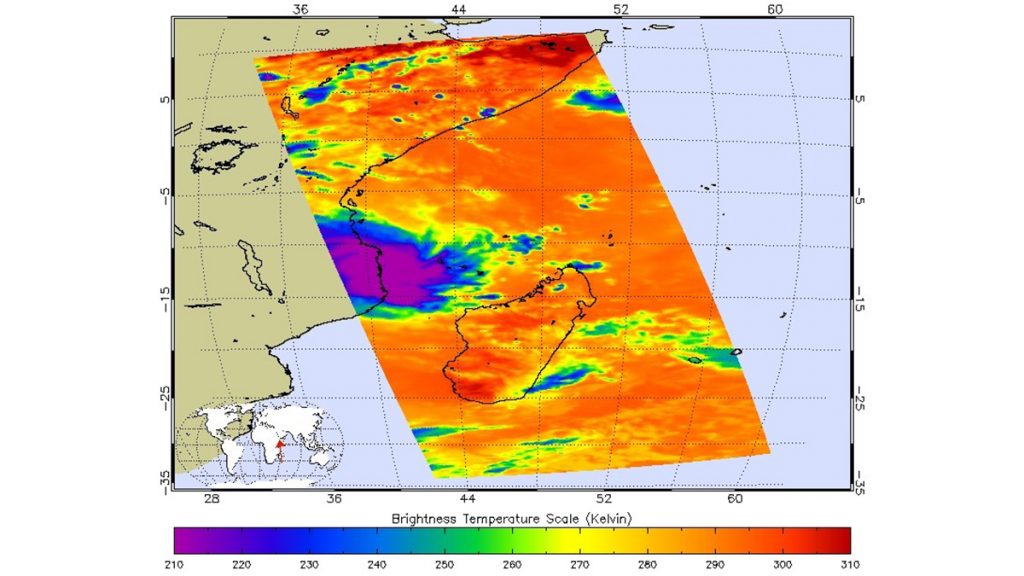
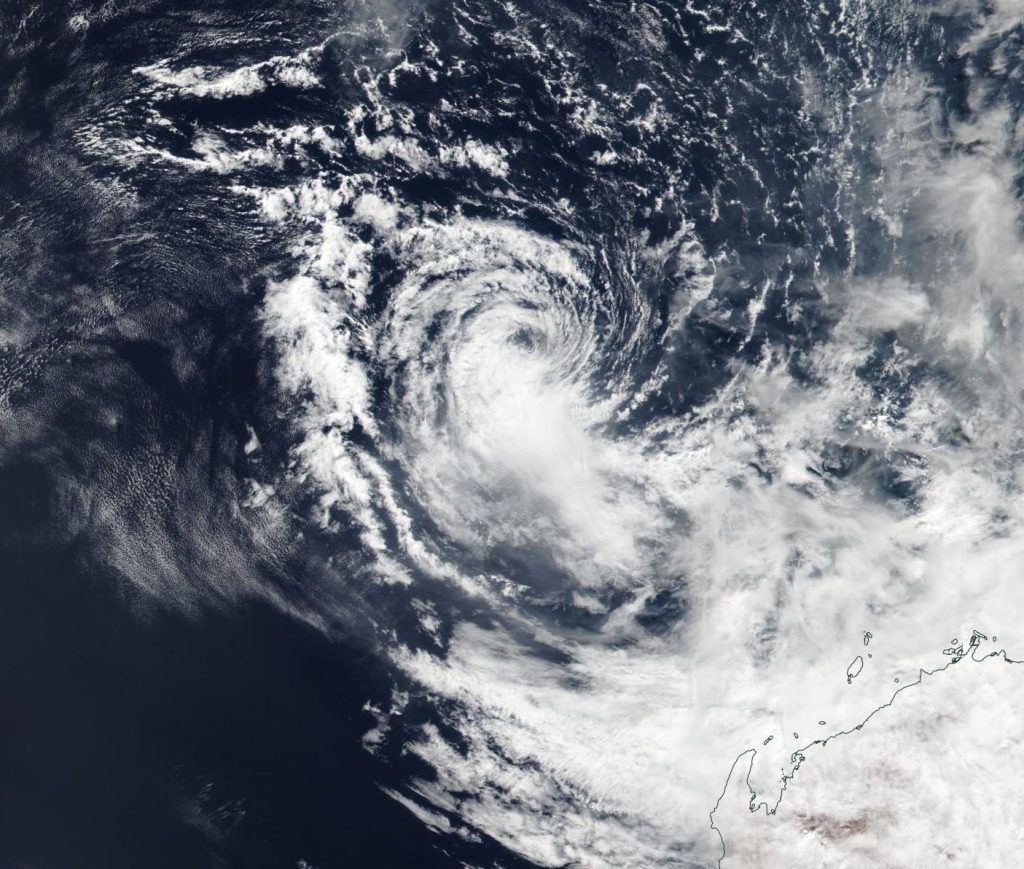
NASA’s Aqua satellite provided a visible image of the remnant clouds and storms still lingering over northern Mozambique on April 26. Tropical Cyclone Kenneth made landfall in the less-populated northern reaches of Mozambique on April 25.

Aqua image of Kenneth
On April 25, NASA’s Aqua satellite passed over Mozambique and captured a visible image of the remnants of Tropical Cyclone Kenneth as it continued to linger over the country and generate rainfall. Credit: NASA Worldview, Earth Observing System Data and Information System (EOSDIS)

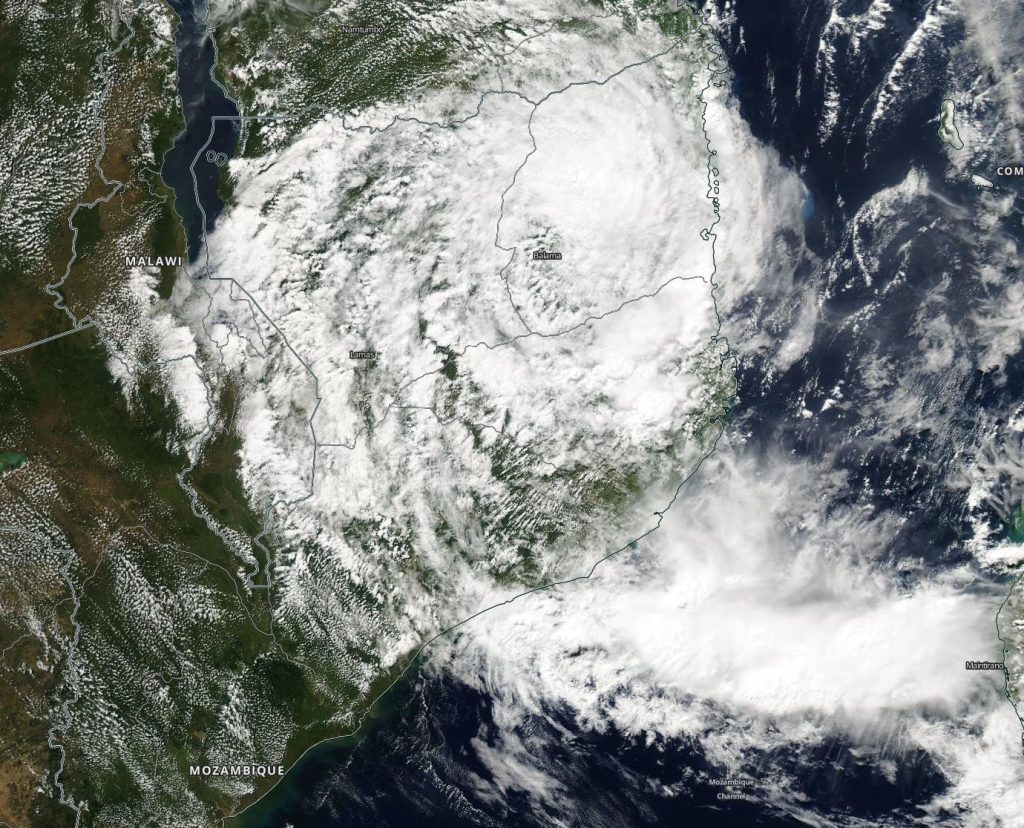
On April 25, NASA’s Aqua satellite passed over Mozambique. The Moderate Resolution Imaging Spectroradiometer or MODIS instrument captured a visible image of the remnants of Tropical Cyclone Kenneth as it continued to linger over the country and generate rainfall. According to the Republic of Mozambique’s National Meteorological Institute (NMI), on April 25, “Kenneth was nestled in the valley of Cabo Delgado, located in the District of Macomia.”

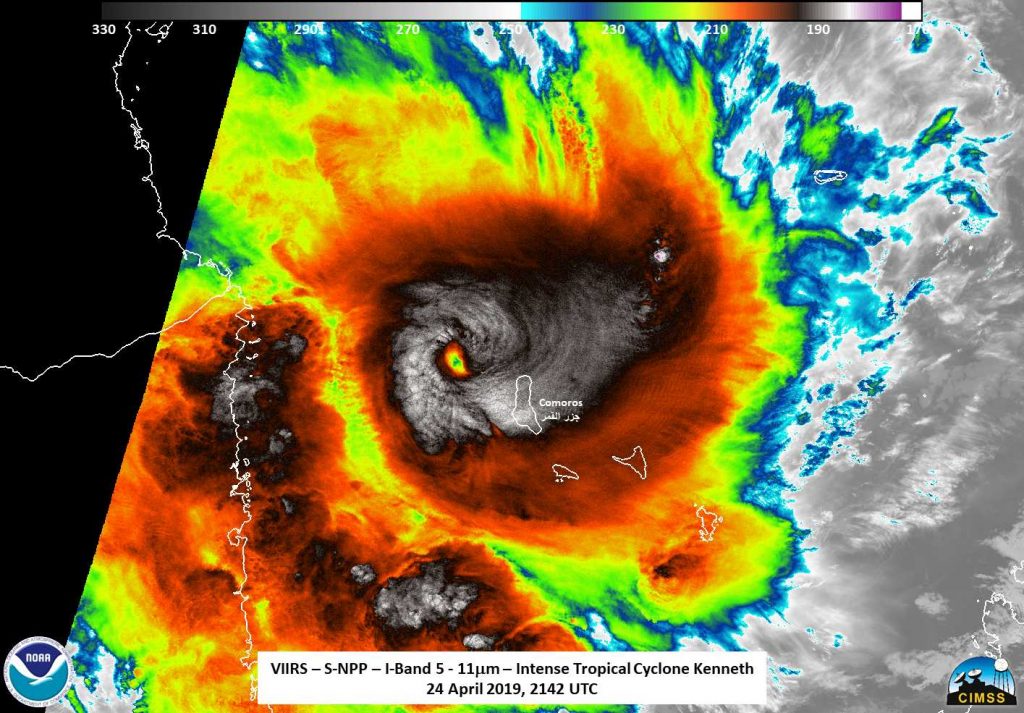
According to the Joint Typhoon Warning Center, Kenneth made landfall with maximum wind speeds of 140 miles per hour (220 kph), the equivalent of a Category 4 hurricane.

Kenneth weakened rapidly overnight, as it moved north of Pemba. Part of the area Kenneth moved over includes the Parque Nacional das Quirimbas or the National Park of Quirimbas. The park covers 68 miles (110 kilometers) and 11 of the southernmost Quirimbas islands. On the mainland, the park is located along the northeast coast of Mozambique.

According to CNN meteorologist Chad Myers, a storm surge was recorded between 16.4 and 23 feet (5 and 7 meters) high in areas located north of Pemba. Kenneth has already dropped over 9.8 inches (250 mm) of rainfall and the storm is expected to continue raining over Mozambique for the next several days.

NMI forecasters noted on April 25, “Heavy rains are expected to be very strong (1.9 to 3.9 inches or 50 to 100 millimeters in 24 hours), strong gusts up to (43.4 mph) 70 kilometers per hour and severe thunderstorms in the provinces of Cabo Delgado (all districts), Nampula (districts of Nacala, Memba, Erati, Nacarroa, Muecate, Namapa, Island of Mocambique, Mussoril and Monapo) and Niassa (districts of Mecula, Marrupa and Nipepe).”

For updated alerts from NMI, visit: http://www.inam.gov.mz/index.php/pt/alertas-e-avisos

By Rob Gutro
NASA’s Goddard Space Flight Center

Kenneth (Southern Indian Ocean)

Apr. 25, 2019 – NASA’s AIRS Images Cyclone Kenneth over Mozambique

Just weeks after Cyclone Idai left a path of destruction through Mozambique, Cyclone Kenneth is now battering the country in southeast Africa. It is likely the strongest storm on record to hit Mozambique, with wind speeds equivalent to a Category 4 hurricane at landfall. It is also the first time in recent history that the country has been hit by back-to-back hurricane-strength storms.

AIRS image of Kenneth
This infrared image from NASA’s Atmospheric Infrared Sounder (AIRS) shows the temperature of clouds or the surface in and around Tropical Cyclone Kenneth as it was about to make landfall in northern Mozambique on Thursday, April 25.  Full image and caption.
Credits: NASA/JPL-Caltech

NASA’s Atmospheric Infrared Sounder (AIRS) instrument captured this infrared image of Kenneth just as the storm was about to make landfall on April 25. The large purple area indicates very cold clouds carried high into the atmosphere by deep thunderstorms. The orange areas are mostly cloud-free; the clear air is caused by air moving outward from the cold clouds near the storm’s center, then downward into the surrounding areas.

The image was taken at 1:30 p.m. local time, just before the cyclone made landfall in northern Mozambique’s Cabo Delgado Province. With maximum sustained winds of 140 mph (225 kph), Kenneth was the first known hurricane-strength storm to make landfall in the province. Heavy rainfall and life-threatening flooding are expected over the next several days.

AIRS, in conjunction with the Advanced Microwave Sounding Unit (AMSU), senses emitted infrared and microwave radiation from Earth to provide a three-dimensional look at Earth’s weather and climate. Working in tandem, the two instruments make simultaneous observations down to Earth’s surface, even in the presence of heavy clouds. With more than 2,000 channels sensing different regions of the atmosphere, the system creates a global, three-dimensional map of atmospheric temperature and humidity, cloud amounts and heights, greenhouse gas concentrations and many other atmospheric phenomena. Launched into Earth orbit in 2002, the AIRS and AMSU instruments fly onboard NASA’s Aqua spacecraft and are managed by NASA’s Jet Propulsion Laboratory in Pasadena, California, under contract with NASA. JPL is a division of Caltech.

More information about AIRS and NASA’s Disasters Program can be found here:

https://airs.jpl.nasa.gov/

https://disasters.nasa.gov/

By Esprit Smith
Jet Propulsion Laboratory, Pasadena, Calif.
818-354-4269
esprit.smith@jpl.nasa.gov

Lorna (Southern Indian Ocean)

Apr. 25, 2019 – NASA Finds a More Circular Tropical Cyclone Lorna

NASA-NOAA’s Suomi NPP satellite passed over the Southern Indian Ocean and captured a visible image of what appeared to be a more organized Tropical Cyclone Lorna.

Aqua image of Lorna
NASA-NOAA’s Suomi NPP satellite passed over the Southern Indian Ocean and captured a visible image of Tropical Cyclone Lorna, on April 25 at 4:30 a.m. EDT (0830 UTC). Credit: NASA/NOAA/NRL

The Suomi NPP satellite flew over Lorna on April 25 at 4:30 a.m. EDT (0830 UTC) and the Visible Infrared Imaging Radiometer Suite (VIIRS) instrument provided a visible image of the storm. The VIIRS image showed a more circular storm, indicating that the storm was consolidating and strengthening. Microwave data revealed an eye feature.

At 11 a.m. EDT (1500 UTC) on April 25, Tropical Cyclone Lorna was centered near 10.8 degrees south latitude and 85.9 degrees east longitude, about 824 miles east-southeast of Diego Garcia. Lorna was moving to the east-southeast and had maximum sustained winds 50 knots (57 mph/92 kph).

Lorna is no threat to land areas. Lorna is expected to move southeast while strengthening to 75 knots (86 mph/139 kph) attaining hurricane strength. After three days, the storm will turn south and become extra-tropical.

By Rob Gutro 
NASA’s Goddard Space Flight Center

Kenneth (Southern Indian Ocean)

Apr. 25, 2019 – NASA-NOAA Satellite Catches Intense Tropical Cyclone Kenneth Make Landfall in Northern Mozambique

Mozambique is still recovering from deadly Tropical Cyclone Idai, and a second powerful tropical cyclone has now made landfall in the country. As NASA-NOAA’s Suomi NPP satellite passed over the Southern Indian Ocean, it captured an infrared image of Tropical Cyclone Kenneth making landfall in northern Mozambique.

Suomi NPP image of Kenneth
NASA-NOAA Suomi NPP satellite observed Kenneth at 5:24 p.m. EDT (2142 UTC) on April 24, 2019. On the edge of the pass as it was to the northwest of Comoros. The infrared imagery showed features that are typical of an intense tropical system with overshooting cloud tops and convectively driven tropospheric gravity waves. Credit: NASA/NOAA/ University of Wisconsin – Madison, SSES-CIMSS, William Straka III

Tropical Cyclone Idai made landfall on March 15 in central Mozambique. It caused catastrophic floodinglandslides, and large numbers of casualties across Mozambique, Malawi, and Zimbabwe.

Intense Tropical Cyclone Kenneth made landfall today, April 25, in northern Mozambique. It was likely the strongest storm on record in northern Mozambique, equivalent to a weak Category 4, strong Category 3 storm on the Saffir-Simpson Hurricane Wind Scale. Kenneth has also made history simply by the fact that Mozambique has never been hit by back-to-back storms.

Over night of April 24 and 25, intense Tropical Cyclone Kenneth was observed by three satellites including Suomi NPP, NOAA’s NOAA-20 and the GCOM-W1 satellite. Each provided several unique points of view of the storm.  On April 25 at 0000 UTC (April 24 at 8 p.m. EDT) The Regional Specialized Meteorological Centre or RSMC at La Reunion Island stated that Kenneth had winds of 105 knots (121 mph/194 kph), which would have meant at the time it was the equivalent to a Category 3 storm. By 2 a.m. EDT (0600 UTC), the Joint Typhoon Warning Center had satellite derived winds of 125 knots (144 mph/213 kph).

William Straka III, a Researcher at the University of Wisconsin – Madison Space Science and Engineering Center (SSEC) Cooperative Institute for Meteorological Satellite Studies (CIMSS) created imagery using the NASA-NOAA Suomi NPP satellite data. “Kenneth was first observed by Suomi-NPP at 5:24 p.m. EDT (2142 UTC) on the edge of the pass as it was to the northwest of Comoros. The infrared imagery showed features that are typical of an intense tropical system with overshooting cloud tops and convectively driven tropospheric gravity waves.”

Between the time Suomi NPP passed overhead and the NOAA-20 polar orbiting satellite passed over the region, the eye appeared to clear.  In addition, the Advanced Technology Microwave Sounder (ATMS) instrument aboard the NOAA-20 satellite looked at the inner structure of the storm. The ATMS microwave imagery showed powerful thunderstorms completely surrounded the eye of the storm.

By 11 a.m. EDT (1500 UTC) on April 25, Kenneth was still making landfall in northeastern Mozambique.  It was centered near 12.1 degrees south latitude and 50.8 east longitude. That is about 150 miles west of Comoros Island. Kenneth was moving to the west-southwest and had maximum sustained winds 120 knots (138 mph/222 kph).

The JTWC forecaster said the system will rapidly weaken over land, but the remnants may re-emerge over the Mozambique Channel after a few days.

By Rob Gutro
NASA’s Goddard Space Flight Center

Lorna (Southeastern Indian Ocean)

Apr. 24, 2019 – NASA’s Aqua Satellite Catches Tropical Cyclone Lorna Organizing

Visible satellite imagery from NASA’s Aqua satellite revealed the recently formed Tropical Storm Lorna was getting organized in the Southeastern Indian Ocean.

Aqua image of Lorna
At 4:15 a.m. EDT (0815 UTC) on April 24, the MODIS instrument aboard Aqua captured a visible image of newly formed Tropical Storm Lorna in the Southeastern Indian Ocean. Credit: NASA/NRL

Lorna developed into a tropical storm on April 23 at 11 a.m. EDT (1500 UTC) and was named Tropical Cyclone 25S. On April 24, it received the name Lorna. At 4:15 a.m. EDT (0815 UTC) on April 24, the Moderate Resolution Imaging Spectroradiometer or MODIS instrument aboard Aqua captured a visible image of Lorna. The Joint Typhoon Warning Center or JTWC forecasters noted “persistent deep convection to the west of, and obscuring, the low level circulation center.”

By 11 a.m. EDT (1500 UTC) on April 24, Tropical Storm Lorna had maximum sustained winds near 40 knots (46 mph/74 kph). Lorna was centered near 10.9 degrees south latitude and 84.6 degrees east longitude, approximately 743 nautical miles southeast of Diego Garcia. Lorna has tracked to the east-southeast.

The tropical low pressure area designated System 92S is located east of Tropical Cyclone Lorna. The JTWC forecaster expect 92S to interact Lorna may merge with it.

Lorna is forecast to strengthen to hurricane-strengthen and move in a southerly direction. Lorna is not expected to affect any land areas.

By Rob Gutro
NASA’s Goddard Space Flight Center

Kenneth (Southern Indian Ocean)

Apr. 24, 2019 – NASA Examines Tropical Cyclone Kenneth in Infrared Light

The Atmospheric Infrared Sounder or AIRS instrument aboard NASA’s Aqua satellite passed over Tropical Cyclone Kenneth and analyzed the storm in infrared light.

AIRS image of Kenneth
NASA’s Aqua satellite provided an infrared picture of Kenneth’s cloud top temperatures on April 23 at 6:41 a.m. EDT (1041 UTC). Credit: NASA JPL, Heidar Thrastarson

Infrared light provides scientists with temperature data and that is important when trying to understand how strong storms can be. The higher the cloud tops, the colder and the stronger they are. So infrared light as that gathered by the AIRS instrument can identify the strongest sides of a tropical cyclone.

NASA’s Aqua satellite flew over Kenneth on April 23 at 6:41 a.m. EDT (1041 UTC).  AIRS detected strongest storms around the center of circulation and in a band of thunderstorms southwest of the center. Those areas revealed cloud top temperatures as cold as minus 63 degrees Fahrenheit (minus 53 degrees Celsius). Storms with cloud top temperatures that cold extend high into the troposphere and have the capability to produce heavy rainfall.

Aqua image of Kenneth
The MODIS instrument aboard NASA’s Aqua satellite provided this visible image of Tropical Cyclone Kenneth on April 24 as it moved into the Mozambique Channel, the body of water between Madagascar and Mozambique. Credit: NASA Worldview, Earth Observing System Data and Information System (EOSDIS)

On April 24, Kenneth was located northeast of the island nation of Madagascar in the Southern Indian Ocean. The Moderate Resolution Imaging Spectroradiometer or MODIS instrument aboard NASA’s Aqua satellite provided a visible image of Tropical Cyclone Kenneth as it moved into the Mozambique Channel. The Channel is a body of water located between the island nation of Madagascar and Mozambique on the African mainland.

On April 24 at 5 a.m. EDT (0900 UTC) Tropical cyclone Kenneth was located near 10.9 degrees south latitude and 45.7 east longitude. That is 148 nautical miles east-northeast of Comoros Island. Kenneth was moving to the west. Maximum sustained winds had increased to 70 knots (80 mph/130 kph) making Kenneth hurricane-strength.

Forecasters at the Joint Typhoon Warning Center expect Kenneth to move west and then shift toward the west-southwest while strengthening to 105 knots (121 mph/194 kph) prior to landfall in northern Mozambique.

For more information about AIRS, visit: airs.jpl.nasa.gov.

By Rob Gutro
NASA’s Goddard Space Flight Center

Kenneth (Southern Indian Ocean)

Apr. 23, 2019 – NASA Catches Formation of Tropical Cyclone Kenneth Near Aldabra

Visible satellite imagery from NASA’s Aqua satellite revealed the formation of Tropical Storm Kenneth in the Southern Indian Ocean. Kenneth formed north of Madagascar and east of the Aldabra Atoll.

MODIS image of Kenneth
At 6:45 a.m. EDT (1045 UTC) on April 23, the MODIS instrument aboard Aqua captured a visible image of newly formed Tropical Storm Kenneth north of Madagascar and east of the Aldabra Atoll. Credit: NASA/NRL

An atoll is a ring shaped coral reef. The Aldabra is the world’s second-largest coral atoll. It is part of the Aldabra Group of islands and part of the Outer Islands of the Seychelles.

At 6:45 a.m. EDT (1045 UTC) on April 23, 2019, the Moderate Resolution Imaging Spectroradiometer or MODIS instrument aboard Aqua captured a visible image of Kenneth. The Joint Typhoon Warning Center or JTWC forecasters noted “Satellite imagery shows deep convection (rising air that forms thunderstorms that make up a tropical cyclone) beginning to wrap symmetrically around a low-level circulation center and forming the early stages of a central dense overcast.”

At 5 a.m. EDT (0900 UTC) on April 23, Tropical Storm Kenneth had maximum sustained winds near 35 knots (40 mph/65 kph). At that time, Kenneth was centered near 10.4 degrees south latitude and 49.4 degrees east longitude, approximately 727 nautical miles northwest of Port Louis, Mauritius. Kenneth was tracking to the west-southwest.

Kenneth is expected to move toward the border of Mozambique and Tanzania. The area in which the storm is forecast to track, has very warm sea surface temperatures that will allow the storm to strengthen over the next couple of days. Kenneth is forecast to make landfall in extreme northern Mozambique on April 25.

Residents along the Mozambique/Tanzania border should make preparations for storm surge along the coasts, heavy rainfall and hurricane-force winds.

On April 22, the Tanzania Meteorological Agency issued a broadcast about the development of Tropical Storm Kenneth and its possible effects: https://youtu.be/7_bROK_3RbQ.

For updates from the Tanzania Meteorological Agency, visit: http://meteo.go.tz/

By Rob Gutro
NASA’s Goddard Space Flight Center

Wallace (Southern Indian Ocean)

Apr. 10, 2019 – NASA-NOAA Satellite Sees Tropical Cyclone Wallace Dissipating

Tropical Cyclone Wallace was dissipating in the Southern Indian Ocean when NASA-NOAA’s Suomi NPP satellite passed overhead.  Wallace was located off the northwestern coast of Western Australia.

Suomi NPP image of Wallace
NASA-NOAA’s Suomi NPP satellite passed over the Southern Indian Ocean and captured a visible image of Tropical Cyclone Wallace on April 10 as it continued to dissipate off the coast of Western Australia. Credit: NASA Worldview, Earth Observing System Data and Information System (EOSDIS).

The Australian Bureau of Meteorology or ABM noted that a Strong Wind Warning was in effect for the Esperance Coast and Eucla Coast on April 10 as Wallace continued weakening far off the coast of Western Australia.

NASA-NOAA’s Suomi NPP satellite passed over Wallace on April 10 and the Visible Infrared Imaging Radiometer Suite (VIIRS) instrument provided a visible image of the storm. The VIIRS image showed wind shear has pushed the bulk of the system’s clouds southeast of the center, and was tearing the storm apart.

At 11 p.m. EDT on April 9 (0300 UTC on April 10), the Joint Typhoon Warning Center issued the final bulletin on Tropical Cyclone Wallace. At that time, maximum sustained winds were near 35 knots (40 mph/65 kph). Wallace was centered near 16.9 degrees south latitude and 111.9 east longitude. That’s about 344 nautical miles north-northwest of Learmonth. Wallace was moving to the west.

Wind shear is forecast to increase over April 10 and Wallace is expected to dissipate by April 11.

By Rob Gutro 
NASA’s Goddard Space Flight Center

Wallace (Southern Indian Ocean)

Apr. 09, 2019 – NASA Imagery Shows Winds Tearing Tropical Cyclone Wallace

Visible imagery from NASA’s Terra satellite showed Tropical Cyclone Wallace being sheared apart from strong northwesterly winds. Clouds from Wallace stretched far inland over a well-known wilderness area.

Terra image of Wallace
On April 9, 2019, the MODIS instrument aboard NASA’s Terra satellite provided a visible image of Tropical Cyclone Wallace in the Southern Indian Ocean, off the coast of Western Australia. Credit: NASA Worldview, Earth Observing System Data and Information System (EOSDIS)

In general, wind shear is a measure of how the speed and direction of winds change with altitude. Tropical cyclones are like rotating cylinders of winds. Each level needs to be stacked on top each other vertically in order for the storm to maintain strength or intensify. Wind shear occurs when winds at different levels of the atmosphere push against the rotating cylinder of winds, weakening the rotation by pushing it apart at different levels.

On April 9, the Moderate Resolution Imaging Spectroradiometer or MODIS instrument aboard NASA’s Terra satellite provided a visible image of Wallace. Wallace’s center was over the Southern Indian Ocean and well off the Pilbara coast of Western Australia. Northwesterly winds were pushing the bulk of Wallace’s clouds southeast of its center.

Wallace’s southeastern quadrant was spreading clouds along the Pilbara coastline of northern Western Australia from Exmouth north to Port Hedland. Clouds were being pushed far inland and were streaming over Karijini National Park. The park is a large wilderness area in the Hamersley Range of Western Australia.

At 8 a.m. EDT (8:00 p.m. AWST local time), the Australian Bureau of Meteorology or ABM reported that Tropical Cyclone Wallace was located near 16.5 degrees south latitude and 113.9 east longitude. That is 560 km north-northwest of Karratha and 610 km north of Exmouth. Wallace was moving west-southwest at 7 kilometers per hour. Maximum sustained winds were near 45 knots (52 mph/83 kph).

ABM said “Tropical Cyclone Wallace will continue to weaken as it tracks westwards.

Wallace is forecast to be below tropical cyclone intensity by Wednesday [April 10] afternoon.

For updated forecasts from the Australian Bureau of Meteorology, visit: http://www.bom.gov.au

By Rob Gutro
NASA’s Goddard Space Flight Center

Wallace (Southern Indian Ocean)

Apr. 08, 2019 – NASA-NOAA Satellite Finds a More Circular Tropical Cyclone Wallace

NASA-NOAA’s Suomi NPP satellite passed over the Southern Indian Ocean and captured a visible image of what appeared to be a more organized Tropical Cyclone Wallace, off the coast of Western Australia.

Suomi NPP image of Wallace
NASA-NOAA’s Suomi NPP satellite passed over the Southern Indian Ocean and captured a visible image of Tropical Cyclone Wallace, on April 8, as it continued to move away from the coast of Western Australia. Credit: NASA Worldview, Earth Observing System Data and Information System (EOSDIS).

The Australian Bureau of Meteorology or ABM noted that only a High Seas Warning was in effect off the coast of Western Australia, as Wallace continues to track away from the coast.

NASA-NOAA’s Suomi NPP satellite passed over Wallace on April 8 and the Visible Infrared Imaging Radiometer Suite (VIIRS) instrument provided a visible image of the storm. The VIIRS image showed bands of thunderstorms from the western to the southern quadrants.

ABM noted on April 8 “An eye is starting to emerge on the most recent imagery with the system adopting a more circular appearance.” At 5:43 a.m. EDT (0943 UTC) satellite imagery showed strong convection (rising air that forms thunderstorms that make up a tropical cyclone) partially wrapping around the center to the west and south of the center.

At 8:41 a.m. EDT (8:41 pm WST local time, Western Australia) on April 8, Tropical Cyclone Wallace near 15.8 degrees south latitude and 115.8 east longitude. That’s about 560 km (348 miles) north northwest of Karratha. Wallace was moving southwest at 17 kilometers (10.5 miles) per hour. Maximum sustained winds were near 60 knots (69 mph/110 kph).

ABM stated that Wallace is forecast to strengthen over the next day or two before weakening below tropical cyclone intensity Wednesday [April 10] afternoon or evening.

A strong mid-level elongated area of high pressure or a ridge, located to Wallace’s southeast, will steer the system to the southwest overnight and then a more westerly track during Tuesday and Wednesday. Wallace is expected to remain well offshore from the Western Australian coastline and is not expected to affect the coast of Western Australia.

For updated forecasts, visit the ABM website: http://www.bom.gov.au/cyclone/index.shtml

By Rob Gutro 
NASA’s Goddard Space Flight Center