Oct. 09, 2018 – NASA’s Aqua Satellite Sees Hurricane Michael Strengthening
Hurricane Michael continued strengthening while moving north-northwestward over the southeastern Gulf of Mexico as NASA’s Aqua satellite provided infrared and visible imagery of the storm.
NOAA’s National Hurricane Center or NHC noted on Oct. 9 that life-threatening storm surge, hurricane force winds and heavy rainfall can be expected along the northeastern gulf coast as Michael continues to move toward landfall.
A Storm Surge Warning is in effect for. Okaloosa/Walton County Line Florida to Anclote River Florida. A Storm Surge Watch is in effect for Anclote River Florida to Anna Maria Island Florida, including Tampa Bay, the Alabama/Florida border to Okaloosa/Walton County Line Florida. A Hurricane Warning is in effect for the Alabama/Florida border to Suwannee River Florida, and a Hurricane Watch is in effect from the Alabama/Florida border to the Mississippi/Alabama border. In addition, a Tropical Storm Warning is in effect from the Alabama/Florida border to the Mississippi/Alabama border and for Suwanee River, Florida to Chassahowitzka, Florida. A Tropical Storm Watch is in effect for Chassahowitzka to Anna Maria Island Florida, including Tampa Bay, the Mississippi/Alabama border to the Mouth of the Pearl River and from Fernandina Beach, Florida to South Santee River, South Carolina.
Peering at Michael in Infrared Light
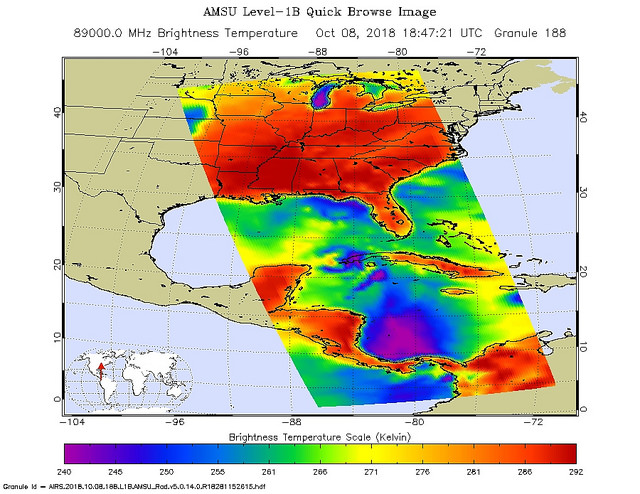
The Atmospheric Infrared Sounder or AIRS instrument aboard NASA’s Aqua satellite passed over Hurricane Michael on Oct. 8 at 2:47 p.m. EDT (1847 UTC) just after it strengthened into a Category 1 hurricane and analyzed the storm in infrared light. Infrared light provides scientists with temperature data and that’s important when trying to understand how strong storms can be. The higher the cloud tops, the colder and the stronger they are. So infrared light as that gathered by the AIRS instrument can identify the strongest sides of a tropical cyclone. AIRS detected strongest storms around the center and in a thick band of storms feeding into the center from the eastern quadrant. In those areas cloud top temperatures as cold as minus 63 degrees Fahrenheit (minus 53 degrees Celsius). Storms with cloud top temperatures that cold have the capability to produce heavy rainfall.
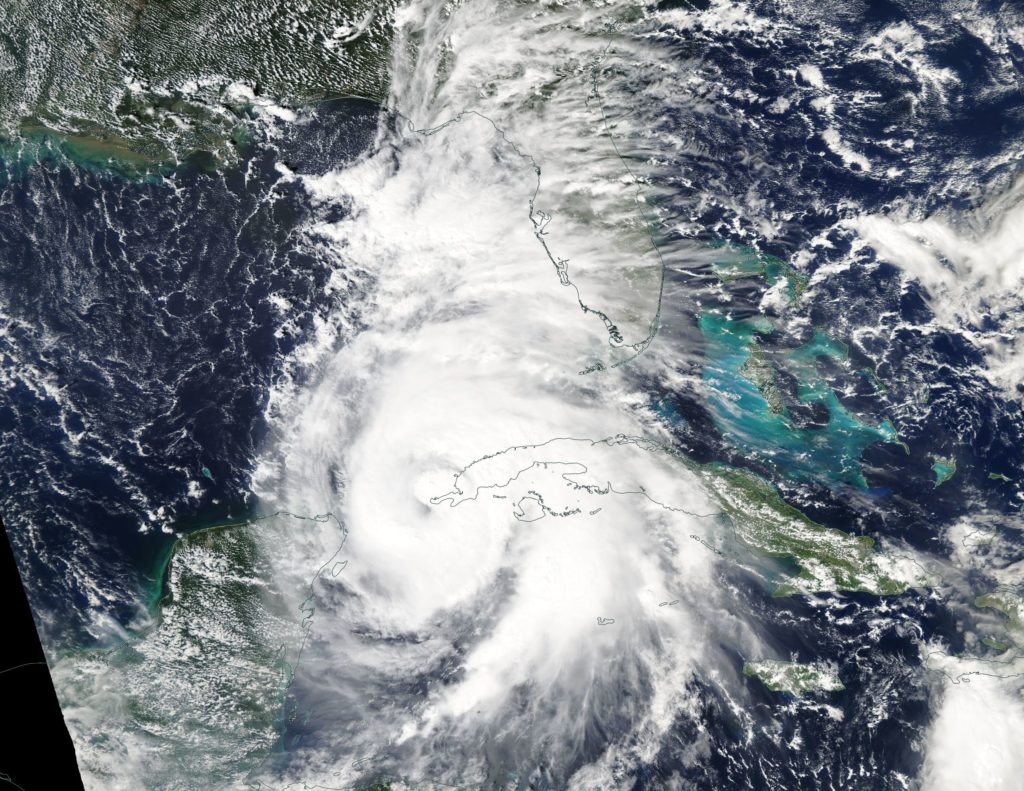
A Visible Image of Michael
On Oct. 8, the MODIS or Moderate Resolution Imaging Spectroradiometer instrument that also flies aboard NASA’s Aqua satellite captured a visible image of Hurricane Michael when it was a Category 1 hurricane near the western tip of Cuba. The eye appeared covered by clouds, as powerful thunderstorms circled the center. The large feeder band of thunderstorms seen by the AIRS instrument the previous day was still wrapping into the center from the eastern side of the storm and sweeping over western Cuba.

Status of Michael on Oct. 9
The NHC reported at 8 a.m. EDT (1200 UTC) on Oct. 9, the eye of Hurricane Michael was located near latitude 24.5 degrees north and longitude 86.1 degrees west. That’s about 365 miles (590 km) south of Apalachicola, Florida.
NHC said “Michael is moving toward the north-northwest near 12 mph (19 kph). A north-northwestward to northward motion is expected through tonight, followed by a northeastward motion on Wednesday and Thursday.
Data from a NOAA Hurricane Hunter aircraft indicate that the maximum sustained winds have increased to near 100 mph (155 kph) with higher gusts. Additional strengthening is expected, and Michael is forecast to be a major hurricane at landfall in Florida. Weakening is expected after landfall as Michael moves through the southeastern United States.
Hurricane-force winds extend outward up to 40 miles (65 km) from the center and tropical-storm-force winds extend outward up to 195 miles (315 km). NOAA buoy 42003 recently reported 1-minute mean winds of 47 mph (76 kph) and a wind gust of 54 mph (87 kph). The latest minimum central pressure reported by the NOAA aircraft is 968 millibars.”
NHC forecasters said “On the forecast track, the center of Michael will move across the eastern Gulf of Mexico through tonight. The center of Michael is expected to move inland over the Florida Panhandle or Florida Big Bend area on Wednesday, and then move northeastward across the southeastern United States Wednesday night, Oct. 10 and Thursday, Oct. 11.”
For updated forecasts, visit: www.nhc.noaa.gov