Oct. 03, 2018 – NASA Gets a Look at the Rainfall Rates within Typhoon Kong-Rey
The Global Precipitation Measurement mission or GPM core satellite passed over Typhoon Kong-Rey moving through the Northwestern Pacific Ocean and found heaviest rainfall occurring in the storm’s eyewall.
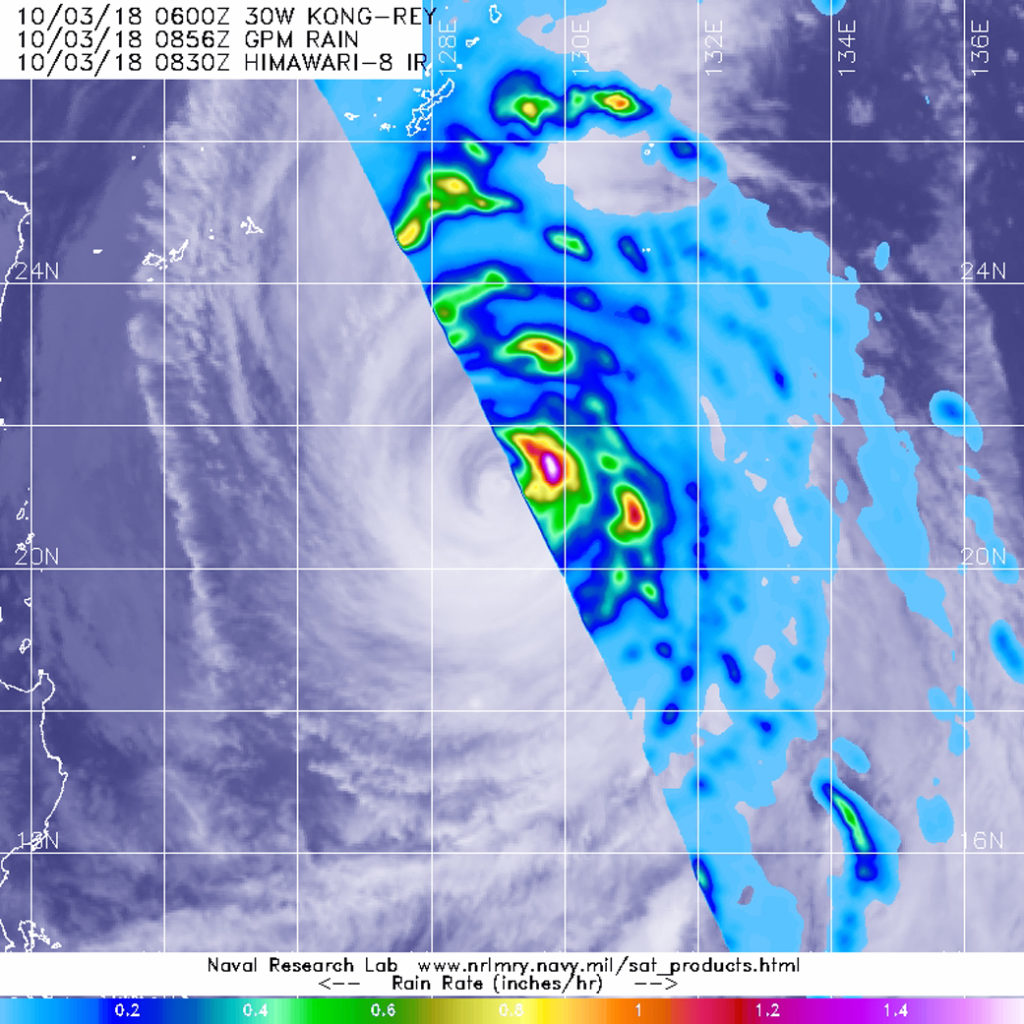
The GPM core observatory satellite passed over Typhoon Kong-Rey on Oct. 3 at 4:36 a.m. EDT (0836 UTC) and measured rainfall within. Heaviest rainfall was occurring in the northeastern eyewall at a rate greater than 1.4 inches per hour. GPM data was overlaid on Japan’s Himawari-8 satellite infrared imagery. Credit: NASA/JAXA/NRL
The eyewall of a tropical cyclone refers to the powerful thunderstorms that form a ring around the open eye. In the eye, air descends and prevents cloud formation. Around the eye, strong uplift of air creates powerful thunderstorms that extend high into the troposphere.
The GPM core observatory satellite passed over Typhoon Kong-Rey on Oct. 3 at 4:36 a.m. EDT (0836 UTC) and measured rainfall rates occurring within the storm. Data collected by the GPM satellite’s Microwave Imager (GMI) showed that powerful storms in the northeastern eyewall were producing the heaviest rainfall. Those storms were producing rainfall at a rate greater than 1.4 inches per hour. GPM is a joint mission between NASA and the Japan Aerospace Exploration Agency, JAXA.
The Joint Typhoon Warning Center or JTWC noted “animated enhanced infrared satellite imagery shows that convection has continued to rapidly weaken. The eye feature is now only 5 nautical miles wide and continues to erode.”
At 11 a.m. EDT (1500 UTC) the center of Kong-Rey was located near 22.0 degrees north latitude and 128.4 degrees east longitude. That’s about 298 nautical miles south of Kadena Air Base, Okinawa Island, Japan. Kong-Rey was moving toward the north-northwest. Maximum sustained winds remain near 115 mph (185 kph/100 knots).
JTWC forecasts Kong-Rey to continue moving north-northwest over the next couple of days, and its center will remain west of Okinawa and Amami Oshima. Kong-Rey is forecast to turn northeast and move into the Sea of Japan on Oct. 6.
Oct. 03, 2018 – NASA Peers into the Large Clear Eye of Hurricane Walaka
An infrared look by NASA’s Terra satellite found a ring of intense storms around the wide eye of Hurricane Walaka in the Central Pacific Ocean. Walaka remains a dangerous category 4 hurricane on the Saffir-Simpson Hurricane Wind Scale.
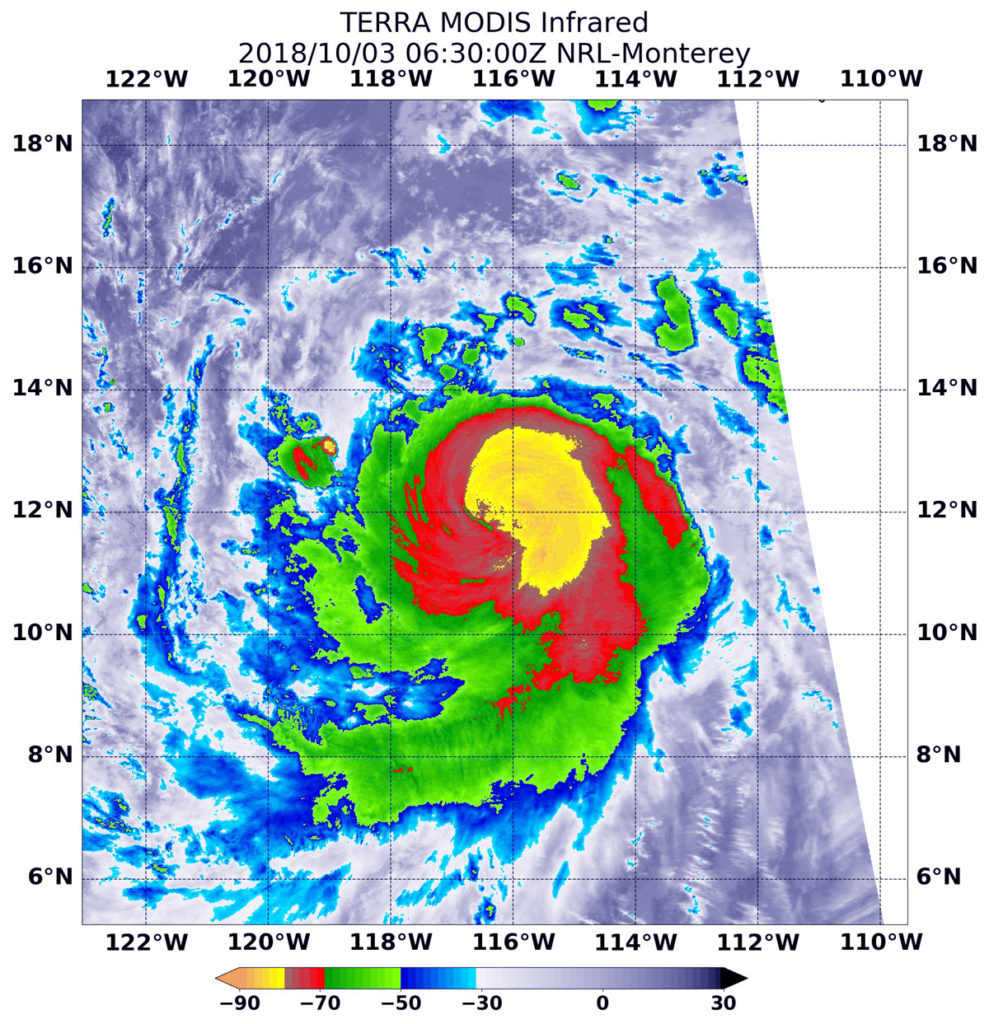
On Oct. 3 at 5:45 a.m. EDT (0945 UTC) NASA’s Terra satellite found coldest temperatures of strongest thunderstorms (yellow) in Hurricane Walaka were as cold as or colder than minus 80 degrees Fahrenheit (minus 62.2 Celsius) in the eyewall of the large, clear eye. Credit: NRL/NASA
NOAA’s Central Pacific Hurricane Center or CPHC cautioned on Oct. 3, “dangerous Hurricane Walaka is intensifying as it moves rapidly north toward the Papahanaumokuakea Marine National Monument and the Johnston Stoll remains in the south quadrant of Walaka.”
A Hurricane Warning is in effect for Johnston Atoll, the Papahanaumokuakea Marine National Monument from French Frigate and Shoals to Maro Reef. A Tropical Storm Warning is in effect for Papahanaumokuakea Marine National Monument from Nihoa to French and Frigate Shoals.
On Oct. 3 at 5:45 a.m. EDT (0945 UTC) the Moderate Resolution Imaging Spectroradiometer or MODIS instrument aboard NASA’s Terra satellite analyzed cloud top temperatures in infrared light. MODIS found cloud top temperatures of strongest thunderstorms ringed around the wide eye. Those temperatures were as cold as or colder than minus 80 degrees Fahrenheit (minus 62.2 degrees Celsius). They were embedded in a large area that circled the eye where cloud top temperatures were as cold as or colder than minus 70 degrees Fahrenheit (minus 56.6 degrees Celsius). Cloud top temperatures that cold indicate strong storms that have the capability to create heavy rain.
CPHC noted at 2 a.m. HST (8 a.m. EDT/1200 UTC), the center of Hurricane Walaka was located near latitude 18.9 degrees north and longitude 169.8 degrees west. That’s about 150 miles (240 km) north of Johnston Island.
Walaka is moving toward the north near 14 mph (23 kph), and it is expected to turn toward the north-northeast with a faster forward motion later today and tonight. Maximum sustained winds are now near 140 mph (225 kph) with higher gusts. Some gradual weakening is possible starting from today or tonight through Thursday, but Walaka is forecast to remain a powerful hurricane when it crosses the Papahanaumokuakea Marine National Monument tonight.
CPHC said, “Walaka is forecast to turn toward the north with a slower forward speed starting Thursday. On this forecast track, the center of Walaka will likely reach the Papahanaumokuakea Marine National Monument tonight.”
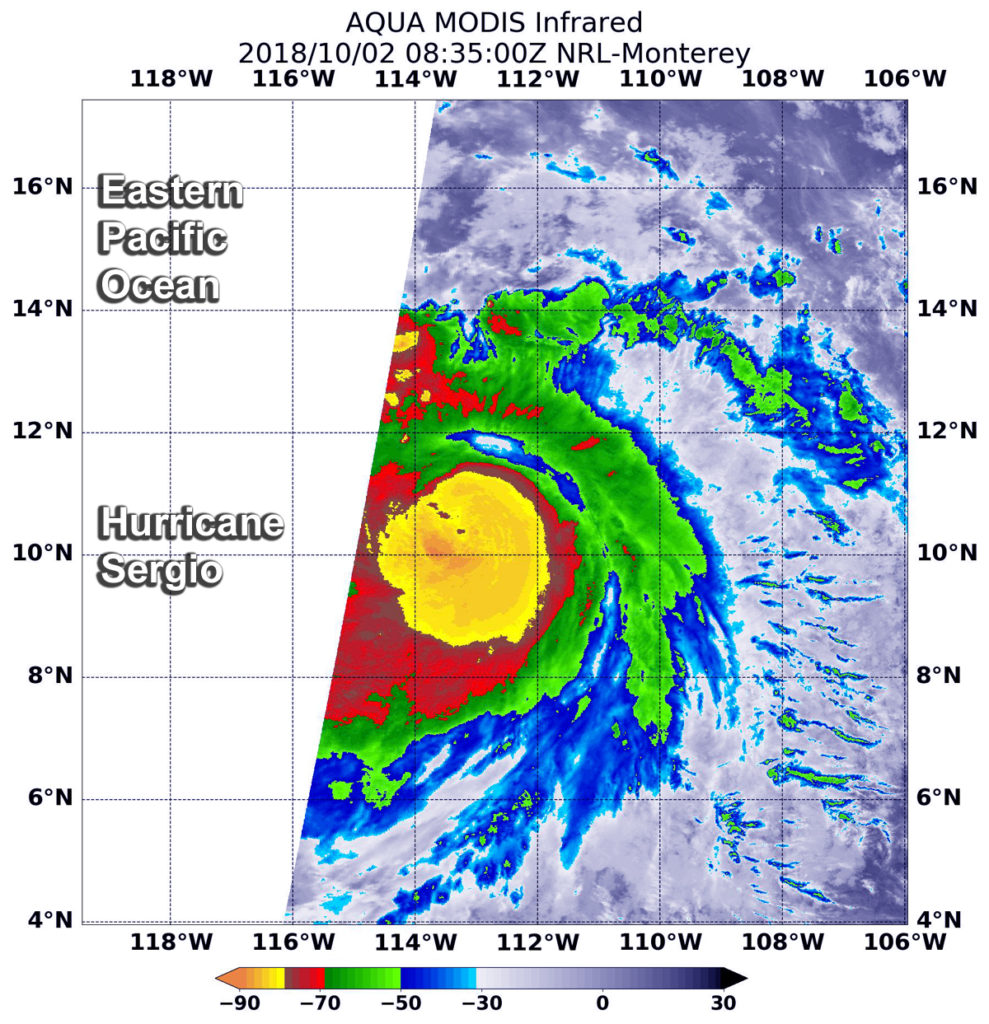
Oct. 03, 2018 – NASA Sees Powerful Storms Circling Major Hurricane Sergio’s Eye
Very powerful storms ringed the eye of Hurricane Sergio in infrared imagery from NASA’s Aqua satellite. Sergio is a major hurricane in the Eastern Pacific Ocean.
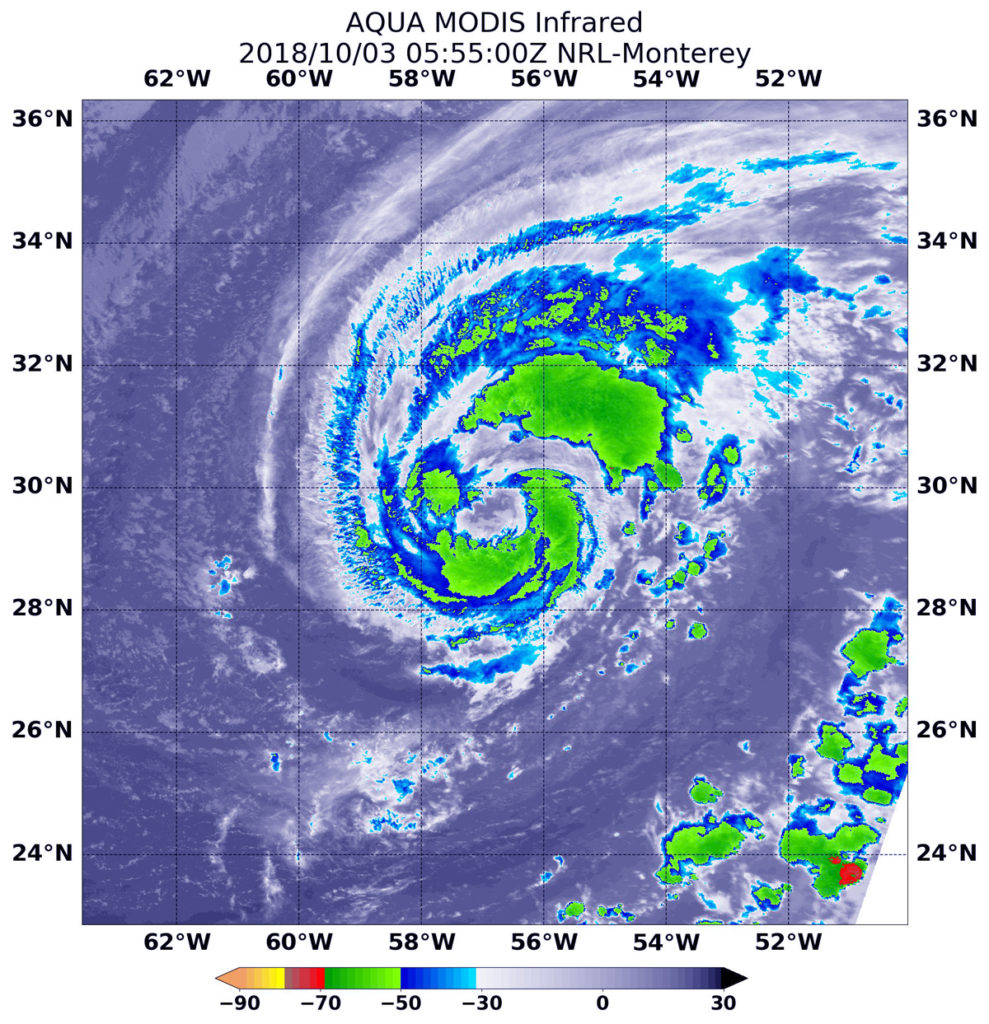
At 2:30 a.m. EDT (0630 UTC) on Oct. 3, the MODIS instrument that flies aboard NASA’s Aqua satellite gathered infrared data on Hurricane Sergio. Strongest thunderstorms circled the center where cloud top temperatures were as cold as (yellow) minus 80 degrees Fahrenheit (minus 62.2 Celsius). Credit: NASA/NRL
At 2:30 a.m. EDT (0630 UTC) on Oct. 3 the MODIS instrument that flies aboard NASA’s Aqua satellite gathered infrared data on Sergio. Infrared data provides temperature information.
Strongest thunderstorms wit coldest cloud tops appeared in the eyewall of the hurricane and extended outward from the center. MODIS found cloud top temperatures as cold as minus 80 degrees Fahrenheit (minus 62.2 Celsius). NASA research has shown that cloud tops with temperatures that cold were high in the troposphere and have the ability to generate heavy rain.
The National Hurricane Center or NHC noted at 5 a.m. EDT (0900 UTC), the center of Hurricane Sergio was located near latitude 12.3 degrees north and longitude 116.7 degrees west. Sergio is moving toward the west-northwest near 12 mph (19 kph). Fortunately, Sergio is far from land areas. It is about 855 miles (1,380 km) south-southwest of the southern tip of Baja California, Mexico.
A west-northwestward to northwestward motion at a slightly slower forward speed is expected over the next few days. Maximum sustained winds are near 115 mph (185 kph) with higher gusts. Sergio is a category 3 hurricane on the Saffir-Simpson Hurricane Wind Scale.
Some strengthening is forecast during the next day or so, with weakening expected to begin by Friday.
Oct. 03, 2018 – NASA Sees Atlantic’s Leslie Become a Hurricane
NASA’s Aqua satellite captured an infrared image of Hurricane Leslie that revealed strong storms circled the center.
At 1:55 a.m. EDT (0555 UTC) on Oct. 3, the MODIS instrument that flies aboard NASA’s Aqua satellite gathered infrared data on Hurricane Leslie. Strongest thunderstorms circled the center and were in a thick band northeast of center where cloud top temperatures were as cold as minus 63 degrees Fahrenheit (minus 53 Celsius). Credit: NASA/NRL
At 1:55 a.m. EDT (0555 UTC) on Oct. 3 the MODIS instrument that flies aboard NASA’s Aqua satellite gathered infrared data on Leslie. Infrared data provides temperature information. Strongest thunderstorms were fragmented as they circled the center and were in a thick band northeast of center where MODIS found cloud top temperatures as cold as minus 63 degrees Fahrenheit (minus 53 Celsius). NASA research has shown that cloud tops with temperatures that cold were high in the troposphere and have the ability to generate heavy rain.
The National Hurricane Center or NHC noted “Deep convection surrounding the center of Leslie has become better organized overnight, with the development of a ragged eye in infrared satellite images.” A microwave image revealed a well-defined low-level eye with a ring of broken convection surrounding it.
At 5 a.m. EDT (0900 UTC), the center of Hurricane Leslie was located near latitude 29.6 degrees north and longitude 56.9 degrees west. That’s about 505 miles (810 km) east-southeast of Bermuda. Leslie is nearly stationary, and little motion is expected today. A northward motion is forecast to begin tonight, and this motion should continue through Friday night. Maximum sustained winds have increased to near 75 mph (120 kph) with higher gusts. Some additional strengthening is forecast during the next day or so.
NHC noted “The hurricane is forecast to remain within favorable environmental conditions consisting of warm water and low vertical wind shear over the next day or two. These conditions should allow for some additional strengthening.”
Oct. 02, 2018 – NASA Eyes Powerful Super Typhoon Kong-Rey
NASA’s Aqua satellite provided an infrared view of Super Typhoon Kong-Rey as it continued tracking through the Northwestern Pacific Ocean. Another Super typhoon, Trami, passed through the same area one week ago and cooler waters it left in its wake are expected to affect Kong-Rey.
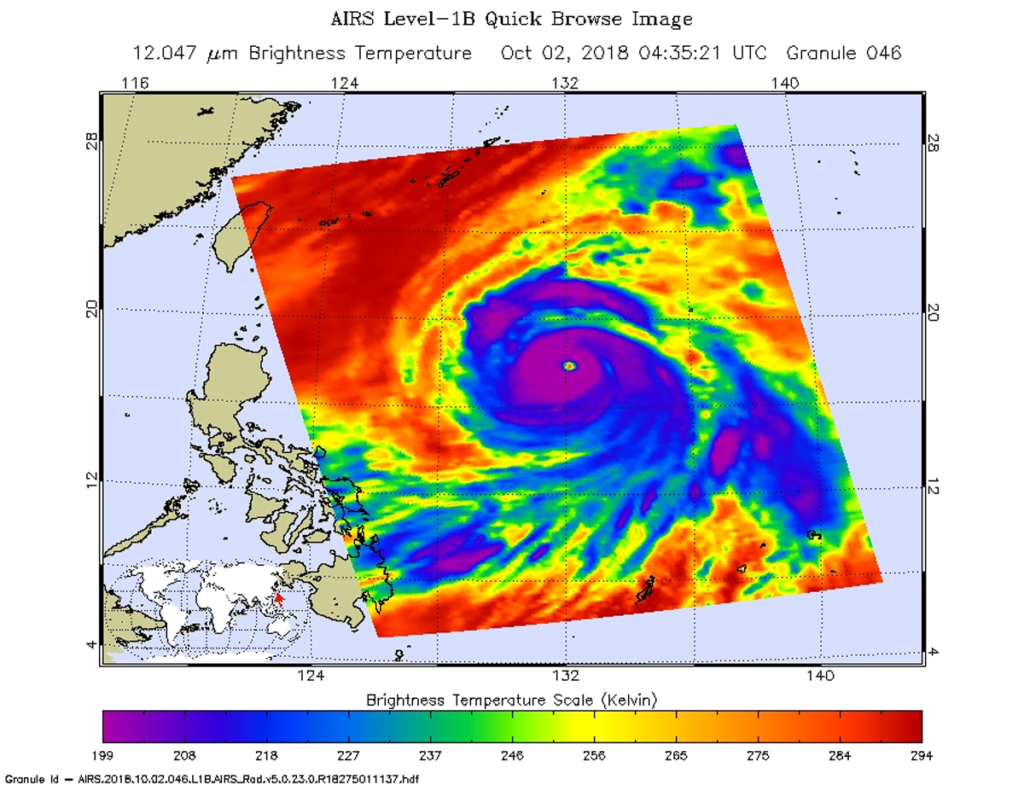
NASA’s Aqua satellite passed over Super Typhoon Kong-Rey on Oct. 2 at 12:35 a.m. EDT (0435 UTC) and analyzed it in infrared light. Powerful storms circled a clear eye (purple). Credit: NASA JPL, Heidar Thrastarson
NASA’s Aqua satellite passed over Super Typhoon Kong-Rey on Oct. 2 at 12:35 a.m. EDT (0435 UTC) and the Atmospheric Infrared Sounder or AIRS instrument aboard analyzed cloud top temperatures in infrared light. Coldest cloud top temperatures were being pushed northeast of center and were as cold as or colder than 208 Kelvin (minus 85.2 degrees Fahrenheit/minus 65.1 Celsius). Cloud top temperatures that cold indicate strong storms that have the capability to create heavy rain.
The Joint Typhoon Warning Center noted at 11 a.m. EDT (1500 UTC), “Animated enhanced infrared satellite imagery shows Kong-Rey has maintained a well-defined eye with deep convection wrapping around it. However, the deep convection [strong development of thunderstorms] has become slightly less symmetric over the past several hours, especially in the northeast quadrant.
The center of Super Typhoon Kong-Rey was located near latitude 19.2 degrees north and longitude 130.9 degrees east. Kong-Rey is currently about 493 nautical miles south-southeast of Kadena Air Base, Okinawa Island, Japan. Kong-Rey is moving toward the northwest. Maximum sustained winds have decreased to near 155 mph (250 kph/135 knots).
Kong-Rey will continue to encounter cooler sea surface temperatures by Oct. 3 which are a result of upwelling (bringing cooler water from the ocean bottom to the surface) produced by Super Typhoon Trami which passed through the area several days ago.
Oct. 02, 2018 – NASA Sees a Lot of Strength in Infrared View of Cat 4 Hurricane Walaka
Infrared satellite imagery provides temperature data, and when NASA’s Aqua satellite passed over the Central Pacific Ocean, it analyzed Hurricane Walaka. Walaka is a Category 4 Hurricane on the Saffir-Simpson Hurricane Wind Scale.
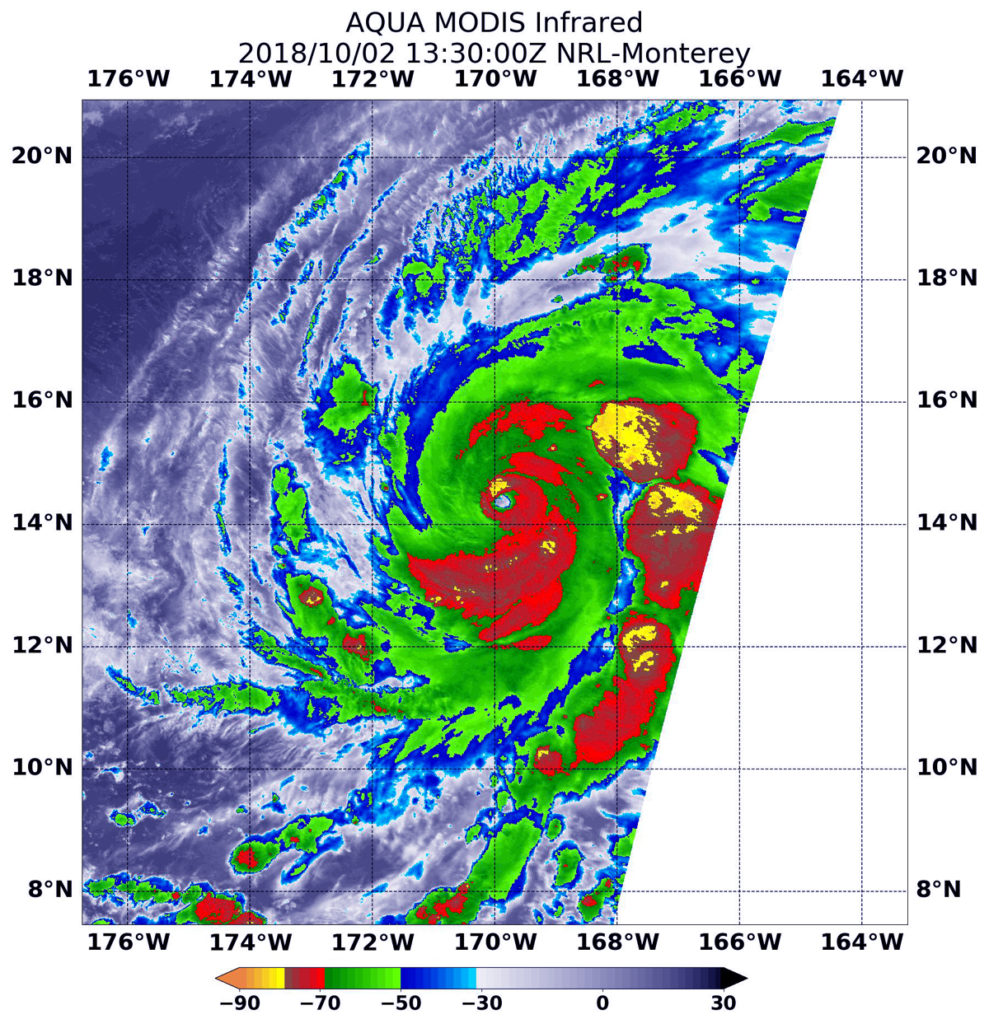
On Oct. 2 at 9:30 a.m. EDT (1330 UTC) NASA’s Aqua satellite revealed cloud top temperatures in strongest storms around Walaka’s center and in a fragmented band of thunderstorms east of the center of circulation. Those temperatures were as cold as or colder than minus 70 degrees (red) Fahrenheit (minus 56.6 degrees Celsius). Credit: NASA/NRL
Cloud top temperatures determine strength of the thunderstorms that make up a tropical cyclone. The colder the cloud top, the stronger the uplift in the storm that helps thunderstorm development. Basically, infrared data helps determine where the most powerful storms are within a tropical cyclone.
The Moderate Resolution Imaging Spectroradiometer or MODIS instrument aboard Aqua provided that infrared data on Oct. 2 at 9:30 a.m. EDT (1330 UTC) MODIS data showed cloud top temperatures in strongest storms around Walaka’s center and in a fragmented band of thunderstorms east of the center of circulation. They were as cold as or colder than minus 70 degrees Fahrenheit (minus 56.6 degrees Celsius). NASA research indicates very cold cloud tops with the potential to generate very heavy rainfall.
On Oct. 2, a Hurricane Warning was in effect for the Johnston Atoll and a Hurricane Watch is in effect for Papahanaumokuakea Marine National Monument from Nihoa to French Frigate Shoals to Maro Reef.
At 5 a.m. HST/11 a.m. EDT/1500 UTC, the center of Hurricane Walaka was located near latitude 14.7 degrees north and longitude 170.0 degrees west. Walaka is moving toward the north near 10 mph (17 kph). This general motion is expected to continue through Wednesday night with a steady increase in forward speed. On the forecast track, the center of Walaka is expected to pass just to the west of Johnston later today.
NOAA’s Central Pacific Hurricane Center noted “Maximum sustained winds are near 155 mph (250 kph) with higher gusts. Walaka is a category 4 hurricane on the Saffir-Simpson Hurricane Wind Scale. Little change in intensity is expected through tonight, with rapid weakening expected Wednesday and Wednesday night.”
Oct. 02, 2018 – NASA Soaks Up Tropical Storm Leslie’s Water Vapor Concentration
When NASA’s Aqua satellite passed over the Central Atlantic Ocean on Oct. 2 the MODIS instrument aboard analyzed water vapor within Tropical Storm Leslie.
NASA’s Aqua satellite passed over Tropical Storm Leslie in the Central Atlantic Ocean on Oct. 2 at 1:15 a.m. EDT (0515 UTC). The MODIS instrument showed highest concentrations of water vapor (brown) and coldest cloud top temperatures circled the center with a gap in the north-northeastern quadrant. Credits: NASA/NRL
Water vapor analysis of tropical cyclones tells forecasters how much potential a storm has to develop. Water vapor releases latent heat as it condenses into liquid. That liquid becomes clouds and thunderstorms that make up a tropical cyclone. Temperature is important when trying to understand how strong storms can be. The higher the cloud tops, the colder and the stronger they are.
NASA’s Aqua satellite passed over Tropical Storm Leslie in the Central Atlantic Ocean on Oct. 2 at 1:15 a.m. EDT (0515 UTC) and the Moderate Resolution Imaging Spectroradiometer or MODIS instrument gathered water vapor content and temperature information. The storm continues to have a ragged banded eye.
The MODIS image showed highest concentrations of water vapor and coldest cloud top temperatures circled the center with the exception of the north-northeastern quadrant. MODIS saw coldest cloud top temperatures were as cold as minus 70 degrees Fahrenheit (minus 56.6 degrees Celsius) in those areas. Storms with cloud top temperatures that cold have the capability to produce heavy rainfall.
Leslie remains far enough from land areas so that there are no warnings or watches in effect. At 11 a.m. EDT (1500 UTC), the center of Tropical Storm Leslie was located near latitude 30.9 degrees north and longitude 56.1 degrees west. That’s 520 miles (840 km) east of Bermuda. Leslie is moving toward the southwest near 8 mph (13 kph). Maximum sustained winds remain near 65 mph (100 kph) with higher gusts.
The National Hurricane Center or NHC forecast noted “Gradual strengthening is expected during the next day or two, and Leslie is forecast to become a hurricane tonight or on Wednesday, Oct. 3.”
Peaking as a category 4 hurricane on September 28, 2018, over the Eastern Pacific Ocean, Hurricane Rosa weakened before making landfall on the Baja California Peninsula four days later. Still, as the storm’s remnants moved inland, they delivered heavy rain and caused flash floods in northwestern Mexico and the U.S. Southwest.
“We can draw parallels between this storm and Hurricane Florence,” said Gary Partyka, an atmospheric scientist with the GMAO at NASA’s Goddard Space Flight Center. “The strength of both weakened tremendously, but both moved enough moisture to produce substantial amounts of rainfall. A hurricane’s category (which describes its maximum winds) is not very important when it comes to flooding.”
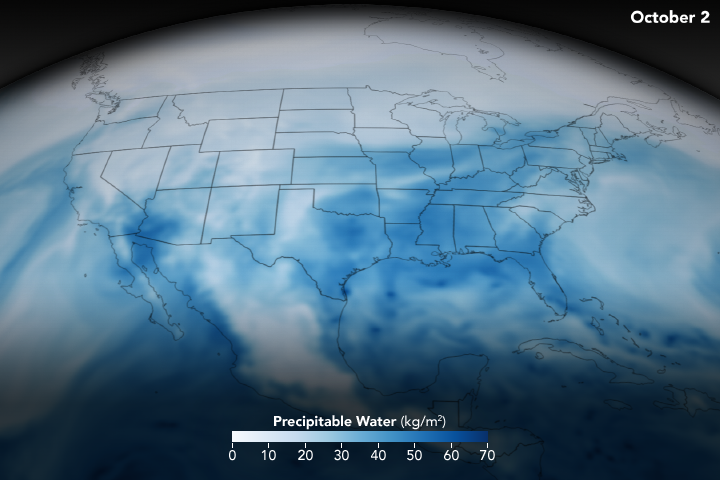
The still image and animation above show the atmosphere’s total precipitable water. That is, the depth of water in a column of the atmosphere if all the water in that column fell as rain. The image and animation, compiled from October 1-3, 2018, were created with data from a version of a NASA model known as the Goddard Earth Observing System Data Assimilation System (GEOS DAS), which uses satellite data and mathematical representations of physical processes to calculate what was happening in the atmosphere.
Viewed globally, the model shows large circulation patterns as well as individual storms. This regional view shows Hurricane Rosa as it spun over the East Pacific Ocean and broke up over Baja California and the U.S. Southwest. Dark blue areas represent the highest values of precipitable water.
Partyka says it is important to note that not all precipitable water falls as rain; some water vapor stays behind in the atmosphere. Nor is it a limit on the amount of rain that can fall, which can increase as water vapor moves into the column of air.
“The indicator is useful for showing potential regions where rainfall could be excessive, though you also need a trigger to make the ‘precipitable water’ fall as precipitation,” Partyka said. In this case, Rosa’s remnants and a low-pressure system off the California coast did serve as triggers.
According to the National Weather Service, October 2 was the wettest October day on record in Phoenix, Arizona. More than 2 inches (5 centimeters) of rainfall were measured that day at Phoenix Sky Harbor International. The last time the city saw more than two inches in a day in October was in 1988.
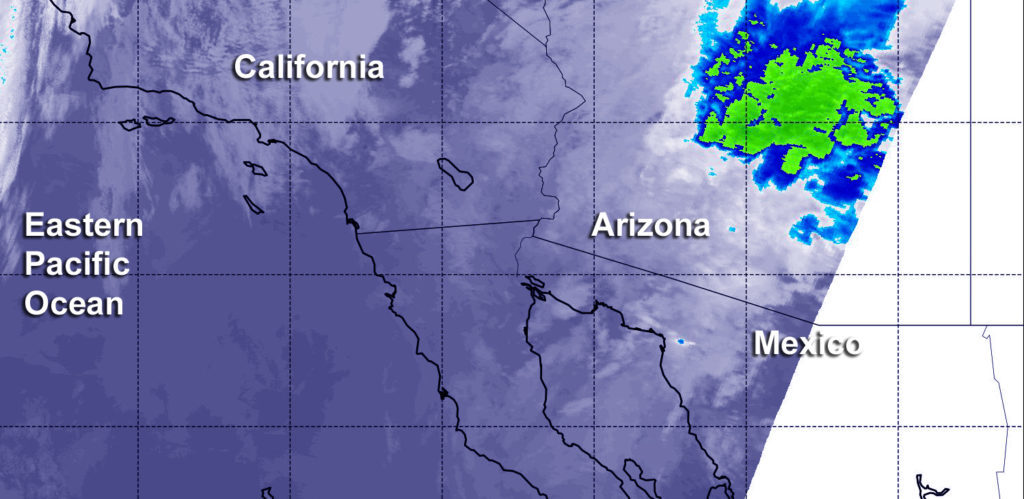
NASA provided an infrared view of Tropical Depression Rosa’s remnants that showed strongest storms with heaviest rainfall potential were over east central Arizona on Oct. 2. The National Hurricane Center noted that although Rosa had dissipated by 11 a.m. EDT on Oct. 2, the threat of heavy rains and flash flooding continues over the Desert Southwest.
On Tuesday, Oct. 2 at 6:05 a.m. EDT (1005 UTC), the MODIS instrument aboard NASA’s Aqua satellite looked at the remnants of tropical depression Rosa in infrared light revealing the storm soaking Arizona. MODIS found coldest cloud tops (yellow) had temperatures near minus 63 degrees Fahrenheit (minus 53 degrees Celsius) which indicated powerful rain-making storms. Credit: NASA/NRL
NOAA’s National Weather Service Weather Prediction Center in College Park, Md. noted “Heavy tropical rain from Rosa will bring flash flood threats to the Desert Southwest and Four Corners region over the next couple of days. Flood Watches are in effect for multiple states, including California, Arizona, Nevada, Utah, Colorado and Idaho. There is also a moderate risk of excessive rain for central portions of Arizona.”
Infrared satellite data captured on Tuesday, Oct. 2 at 6:05 a.m. EDT (1005 UTC the Moderate Resolution Imaging Spectroradiometer or MODIS instrument aboard NASA’s Aqua satellite revealed the location of strongest storms with the coldest cloud top temperatures. MODIS found coldest cloud tops had temperatures near minus 63 degrees Fahrenheit (minus 53 degrees Celsius). NASA research has found that cloud top temperatures that cold have the capability to generate heavy rainfall.
Satellite images and surface observations indicate that Rosa has become a trough or an elongated area of low pressure with multiple swirls along its axis. Therefore, Rosa no longer qualifies as a tropical cyclone.
That heavy rainfall potential that NASA’s infrared data showed are reflected in the forecast today, Oct. 2 and tomorrow, Oct. 3. In Baja California and northwestern Sonora, 3 to 6 inches are forecast with isolated 10 inches. In central and southern Arizona 2 to 4 inches are forecast with isolated 6 inch totals are possible in the mountains of central Arizona. For the rest of the Desert Southwest, Central Rockies, and Great Basin, the National Hurricane Center forecast expects between 1 to 2 inches, with isolated totals to 4 inches. These rainfall amounts may produce life-threatening flash flooding. Dangerous debris flows and landslides are also possible in mountainous terrain.
At 11 a.m. EDT (1500 UTC), the remnants of Rosa were located near latitude 29.7 degrees north and longitude 114.2 degrees west. That’s about 95 miles (155 km) south-southeast of San Felipe, Mexico. The remnants are moving toward the northeast near 8 mph (13 kph), and they are expected to move over the Desert Southwest by tonight. Maximum sustained winds are near 30 mph (45 kph) with higher gusts.
Oct. 02, 2018 – NASA Finds Tropical Storm Sergio on the Verge of Hurricane Status
The National Hurricane Center noted that Tropical Storm Sergio was on the verge of becoming a hurricane in the Eastern Pacific Ocean and NASA’s Aqua satellite confirmed very powerful storms within.
Infrared satellite data captured at 5:30 a.m. EDT (0930 UTC) on Oct. 1 from NASA’s Aqua satellite revealed strongest storms with the coldest cloud top temperatures west of Sergio’s center and in a band of thunderstorms southwest of the center. MODIS found coldest cloud tops had temperatures near minus 70 degrees Fahrenheit (minus 56.6 degrees Celsius). Credit: NASA/NRL
Infrared satellite data captured at 5:30 a.m. EDT (0930 UTC) on Oct. 1 from the Moderate Resolution Imaging Spectroradiometer or MODIS instrument aboard NASA’s Aqua satellite revealed strongest storms with the coldest cloud top temperatures west of Sergio’s center and in a band of thunderstorms southwest of the center. MODIS found coldest cloud tops had temperatures near minus 70 degrees Fahrenheit (minus 56.6 degrees Celsius). NASA research has found that cloud top temperatures that cold have the capability to generate heavy rainfall.
At 11 a.m. EDT, the National Hurricane Center or NHC noted “Sergio is almost a hurricane. Satellite images indicate that the central convection has been increasing in intensity during the past several hours, but there are still no indications of an eye in that data. Microwave imagery does show an eye feature, however. The outer bands are not particularly well organized, and there are some dry slots beyond the inner core.”
The center of Tropical Storm Sergio was located near latitude 11.5 degrees north and longitude 109.5 degrees west. Sergio is far from land, so there are no coastal advisories in effect. It is about 625 miles (1,000 km) southwest of Manzanillo, Mexico. Sergio is moving toward the west near 14 mph (22 kph), and this general motion is forecast to continue through tonight. A turn toward the west-northwest is expected on Tuesday. Maximum sustained winds remain near 70 mph (110 kph) with higher gusts.
NHC noted that “Strengthening is expected during the next 48 hours, and Sergio is forecast to become a hurricane later today, and a major hurricane by Wednesday, Oct. 3.”
Oct. 01, 2018 – Typhoon Kong-rey Moving through Northwestern Pacific
At 11 am EDT (1500 UTC) on Oct 1 , Kong-rey was located near 16.8 north and 134.4 east, about 488 miles north-northwest of Yap. It was moving to the northwest and had maximum sustained winds near 125 knots gusting to 150 knots. Currently the only threatened landmasses are the Ryuku Islands.
Satellites captured this worldview image of Typhoon Kong-rey on September 30, 2018. Courtesy: NASA Worldview, Earth Observing System Data and Information System (EOSDIS).
This satellite image was taken on September 30, 2018 by NASA’s Earth Observing System Data and Information System (EOSDIS) Worldview application which provides the capability to interactively browse over 700 global, full-resolution satellite imagery layers and then download the underlying data. Many of the available imagery layers are updated within three hours of observation, essentially showing the entire Earth as it looks “right now. ”
Kong-rey will move northwest, intensifying steadily. The storm will peak at 135 knots later today, after which it will steadily weaken. The system will gradually veer north, into the Yellow Sea after three days.