Walaki (Central Pacific Ocean)

Oct. 01, 2018 – NASA Sees Walaka Becoming a Powerful Hurricane

The Global Precipitation Measurement mission or GPM core satellite passed over the Central Pacific Hurricane Center and analyzed Walaka’s rainfall and cloud structure as it was strengthening into a hurricane.

GPM image of Walaka
On Sept. 30, GPM data revealed intense convective storms in a large feeder band wrapping around the Tropical Storm Wakala’s northeastern side where rain was falling at a rate of almost 6.5 inches (165 mm) per hour in the intense storms in the feeder band northeast of Walaka’s center of circulation. . A tall convective storm was located in a line northwest of Walaka’s center. It was found by DPR to reach heights above 8.5 miles (13.7 km). Credit; NASA/JAXA, Hal Pierce

Walaka formed southwest of the Hawaiian Islands on Saturday, Sept. 29. At 5 p.m. HST on Sunday, Sept. 30, Walaka strengthened to a hurricane.

The GPM core observatory recently had a couple good looks at tropical storm Walaka as it was intensifying into a powerful hurricane. GPM passed directly over tropical storm Walaka when it was located south of the Hawaiian islands on September 30, 2018 at 8:38  a.m. HST (1838 UTC).

On Sept. 30, GPM data revealed intense convective storms in a large feeder band wrapping around the Tropical Storm Wakala’s northeastern side  where rain was falling at a rate of almost 6.5 inches (165 mm) per hour in the intense storms in the feeder band northeast of Walaka’s center of circulation.  A tall convective storm was located in a line northwest of Walaka’s center. It was found by DPR to reach heights above 8.5 miles (13.7 km). Credit: NASA/JAXA, Hal Pierce

Data collected by GPM’s Microwave Imager (GMI) and Dual-Frequency Precipitation Radar (DPR) instruments showed that Walaka was well organized and very close to hurricane intensity. GPM’s Radar (DPR Ku Band) data revealed intense convective storms in a large feeder band that was wrapping around the tropical storm’s northeastern side and storms wrapping around a forming eye wall. GPM’s DPR found rain falling at a rate of almost 6.5 inches (165 mm) per hour in the intense storms in the feeder band northeast of Walaka’s center of circulation.

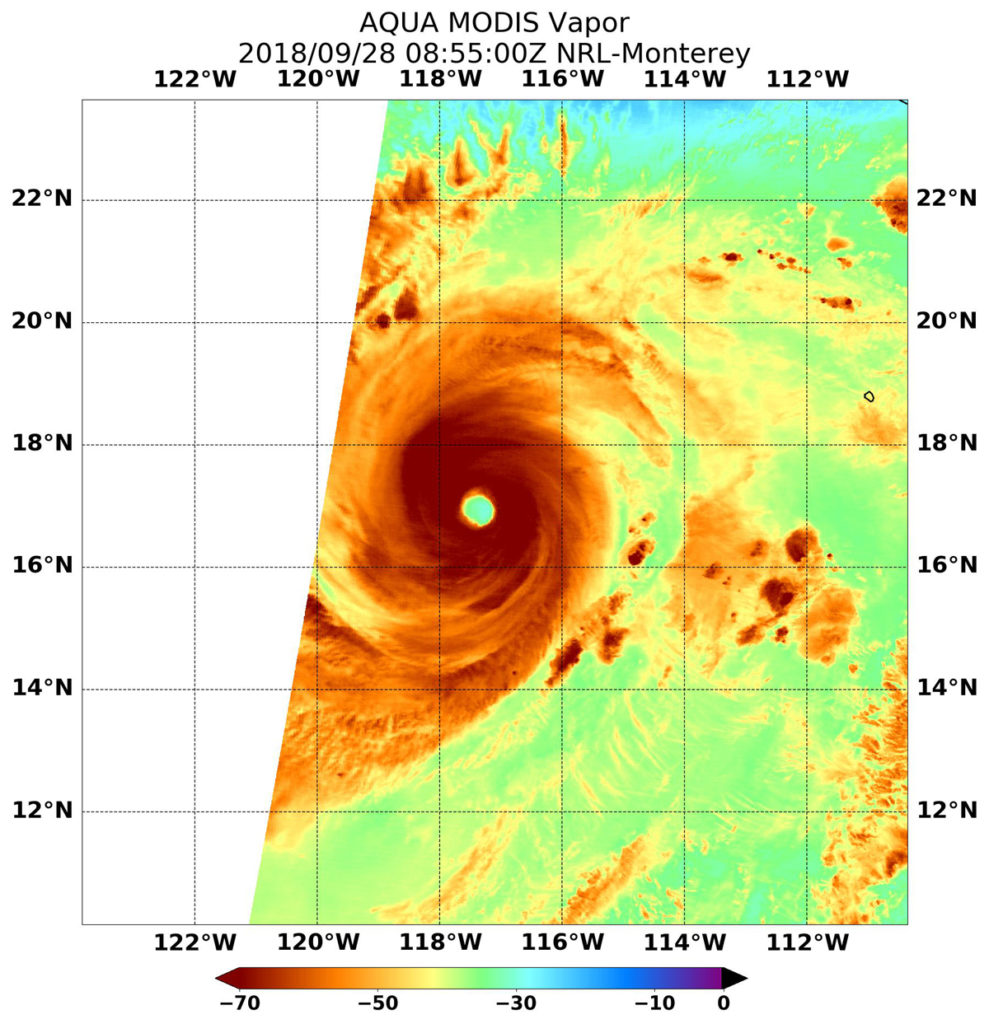
Walaka had strengthened to hurricane intensity when GPM flew above about twelve hours later at 8:07 p.m. HST (Oct. 1, 2018 at 0607 UTC). Walaka had developed an eye and was undergoing rapid intensification. The intensifying hurricane is passing well to the south of the Hawaiian Islands.

The GPM satellite’s   Dual-Frequency Precipitation Radar (DPR) data were used to show the structure of precipitation within intensifying tropical storm Walaka. The simulated 3D view of Walaka, looking from the southwest, showed storm tops of powerful storms wrapping into the center of the tropical storm. A tall convective storm was located in a line northwest of Walaka’s center. It was found by DPR to reach heights above 8.5 miles (13.7 km). GPM is a joint mission between NASA and the Japanese space agency JAXA.

On Monday, October 1, 2018, NOAA’s Central Pacific Hurricane Center or CPHC noted that a Hurricane Warning is in effect for Johnston Atoll. Also, interests in the Papahanaumokuakea Marine National Monument should monitor the progress of Walaka.

At 5 p.m. HST/11 p.m. EDT (0300 UTC, Oct. 1) on Sept. 30 or , the center of Hurricane Walaka was located near latitude 11.9 degrees north and longitude 166.4 degrees west. Walaka is moving toward the west near 12 mph (19 kph) and this motion is expected to slow and become northwest on Monday, then north on Tuesday. Maximum sustained winds are near 75 mph (120 kph) with higher gusts. Rapid intensification is forecast through Tuesday.

The Joint Typhoon Warning Center (JTWC) predicts that Hurricane Walaka will continue to strengthen and re-curve to the north later today. Walaka is expected to be a powerful category four hurricane on the Saffir-Simpson wind scale when it passes just to the west of Johnson Atoll in a couple days. Walaka is not expected to have a significant effect on the Hawaiian Islands.

By Hal Pierce / Rob Gutro
NASA’s Goddard Space Flight Center

Trami (Northwestern Pacific Ocean)

Oct. 01, 2018 – Satellite Sees Extra-Tropical Cyclone Trami Moving Past Japan

NOAA’s NOAA-20 satellite captured a visible image of Typhoon Trami on Oct. 1 after it had become extra-tropical and moved away from Japan.

JPSS VIIRS image of Trami
On Oct. 1 at 11:54 p.m. EDT (Sept. 30 at 0354 UTC) the VIIRS instrument aboard NOAA’s NOAA-20 polar orbiting satellite provided a visible image of Trami. The imagery showed the storm’s circulation had eroded quickly and was being blown apart by winds. On Oct. 1, Trami passed Hokkaido and had become extra-tropical. Credit: NOAA/NRL

At 11 a.m. EDT (1500 UTC) on Sunday, Sept. 30, the Joint Typhoon Warning Center issued the final advisory on the system. At that time, Typhoon Trami was located about 157 miles west-southwest of Camp Fuji, Japan and moving northeast at 28 knots (32 mph/52 kph). Maximum sustained winds were near 75 knots (86 mph/139 kph). Trami was weakening rapidly and becoming extra-tropical as it tracked very rapidly over Honshu.

On Oct. 1 at 11:54 p.m. EDT (Sept. 30 at 0354 UTC) the VIIRS instrument aboard NOAA’s NOAA-20 polar orbiting satellite provided a visible image of Trami. The imagery showed the storm’s circulation had eroded quickly and was being blown apart by winds. By Oct. 1, Trami passed Hokkaido and had become extra-tropical.

For updates from the Japan Meteorological Agency, visit: http://www.jma.go.jp/en/typh/

By Rob Gutro
NASA’s Goddard Space Flight Center

Rosa (Eastern Pacific Ocean)

Oct. 01, 2018 – NASA’s Infrared Vision Reveals Rosa’s Extent into the U.S. Southwest

Hurricane Rosa continued weakening as NASA’s Aqua satellite passed overhead and collected temperature information. Satellite data showed that Rosa’s center still off-shore from northwestern Mexico, but its clouds and rains had already stretched into Arizona and infrared data showed that rainfall potential.

AIRS image of Rosa
NASA’s Aqua satellite provided an infrared picture of Tropical Storm Rosa’s cloud top temperatures from Oct. 1 at 5:23 a.m. EDT (0923 UTC). Rosa’s center was still off-shore from northwestern Mexico, but its clouds and rains had already stretched into Arizona and infrared data showed that rainfall potential. Credit: NASA JPL, Heidar Thrastarson

National Hurricane Center (NHC) said a Tropical Storm Warning is in effect for the west coast of the Baja California peninsula from Punta Abreojos to Cabo San Quintin. A Tropical Storm Watch is in effect for the east coast of the Baja California peninsula from Bahia de los Angeles to San Felipe. Interests elsewhere in the northern and central Baja California peninsula and northwestern Sonora should monitor the progress of Rosa.

The Atmospheric Infrared Sounder or AIRS instrument aboard NASA’s Aqua satellite passed over Tropical Storm Rosa on Oct. 1 at 5:23 a.m. EDT (0923 UTC). and analyzed the storm in infrared light. Infrared light provides temperature data and that’s important when trying to understand how strong storms can be. The higher the cloud tops, the colder and the stronger they are.

When Aqua passed over Rosa, the AIRS instrument found coldest cloud top temperatures in thunderstorms mostly northeast the center where temperatures were as cold as minus 63 degrees Fahrenheit (minus 53 degrees Celsius). Those storms were stretching over northwestern Mexico and into Arizona. Storms with cloud top temperatures that cold have the capability to produce heavy rainfall.

At 11 a.m. EDT (1500 UTC), NHC noted the center of Tropical Storm Rosa was located near latitude 27.5 degrees west and longitude 116.5 degrees west. That’s 90 miles (140 km) west-southwest of Punta Eugenia, Mexico. Rosa is moving toward the north-northeast near 12 mph (19 km/h), and this general motion is expected to continue through Tuesday, Oct. 2. Maximum sustained winds are near 45 mph (75 kph) with higher gusts. Some weakening is forecast during the next 48 hours.  Weakening is forecast through tonight while Rosa approaches and moves over the northern Baja California peninsula.

On the forecast track, the center of Rosa will approach the central and northern Baja California peninsula later today, Oct. 1 and then move across the peninsula into the northern Gulf of California tonight.  Rosa’s remnants are then expected to move across the Desert Southwest on Tuesday, Oct. 2. Rosa is expected to become a remnant low over the southwestern United States on Tuesday.

For updated forecasts on Rosa, visit: www.nhc.noaa.gov.

For local forecasts and impacts in the U.S., visit: www.weather.gov.

By Rob Gutro
NASA’s Goddard Space Flight Center

Sergio (Eastern Pacific Ocean)

Oct. 01, 2018 – NASA Finds Tropical Storm Sergio on the Verge of Hurricane Status

The National Hurricane Center noted that Tropical Storm Sergio was on the verge of becoming a hurricane in the Eastern Pacific Ocean and NASA’s Aqua satellite confirmed very powerful storms within.

Aqua image of Sergio
Infrared satellite data captured at 5:30 a.m. EDT (0930 UTC) on Oct. 1 from NASA’s Aqua satellite revealed strongest storms with the coldest cloud top temperatures west of Sergio’s center and in a band of thunderstorms southwest of the center. MODIS found coldest cloud tops had temperatures near minus 70 degrees Fahrenheit (minus 56.6 degrees Celsius). Credit: NASA/NRL

Infrared satellite data captured at 5:30 a.m. EDT (0930 UTC) on Oct. 1 from the Moderate Resolution Imaging Spectroradiometer or MODIS instrument aboard NASA’s Aqua satellite revealed strongest storms with the coldest cloud top temperatures west of Sergio’s center and in a band of thunderstorms southwest of the center.  MODIS found coldest cloud tops had temperatures near minus 70 degrees Fahrenheit (minus 56.6 degrees Celsius). NASA research has found that cloud top temperatures that cold have the capability to generate heavy rainfall.

At 11 a.m. EDT, the National Hurricane Center or NHC noted, “Sergio is almost a hurricane. Satellite images indicate that the central convection has been increasing in intensity during the past several hours, but there are still no indications of an eye in that data.  Microwave imagery does show an eye feature, however. The outer bands are not particularly well organized, and there are some dry slots beyond the inner core.”

The center of Tropical Storm Sergio was located near latitude 11.5 degrees north and longitude 109.5 degrees west.  Sergio is far from land, so there are no coastal advisories in effect. It is about 625 miles (1,000 km) southwest of Manzanillo, Mexico. Sergio is moving toward the west near 14 mph (22 kph), and this general motion is forecast to continue through tonight.  A turn toward the west-northwest is expected on Tuesday. Maximum sustained winds remain near 70 mph (110 kph) with higher gusts.

NHC noted that “Strengthening is expected during the next 48 hours, and Sergio is forecast to become a hurricane later today, and a major hurricane by Wednesday, Oct. 3.”

For updated forecasts, visit: www.nhc.noaa.gov

By Rob Gutro (with information from the NHC)
NASA Goddard Space Flight Center

Leslie (North Atlantic Ocean)

Oct. 01, 2018 – NASA Finds Bulk of Tropical Storm Leslie’s Storms Northwest of Center

Infrared imagery from NASA’s Aqua satellite showed the location of the strongest storms in reborn Tropical Storm Leslie is it moved through the Central North Atlantic Ocean.

Aqua image of Leslie
Infrared satellite data at 2:10 a.m. EDT (0610 UTC) on Oct. 1 from NASA’s Aqua satellite revealed strongest storms with the coldest cloud top temperatures (yellow) were northwest of Leslie’s center. MODIS found coldest cloud tops had temperatures near minus 63 degrees Fahrenheit (minus 53 degrees Celsius). Credit: NASA/NRL

Subtropical Storm Leslie formed in the Central North Atlantic Ocean on Sept. 23. It faded out on Sept. 25 but was reborn as a Subtropical storm on Sept. 28. Since then, it has transitioned into a warm-core, tropical storm.

Infrared satellite data captured at 2:10 a.m. EDT (0610 UTC) on Oct. 1 from the Moderate Resolution Imaging Spectroradiometer or MODIS instrument aboard NASA’s Aqua satellite revealed strongest storms with the coldest cloud top temperatures northwest of Leslie’s center.  MODIS found coldest cloud tops had temperatures near minus 63 degrees Fahrenheit (minus 53 degrees Celsius). NASA research has found that cloud top temperatures that cold have the capability to generate heavy rainfall.

At 11 a.m. EDT, the National Hurricane Center or NHC noted, “Leslie is gradually becoming better organized.  A large band of deep convection exists on the west side of the circulation and some fragmented bands are beginning to form on the east side.  Overall, Leslie appears more symmetric than it has been during the past couple of days due to a decrease in wind shear.”

At 11 a.m. (1500 UTC), on Oct. 1 the center of Tropical Storm Leslie was located near latitude 33.2 degrees north and longitude 54.3 degrees west. That’s about 615 miles (85 km) east of Bermuda. Leslie is moving toward the west-southwest near 5 mph (7 kph).  A slow southwestward or southward motion is forecast during the next few days. Maximum sustained winds are near 60 mph (95 km/h) with higher gusts.

The National Hurricane Center said, “Gradual strengthening is expected during the next 48 hours, and Leslie is forecast to become a hurricane on Tuesday (Oct. 2).”

For updated forecasts, visit: www.nhc.noaa.gov

By Rob Gutro (with information from the NHC)
NASA Goddard Space Flight Center

Trami (Northwestern Pacific Ocean)

Sep. 28, 2018 – NASA Finds Trami an Organized, Wide-Eyed Typhoon

Visible imagery from NASA’s Aqua satellite revealed Typhoon Trami was symmetrical and had a large eye on its approach to Japan’s southern islands.

Aqua image of Trami
At 1:05 a.m. EDT (0505 UTC) on Sept. 28, the MODIS instrument aboard NASA’s Aqua satellite provided a visible image of Typhoon Trami that revealed a clear eye and a powerful storm. Credit: NASA/NRL

At 1:05 a.m. EDT (0505 UTC) on Sept. 28 the Moderate Resolution Imaging Spectroradiometer or MODIS instrument aboard NASA’s Aqua satellite provided a visible image of Typhoon Trami in the Northwestern Pacific Ocean. The image showed the northwestern edge of Trami beginning to affect the Ryukyu Arc, a chain of Japanese islands that stretch southwest from Kyushu to Taiwan. Infrared satellite imagery shows Trami continues to have a wide eye with convection around the eye beginning to re-intensify.

On Sept. 28, the Joint Typhoon Warning Center or JTWC noted that Trami had maximum sustained winds near 90 knots (103.6 mph/166.7 kph). It was centered near 24.2 degrees north latitude and 127.0 degrees east longitude. That’s 168 nautical miles south-southwest of Kadena Air Base, Okinawa, Japan. Trami was moving north-northwest and is forecast to turn to the north-northeast.

JTWC has forecast the eye of Trami to pass just to the west of Okinawa Island, Japan and Omami Oshima Island as it moves in a north-northeasterly direction.

For warnings and watches from the Japan Meteorological Agency, visit: http://www.jma.go.jp/en/typh/.

By Rob Gutro
NASA’s Goddard Space Flight Center

Kirk (Atlantic Ocean)

Sep. 28, 2018 – NASA Looks at Tropical Storm Kirk’s Caribbean Rainfall

Tropical Storm Kirk just passed through the Leeward Islands and when the GPM satellite passed overhead, it revealed that Kirk continued to bring rain to the chain on Sept. 28.

GPM image of Kirk
The GPM core satellite passed over Tropical Storm Kirk at 8:36 a.m. EDT (1236 UTC) on Friday, Sept. 28, 2018. GPM found the heaviest rainfall (pink) was around the center of circulation located west of the Leeward Islands. There, rain was falling at a rate of 100 mm (about 4 inches) per hour. Rain extended east of the center over the island chain where rain was falling (yellow, blue) between 10 and 40 mm (0.4 and 1.5 inches) per hour. Credit: NASA/JAXA/NRL

The Global Precipitation Measurement mission or GPM core satellite passed over Tropical Storm Kirk at 8:36 a.m. EDT (1236 UTC) on Friday, Sept. 28, 2018. GPM found the heaviest rainfall was around the center of circulation located west of the Leeward Islands. There, rain was falling at a rate of 100 mm (about 4 inches) per hour.

Rain extended east of the center over the island chain where rain was falling between 10 and 40 mm (0.4 and 1.5 inches) per hour. GPM is a joint mission between NASA and the Japan Aerospace Exploration Agency, JAXA.

Those rains are expected to continue affecting the islands over the next day. The National Hurricane Center said “Kirk is expected to produce total rainfall of 4 to 6 inches across the northern Windward and southern Leeward Islands with isolated maximum totals up to 10 inches across Martinique and Dominica.  These rains may produce life-threatening flash floods and mudslides. Across Saint Croix and eastern Puerto Rico, Kirk is expected to bring 2 to 4 inches with isolated maximum totals of 6 inches today and Saturday, Sept. 29.”

Meanwhile, the Meteorological Service of St. Lucia has discontinued the Tropical Storm Warning for St. Lucia, and the Meteorological Service of Barbados has discontinued the Tropical Storm Watch for St. Vincent and the Grenadines.

At 11 a.m. EDT (1500 UTC), the center of Tropical Storm Kirk was located near latitude 13.8 degrees north and longitude 63.6 degrees west. That’s about 185 miles (295 km) west-southwest of Martinique.

Kirk is moving toward the west-northwest near 13 mph (20 kph), and this motion is expected to continue through Sunday. On the forecast track, the center of Kirk or its remnants will move across the eastern and central Caribbean Sea over the next day or two. Reports from an Air Force Reserve Hurricane Hunter aircraft indicate that maximum sustained winds have decreased to near 45 mph (75 kph) with higher gusts.  Kirk is forecast to weaken to a tropical depression tonight, and then degenerate into a trough of low pressure on Saturday, Sept. 29.

For forecast updates on Kirk, visit: www.nhc.noaa.gov.

By Rob Gutro
NASA’s Goddard Space Flight Center

Liua (Southern Pacific Ocean)

Sep. 28, 2018 – NASA Identifies Wind Shear Tearing Apart Tropical Cyclone Liua

Visible imagery from NASA’s Aqua satellite revealed that strong wind shear was adversely affecting Tropical Cyclone Liua in the Southern Pacific Ocean.

Aqua image of Liua
On Sept. 28 at 0315 UTC (Sept. 27 at 11:15 p.m. EDT) MODIS instrument aboard NASA’s Aqua satellite provided a visible image of Tropical Depression Liua that showed the storm was being affected by vertical wind shear. Credit: NASA/NRL

On Sept. 28 at 0315 UTC (Sept. 27 at 11:15 p.m. EDT) the Moderate Resolution Imaging Spectroradiometer or MODIS instrument aboard NASA’s Aqua satellite provided a visible image of Tropical Cyclone Liua. Liua appeared as a swirl of clouds around its center with most of its clouds and thunderstorms pushed southeast of center. Strong westerly to northwesterly vertical wind shear were tearing the storm apart.

In general, wind shear is a measure of how the speed and direction of winds change with altitude. Tropical cyclones are like rotating cylinders of winds. Each level needs to be stacked on top each other vertically in order for the storm to maintain strength or intensify. Wind shear occurs when winds at different levels of the atmosphere push against the rotating cylinder of winds, weakening the rotation by pushing it apart at different levels.

 On Sept. 28, the Joint Typhoon Warning Center issued the final bulletin on Tropical Cyclone Liua. At that time, Liua was centered near 12.0 degrees south latitude and 161.1 degrees east longitude. That’s 540 miles northwest of Port Vila, Vanuatu. Liua was moving slowly to the west-northwest and had maximum sustained winds near 35 knots (40 mph/62 kph).

Liua is forecast to dissipate under adverse atmospheric conditions.

By Rob Gutro
NASA’s Goddard Space Flight Center


Rosa (Eastern Pacific Ocean)

Sep. 28, 2018 – NASA Looks at Major Hurricane Rosa’s Water Vapor Concentration

When NASA’s Aqua satellite passed over the Eastern Pacific Ocean, water vapor data provided information about the intensity of Hurricane Rosa. On Sept. 28, Rosa is a major hurricane, now a Category 4 on the Saffir-Simpson Hurricane Wind Scale.

Aqua image of Rosa
NASA’s Aqua satellite passed over Hurricane Rosa in the Eastern Pacific Ocean on Sept. 28 at 4:55 a.m. EDT (855 UTC) and highest concentrations of water vapor (brown) and coldest cloud top temperatures were around the center. Credits: NASA/NRL

NASA’s Aqua satellite passed Hurricane Rosa on Sept. 28 at 4:55 a.m. EDT (855 UTC) and the Moderate Resolution Imaging Spectroradiometer or MODIS instrument gathered water vapor content and temperature information. The MODIS image showed highest concentrations of water vapor and coldest cloud top temperatures were in a thick ring of storms around the 20 nautical mile-wide eye.

MODIS data also showed coldest cloud top temperatures were as cold as or colder than minus 70 degrees Fahrenheit (minus 56.6 degrees Celsius) in those storms. Storms with cloud top temperatures that cold have the capability to produce heavy rainfall.

AIRS image of Rosa
The Atmospheric Infrared Sounder instrument aboard NASA’s Aqua satellite provided temperature data on the cloud tops of Category 4 Hurricane Rosa on Sept. 27 at 4:41 p.m. EDT (2041 UTC). Coldest cloud top temperatures were as cold as or colder than minus 70 degrees Fahrenheit (minus 56.6 degrees Celsius) around the eye and confirmed the MODIS data. Credit: NASA/JPL, Heidar Thrastarson

Water vapor analysis of tropical cyclones tells forecasters how much potential a storm has to develop. Water vapor releases latent heat as it condenses into liquid. That liquid becomes clouds and thunderstorms that make up a tropical cyclone. Temperature is important when trying to understand how strong storms can be. The higher the cloud tops, the colder and the stronger they are.

Twelve hours before the MODIS water vapor imagery, the Atmospheric Infrared Sounder instrument aboard NASA’s Aqua satellite provided temperature data on the cloud tops on Sept. 27 at 4:41 p.m. EDT (2041 UTC). Coldest cloud top temperatures were as cold as or colder than minus 70 degrees Fahrenheit (minus 56.6 degrees Celsius) around the eye and confirmed the later MODIS data.

At 5 a.m. EDT (0900 UTC), the eye of Hurricane Rosa was located near latitude 16.9 degrees north and longitude 117.3 degrees west. That’s 640 miles (1,030 km) southwest of the southern tip of Baja California, Mexico. Rosa is moving toward the west near 7 mph (11 kph). A gradual turn toward the west-northwest and northwest is expected on Friday, followed by a turn toward the north Saturday night and a turn toward the north-northeast on Sunday.

Maximum sustained winds are near 145 mph (230 kph) with higher gusts.  Rosa is a category 4 hurricane on the Saffir-Simpson Hurricane Wind Scale.  Little significant change in strength is forecast today, with gradual weakening anticipated by Saturday, and further weakening at a faster rate expected early next week.

NHC said although Rosa is not near the coast, swells generated by Rosa will affect portions of the coasts of southwestern Mexico, the southern Baja California Peninsula, and southern California late this week and over the weekend.  These swells are likely to cause life-threatening surf and rip current conditions.

For updated forecasts, visit: www.nhc.noaa.gov

By Rob Gutro
NASA’s Goddard Space Flight Center

Liua (Southern Pacific Ocean)

Sep. 27, 2018 – NASA Satellite Analyzes New Southern Pacific Ocean Tropical Cyclone

NASA’s Aqua satellite provided an infrared look at a new storm that formed in the southern Pacific Ocean called Liua and saw strongest storms off-center.

Aqua image of Liua
At 11 a.m. EDT (1500 UTC) on Sept. 27, the MODIS instrument aboard NASA’s Aqua satellite looked at Tropical Storm Liua in infrared light. MODIS found two areas of coldest cloud top temperatures west and northeast of Liua’s center were as cold as or colder than minus 80 degrees (yellow) Fahrenheit (minus 112 degrees Celsius). Surrounding them were storms with cloud tops as cold as or colder than minus 70 degrees (red) Fahrenheit (minus 56.6 degrees Celsius). Credit: NASA/NRL

At 11 a.m. EDT (1500 UTC) on Sept. 27, the MODIS or Moderate Resolution Imaging Spectroradiometer instrument aboard NASA’s Aqua satellite looked at Tropical Storm Liua in infrared light. MODIS found two areas of coldest cloud top temperatures west and northeast of Liua’s center were as cold as or colder than minus 80 degrees Fahrenheit (minus 112 degrees Celsius). Those areas represented the strongest storms. Surrounding them were storms with cloud tops as cold as or colder than minus 70 degrees Fahrenheit (minus 56.6 degrees Celsius).

NASA research has found that cloud top temperatures as cold as or colder than the 70F/56.6C threshold have the capability to generate heavy rainfall.

At 11 a.m. EDT (1500 UTC), the center of Tropical Storm Liua was located near latitude 12.2 degrees south and longitude 162.5 degrees east. That’s about 471 miles northwest of Port Vila, Vanuatu. Liua was moving toward the south-southwest. Liua’s maximum sustained winds were near 40 mph (35 knots/62 kph) with higher gusts.

The Joint Typhoon Warning Center noted that the forecast takes Liua west over cooler sea surface temperatures and where outside winds will weaken the storm. Liua is forecast to dissipate by Sept. 29.

By Rob Gutro
NASA Goddard Space Flight Center