Ferdinand – Southern Indian Ocean

Feb. 26, 2020 – NASA Analyzes Tropical Cyclone Ferdinand’s Water Vapor Concentration 

When NASA’s Aqua satellite passed over the Southern Indian Ocean on Feb. 26, it gathered water vapor data that provided information about the intensity of Tropical Cyclone Ferdinand.

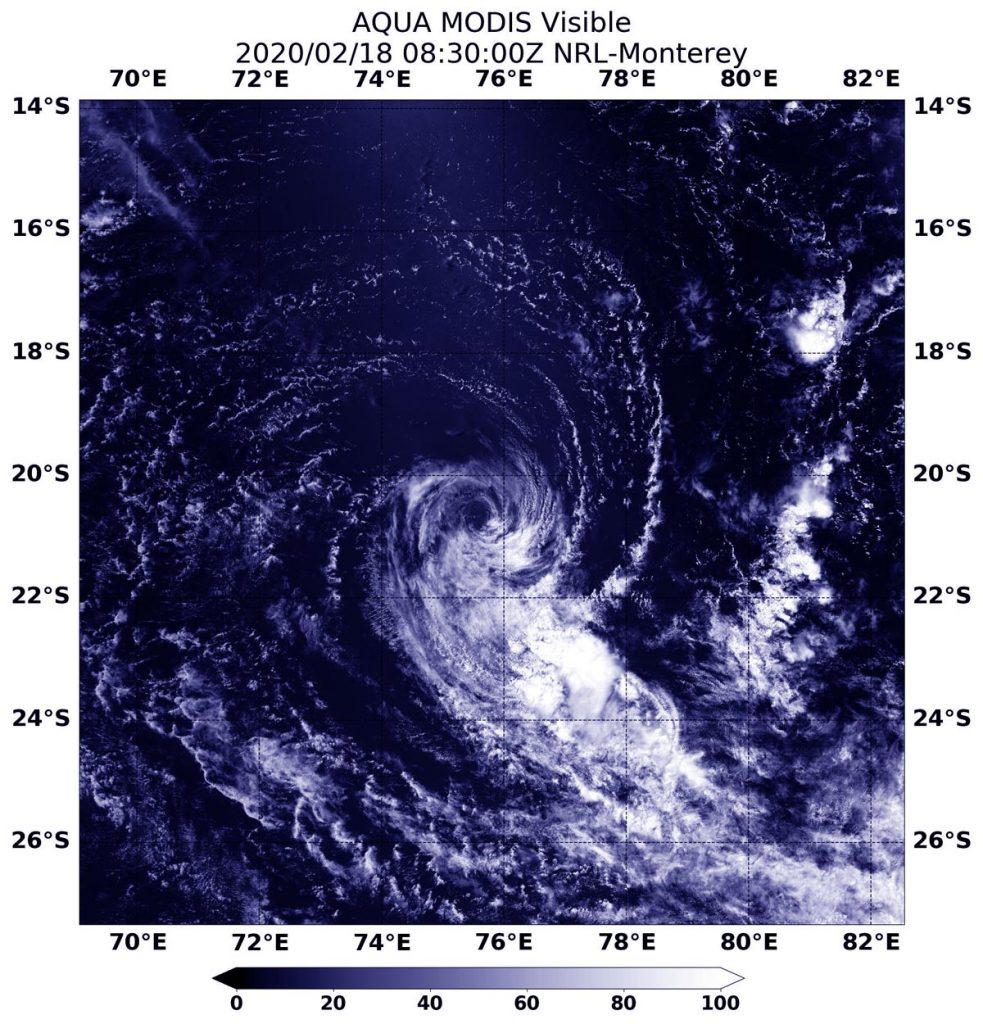
NASA’s Aqua satellite passed over Tropical Cyclone Ferdinand on Feb. 26 at 1:05 a.m. EST (0605 UTC),) and the Moderate Resolution Imaging Spectroradiometer or MODIS instrument gathered water vapor content and temperature information. The MODIS image showed highest concentrations of water vapor and coldest cloud top temperatures were around the center of circulation.

On Feb. 26 at 1:05 a.m. EST (0605 UTC), NASA’s Aqua satellite passed over Tropical Cyclone Ferdinand, located in the Southern Indian Ocean and off Australia’s Pilbara coast. Aqua found highest concentrations of water vapor (brown) and coldest cloud top temperatures were around the center. Credits: NASA/NRL

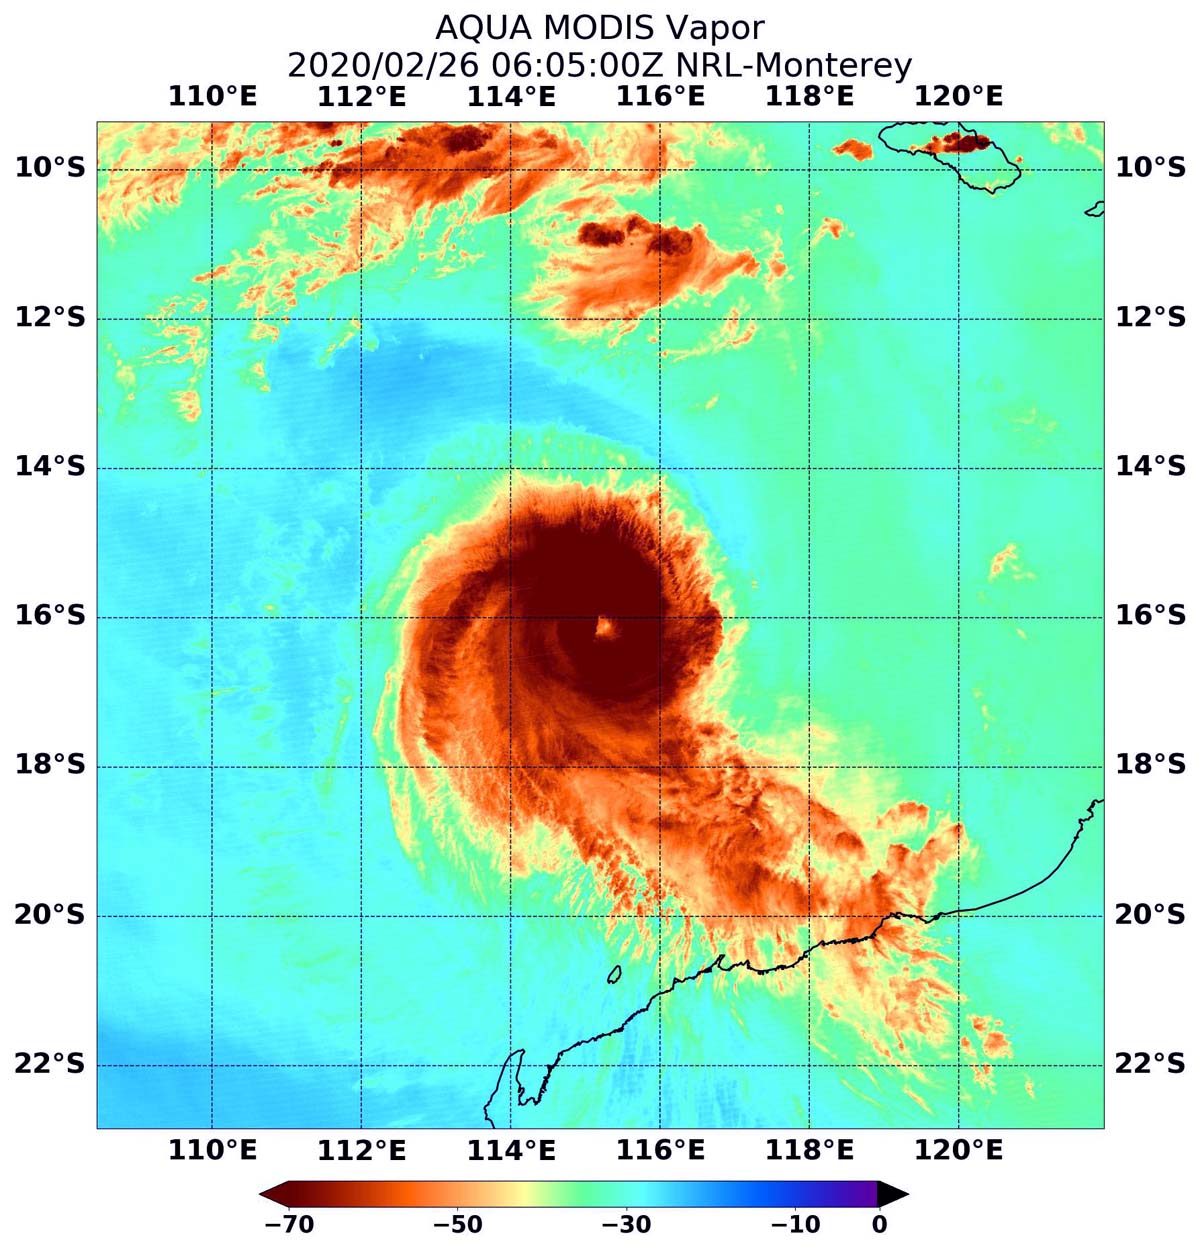
MODIS data also showed coldest cloud top temperatures were as cold as or colder than minus 70 degrees Fahrenheit (minus 56.6 degrees Celsius) in those storms. Storms with cloud top temperatures that cold have the capability to produce heavy rainfall.

Water vapor analysis of tropical cyclones tells forecasters how much potential a storm has to develop. Water vapor releases latent heat as it condenses into liquid. That liquid becomes clouds and thunderstorms that make up a tropical cyclone. Temperature is important when trying to understand how strong storms can be. The higher the cloud tops, the colder and the stronger the storms.

The Australian Bureau of Meteorology (ABM) noted that no warnings were in effect for Western Australia as Ferdinand remains far from land areas. At 8:57 p.m. WST (7:57 a.m. EST), ABM noted that Severe Tropical Cyclone Ferdinand (Category 3) was located near 16.4 degrees south latitude and 114.8 degrees east longitude, about 530 km (329 miles) north-northwest of Karratha and 620 km (385 miles) north of Exmouth and moving southwest at 7 kilometers (4 miles) per hour. ABM forecasts that Ferdinand will move slowly toward the west-southwest over the next few days and remain well north of the Western Australia mainland. On Thursday, Feb. 27, the Ferdinand is expected to begin a weakening trend and may be below tropical cyclone intensity late in the week or early weekend. No significant impacts are expected over the Western Australia mainland.

NASA’s Aqua satellite is one in a fleet of NASA satellites that provide data for hurricane research.

Tropical cyclones are the most powerful weather event on Earth. NASA’s expertise in space and scientific exploration contributes to essential services provided to the American people by other federal agencies, such as hurricane weather forecasting.

For updates from ABM, visit: http://www.bom.gov.au/

Rob Gutro
NASA’s Goddard Space Flight Center, Greenbelt, Md.

Ferdinand – Southern Indian Ocean

Feb. 25, 2020 – NASA-NOAA Satellite Gets an Eye-opening Look at Tropical Cyclone Ferdinand

Tropical Cyclone Ferdinand has strengthened and developed an eye, as confirmed in imagery from NASA-NOAA’s Suomi NPP satellite.

The Visible Infrared Imaging Radiometer Suite (VIIRS) instrument aboard Suomi NPP provided a visible image of Ferdinand and showed that an eye opened as the storm continued to intensify. A thick band of powerful bands of thunderstorms circled the eye.

NASA-NOAA’s Suomi NPP satellite found that Tropical Cyclone Ferdinand has developed an eye as it continued to strengthen in the Southern Indian Ocean on Feb. 25, 2020. Credit: NASA Worldview, Earth Observing System Data and Information System (EOSDIS)

On Feb. 25 at 10 a.m. EST (1500 UTC), the Joint Typhoon Warning Center of JTWC noted that Tropical cyclone Ferdinand was located near 15.8 degrees south latitude and 116.5 degrees east longitude, approximately, 413 nautical miles north-northeast of Learmonth, Western Australia. Ferdinand was moving to the southwest and maximum sustained winds had increased to 90 knots (104 mph/167 kph). That is the equivalent of a Category 2 hurricane on the Saffir-Simpson hurricane wind scale.

JTWC forecasts that Ferdinand will move southwest and strengthen slightly more before starting to weaken. The storm is then expected to curve to the northwest through the Southern Indian Ocean.

Tropical cyclones are the most powerful weather event on Earth. NASA’s expertise in space and scientific exploration contributes to essential services provided to the American people by other federal agencies, such as hurricane weather forecasting.

Rob Gutro
NASA’s Goddard Space Flight Center, Greenbelt, Md.

Esther – Southern Pacific Ocean

Feb. 25, 2020 – NASA-NOAA Satellite Tracks Ex-Tropical Cyclone Esther in Northern Territory

The north central interior area of Australia’s Northern Territory is under warnings for heavy rainfall and gusty winds as Ex-Tropical Cyclone Esther moves on a westerly path. NASA-NOAA’s Suomi NPP satellite passed over Australia’s Northern Territory and found the remnants of former Tropical Cyclone Esther moving through the north central part of the territory and was blanketing the Carpentaria, Gregory and Barkley regions.

The Visible Infrared Imaging Radiometer Suite (VIIRS) instrument aboard Suomi NPP provided a visible image of Esther’s remnants that showed clouds extend from the Gulf of Carpentaria to the east, and stretch to the Gregory district in the central part of the Northern Territory. NPP showed that strong thunderstorms circle the low-level center of circulation and bands of thunderstorms were still feeding into the center from the north and from the east, generating heavy rainfall as the system moves over land.

On Feb. 25, NASA-NOAA’s Suomi NPP satellite passed over Australia’s Northern Territory and found the remnants of former Tropical Cyclone Esther moving through the north central part of the territory. Credit: NASA Worldview, Earth Observing System Data and Information System (EOSDIS)

At 7 a.m. EST/U.S. (9:30 p.m. CST Australia local time) on Feb. 25, the Australian Bureau of Meteorology (ABM) noted, “Ex-Tropical Cyclone Esther was located about 90 kilometers [55 miles] northeast of Elliott, moving west northwest. The system is expected to continue moving west through the northern Barkly District or southern Carpentaria District overnight and move into the eastern parts of the Gregory District on Wednesday morning as a deep tropical low. Squally thunderstorms and heavy rainfall are likely, particularly close to the system center.”

ABM said that damaging winds are expected over southern Carpentaria District and northern Barkly District tonight, extending to the eastern Gregory District on Wednesday morning. The strongest winds are likely to be associated with squally showers and thunderstorms. In addition, heavy rainfall may lead to flash flooding over the southern Carpentaria and northern Barkly Districts tonight, extending to the eastern Gregory District early on Wednesday. The heaviest rainfalls are likely to be associated with squally showers and thunderstorms. Locations which may be affected include Elliott, Kalkarindji, Larrimah, Daly Waters, Top Springs and Carpentaria District.

Tropical cyclones are the most powerful weather event on Earth. NASA’s expertise in space and scientific exploration contributes to essential services provided to the American people by other federal agencies, such as hurricane weather forecasting.

For updated forecasts from the ABM, visit:  http://www.bom.gov.au

Rob Gutro
NASA’s Goddard Space Flight Center, Greenbelt, Md.

Ferdinand – Southern Indian Ocean

Feb. 24, 2020 – NASA Aqua Satellite Sees Tropical Storm Ferdinand Strengthening

Tropical Storm Ferdinand formed in the Southern Indian Ocean and NASA’s Aqua satellite provided forecasters with a visible image of the strengthening storm.

Ferdinand formed on Feb. 23 by 4 p.m. EST (2100 UTC) as Tropical Cyclone 20S. By Feb. 24, it had been renamed Ferdinand.

On Feb. 24, 2020, the MODIS instrument that flies aboard NASA’s Aqua satellite provided a visible image of Tropical Cyclone Ferdinand in the Southern Indian Ocean, far off the coast of Western Australia. Credit: NASA Worldview

On Feb. 24 at 4 a.m. EST (0900 UTC), the Joint Typhoon Warning Center (JTWC) noted Ferdinand had maximum sustained winds near 55 knots (63 mph/102 kph). At that time, it was located near 14.9 degrees south latitude and 117.5 degrees east longitude about 484 nautical miles north-northeast of Learmonth, Australia.

On Feb. 24 at 4 a.m., EST (0900 UTC), the Moderate Imaging Spectroradiometer or MODIS instrument that flies aboard NASA’s Aqua satellite provided a visible image of Ferdinand that showed strong bands of thunderstorms wrapping into the low-level center. In addition to the visible image, animated enhanced infrared satellite imagery revealed a rapidly consolidating system with a developing central dense overcast feature. A microwave image also revealed an eye feature.

The JTWC forecast calls for Ferdinand to move southwest and peak at 90 knots (104 mph/167 kph) on Feb. 26 before weakening. Ferdinand is not expected to affect mainland Australia as it if forecast to turn west and away from Western Australia.

NASA’s Aqua satellite is one in a fleet of NASA satellites that provide data for hurricane research.

Tropical cyclones are the most powerful weather event on Earth. NASA’s expertise in space and scientific exploration contributes to essential services provided to the American people by other federal agencies, such as hurricane weather forecasting.

Rob Gutro
NASA’s Goddard Space Flight Center, Greenbelt, Md.

Esther – Southern Pacific Ocean

Feb. 24, 2020 – NASA Aqua Satellite Catches Tropical Storm Esther’s Landfall

 NASA’s Aqua satellite provided forecasters with a visible image of the Tropical Cyclone Esther making landfall on the southeastern coast of Australia’s Northern Territory.

Esther formed in the Gulf of Carpentaria on Feb. 23 at 10 a.m. EST (1500 UTC) as a tropical storm, and was designated Tropical Cyclone 19P. At 4 p.m. EST (2100 UTC), 19P was renamed as Esther and triggered warnings as it neared the southeastern coast of the Northern Territory. Early on Feb. 24, Esther passed over the Pellew Islands and made landfall near Borrololla.

On Feb. 24, 2020, the MODIS instrument that flies aboard NASA’s Aqua satellite provided a visible image of Tropical Cyclone Esther as it was making landfall on the eastern coast of Australia’s Northern Territory. Credit: NASA Worldview

On Feb. 24 at 4 a.m. EST (0900 UTC), the Joint Typhoon Warning Center (JTWC) issued the final warning on Esther. At that time, had maximum sustained winds near 50 knots (58 mph/93 kph). At that time, it was located near 16.7 degrees south latitude and 137.0 degrees east longitude about 454 nautical miles southeast of Darwin, Australia. Esther was moving to the west.

On Feb. 24 at 4 a.m., EST (0900 UTC), the Moderate Imaging Spectroradiometer or MODIS instrument that flies aboard NASA’s Aqua satellite provided a visible image of Esther that showed strong bands of thunderstorms wrapping into the low-level center.

Microwave satellite imagery showed the center was well defined and that the structure had consolidated as it moved over land.

The Australian Bureau of Meteorology noted on Feb. 24, “Ex-tropical cyclone Esther has transitioned to a vigorous tropical low, and will continue moving westward through the Northern Territory, bringing heavy rain, damaging wind gusts and abnormally high tides.”

The JTWC noted, “This system is forecast to maintain tropical depression strength as it tracks across Northern Australia and is expected to track back over water 4 to 5 days. The system is expected to regenerate quickly over water.”

NASA’s Aqua satellite is one in a fleet of NASA satellites that provide data for hurricane research.

Tropical cyclones are the most powerful weather event on Earth. NASA’s expertise in space and scientific exploration contributes to essential services provided to the American people by other federal agencies, such as hurricane weather forecasting.

Rob Gutro
NASA’s Goddard Space Flight Center, Greenbelt, Md.

Wasi (Formerly 18P) – Southern Pacific Ocean

Feb. 24, 2020 – NASA’s Aqua Satellite Finds Tropical Cyclone Wasi’s Remnants

Tropical Cyclone 18P briefly strengthened into a tropical storm in the Southern Pacific Ocean and quickly faded.

On Feb. 22 at 4 a.m. EST (0900 UTC), 18P became Tropical Cyclone Wasi with maximum sustained winds near 55 knots (63 mph/102 kph), the peak of its strength. At that time, Wasi triggered a tropical cyclone and gale warning for Niue. A tropical storm warning was also posted for Tutuila, Aunuu and Manua Islands in American Samoa.

On Feb. 24, 2020 at 0125 UTC (Feb. 23 at 8:50 p.m. EST), the Moderate Imaging Spectroradiometer or MODIS instrument that flies aboard NASA’s Aqua satellite provided a visible image of the remnants clouds of Wasi in the Southern Pacific Ocean. Credit: NASA/NRL

By Feb. 23 at 10 a.m. EST (1500 UTC), the Joint Typhoon Warning Center posted its final warning on Wasi. At that time, Wasi was located near 17.2 degrees south latitude and 171.0 degrees west longitude, about 130 nautical miles north-northwest of Niue. Maximum sustained winds had dropped to 25 knots (29 mph/46 kph), below tropical cyclone strength.

On Feb. 24, 2020 at 0125 UTC (Feb. 23 at 8:50 p.m. EST), the Moderate Imaging Spectroradiometer or MODIS instrument that flies aboard NASA’s Aqua satellite provided a visible image of the remnants clouds of Wasi in the Southern Pacific Ocean.

NASA’s Aqua satellite is one in a fleet of NASA satellites that provide data for hurricane research.

Tropical cyclones are the most powerful weather event on Earth. NASA’s expertise in space and scientific exploration contributes to essential services provided to the American people by other federal agencies, such as hurricane weather forecasting.

Rob Gutro
NASA’s Goddard Space Flight Center, Greenbelt, Md.

Vicky – Southern Pacific Ocean

Feb. 24, 2020 – NASA’s Aqua Satellite Sees Tropical Cyclone Vicky Dissipating

Three days after American Samoa had tropical storm warnings from Tropical Cyclone Vicky, the storm had moved far to the south and was dissipating in the Southern Pacific Ocean. NASA’s Aqua satellite provided forecasters with a visible image of the fading former tropical cyclone on Feb. 24.

On Feb. 24, 2020 at 0120 UTC (Feb. 23 at 8:20 p.m. EST), the MODIS instrument that flies aboard NASA’s Aqua satellite provided a visible image of the dissipating Tropical Cyclone Vicky in the Southern Pacific Ocean. Credit: NASA/NRL

On Feb 21, the Joint typhoon warning center issued the final warning on Vicky. At 2100 GMT or 4 p.m. EST Vicky had maximum sustained winds near 35 knots (40 mph). At that time, it was located near 17.3 degrees south latitude and 169.7 degrees west longitude about 109 nautical miles north of Niue.

On Feb. 24, 2020 at 0120 UTC (Feb. 23 at 8:20 p.m. EST), the Moderate Imaging Spectroradiometer or MODIS instrument that flies aboard NASA’s Aqua satellite provided a visible image of the dissipating Tropical Cyclone Vicky in the Southern Pacific Ocean. The Aqua image showed wispy clouds devoid of rainfall, circling a weak center. Vicky’s remnants are expected to dissipate later in the day.

NASA’s Aqua satellite is one in a fleet of NASA satellites that provide data for hurricane research.

Tropical cyclones are the most powerful weather event on Earth. NASA’s expertise in space and scientific exploration contributes to essential services provided to the American people by other federal agencies, such as hurricane weather forecasting.

Rob Gutro
NASA’s Goddard Space Flight Center, Greenbelt, Md.

Vicky – Southern Pacific Ocean

Feb. 21, 2020 – NASA Measures Rainfall Rates in Two American Samoa Tropical Cyclones

There are two tropical cyclones affecting American Samoa in the South Pacific Ocean on Feb. 21. Tropical Storm Vicky has triggered warnings, while Tropical Cyclone 18P continues to develop. The Global Precipitation Measurement mission or GPM satellite provided a look at the rainfall rates occurring in both storms.

GPM image of Vicky
The GPM’s core satellite passed over the South Pacific Ocean on Feb. 20 at 10:20 p.m. EDT (0220 UTC, Feb. 21). GPM found heaviest rainfall (orange) occurring in both Tropical Cyclone 18P and Tropical Storm Vicky, falling at rates of 1 inch (25 mm) per hour. Light rain appears around those heavier rainfall areas and throughout the rest of the tropical cyclones (light blue), falling at less than 0.2 inches (less than 5 millimeters) per hour. Credit: NASA/NRL

Vicky is located to the southeast of American Samoa and 18P is located to the northwest. American Samoa is a U.S. territory covering seven islands and atolls. The capital city of Pago Pago is located on Tutuila, the largest island.

The National Weather Service (NWS) in Pago Pago issued a Tropical Storm Warning on Feb. 21 for American Samoa, and coastal waters out to 40 nautical miles including National Marine Sanctuary of American Samoa.

In addition, a High Surf Warning remains in effect that states, “Hazardous surfs of at least 20 feet, with locally higher sets, will impact coastal waters, especially west through south facing shores of all islands due to the intensification of Tropical Storm Vicky south of the islands.” A Flash Flood Watch is also in effect for all of American Samoa.

The GPM’s core satellite passed over the South Pacific Ocean on Feb. 20 at 10:20 p.m. EDT (0220 UTC, Feb. 21). GPM found heaviest rainfall occurring in both Tropical Cyclone 18P and Tropical Storm Vicky, falling at rates of 1 inch (25 mm) per hour. Light rain appeared around those areas and throughout the rest of the tropical cyclones, falling at less than 0.2 inches (less than 5 millimeters) per hour.

On Feb. 21 at 4 a.m. EST (0900 UTC), Vicky was located near latitude 15.7 degrees south and longitude 170.7 degrees west, about 84 nautical miles south of Pago Pago, American Samoa. Vicky was moving to the south and had maximum sustained winds 40 knots (46 mph/74 kph).

Vicky is gradually weakening and the Joint Typhoon Warning Center expects it to weaken below tropical cyclone strength before passing near Niue within 24 hours.

Tropical cyclones/hurricanes are the most powerful weather events on Earth. NASA’s expertise in space and scientific exploration contributes to essential services provided to the American people by other federal agencies, such as hurricane weather forecasting.

GPM is a joint mission between NASA and the Japan Aerospace Exploration Agency, JAXA.

For updated forecasts from the NWS in Pago Pago, visit: https://www.weather.gov/ppg/?lang=english

By Rob Gutro
NASA’s Goddard Space Flight Center

18P – Southern Pacific Ocean

Feb. 21, 2020 – NASA Sees Tropical Cyclone 18P Form Near American Samoa

The low-pressure area that has been lingering west-northwest of American Samoa for several days has organized into a tropical depression. NASA’s Terra satellite passed over the Southern Pacific Ocean and provided forecasters with a visible image of Tropical Depression 18P.

Terra image of 18P
On Feb. 21, 2020, the MODIS instrument that flies aboard NASA’s Terra satellite provided a visible image of newly developed Tropical Depression 18P in the Southern Pacific Ocean. Credit: NASA Worldview

On Feb.21, the Moderate Resolution Imaging Spectroradiometer or MODIS instrument that flies aboard NASA’s Terra satellite provided a visible image of 18P that showed an improved cyclonic circulation along the southern end of a line of deep convection and thunderstorms that extends north-to-south.

At 10 a.m. EST (1500 UTC) on Feb. 21, the Joint Typhoon Warning Center said Tropical Cyclone 18P had maximum sustained winds near 30 knots (34.5 mph/55.5 kph). It was located near latitude 12.9 degrees south and longitude 174.8 degrees west, about 280 nautical miles west-northwest of Pago Pago, American Samoa. 18P is moving to the east-southeast.

The tropical cyclone is forecast to intensify to a tropical storm reaching maximum sustained winds to 45 knots as it passes near American Samoa on Feb. 22. In three days, vertical wind shear is expected to kick in which will cause the storm to dissipate quickly.

In addition to Tropical Cyclone 18P, Tropical Storm Vicky has developed to the southeast of American Samoa. Together, these systems have generated several warnings and watches. On Feb. 21, the National Weather Service (NWS) in Pago Pago has continued the Flash Flood Watch for all of American Samoa through Saturday, Feb. 22. The NWS forecast page stated, “The active monsoon trough remains across the area with several hybrid lows developing northwest and moving swiftly across the islands through the week. A flash flood watch means that conditions may develop that lead to flash flooding. Flash flooding is a very dangerous situation.”

NASA’s Terra satellite is one in a fleet of NASA satellites that provide data for hurricane research.

Tropical cyclones/hurricanes are the most powerful weather events on Earth. NASA’s expertise in space and scientific exploration contributes to essential services provided to the American people by other federal agencies, such as hurricane weather forecasting.

For updated forecasts from NWS, Pago Pago, visit: https://www.weather.gov/ppg/?lang=english

By Rob Gutro
NASA’s Goddard Space Flight Center

Gabekile – Southern Indian Ocean

Feb. 18, 2020 – NASA Finds Wind Shear Doing in Tropical Storm Gabekile

Winds outside of Tropical Storm Gabekile are ripping the storm apart. NASA’s Aqua satellite provided a visible image of the storm that showed strong northwesterly wind shear was adversely affecting the storm.

Aqua image of Gabekile
On Feb. 18, 2020, the MODIS instrument that flies aboard NASA’s Aqua satellite provided a visible image of the dissipating Tropical Cyclone Gabekile in the Southern Indian Ocean. Credit: NASA NRL

Gabekile formed on Feb. 15 and by the next day, it had rapidly intensified to hurricane-force with maximum sustained winds near 75 knots (86 mph/139 kph), then after encountering wind shear the storm quickly weakened.

In general, wind shear is a measure of how the speed and direction of winds change with altitude. Tropical cyclones are like rotating cylinders of winds. Each level needs to be stacked on top each other vertically in order for the storm to maintain strength or intensify. Wind shear occurs when winds at different levels of the atmosphere push against the rotating cylinder of winds, weakening the rotation by pushing it apart at different levels.

When NASA’s Aqua satellite passed over the Southern Indian Ocean, it provided forecasters with a visible image of the tropical depression. On Feb. 18 at 3:30 a.m. EST (830 UTC), the Moderate Resolution Imaging Spectroradiometer or MODIS instrument that flies aboard NASA’s Aqua satellite showed wispy clouds circled around Gabekile’s low-level center and the bulk of clouds and storms were pushed more than 100 nautical miles southeast of the center.

At 10 a.m. EST (1500 UTC), the Joint Typhoon Warning Center (JTWC) issued the final bulletin on Gabekile. Tropical cyclone Gabekile had maximum sustained winds near 30 knots (34.5 mph/55.5 kph), making it a tropical depression. Gabekile was located near latitude 21.0 degrees south and longitude 75.5 degrees east, about 852 nautical miles south of Diego Garcia. Gabekile was moving to the south-southwest and dissipating.

NASA’s Aqua satellite is one in a fleet of NASA satellites that provide data for hurricane research.

Tropical cyclones/hurricanes are the most powerful weather events on Earth. NASA’s expertise in space and scientific exploration contributes to essential services provided to the American people by other federal agencies, such as hurricane weather forecasting.

By Rob Gutro
NASA’s Goddard Space Flight Center