TD15 – Atlantic Ocean

Oct. 16, 2019 – NASA’s Terra Satellite Catches End of Atlantic Tropical Depression 15

Tropical Depression Fifteen or TD15, developed off the west coast of Africa on Oct. 14 by 5 p.m. EDT. The depression never strengthened into a tropical storm before it reached the end of its life. NASA’s Terra satellite provided an image of  TD15 after stretched out and ceased being a tropical cyclone.

Terra image of TD15
NASA’s Terra satellite passed over TD 15 at 1:30 p.m. local time on Oct. 16 and the MODIS instrument aboard captured a visible image. The image showed the surface circulation had become elongated from north to south. There were also just a few weak swirls in the circulation envelope, and has degenerated into a trough (elongated area) of low pressure Credit: NASA Worldview

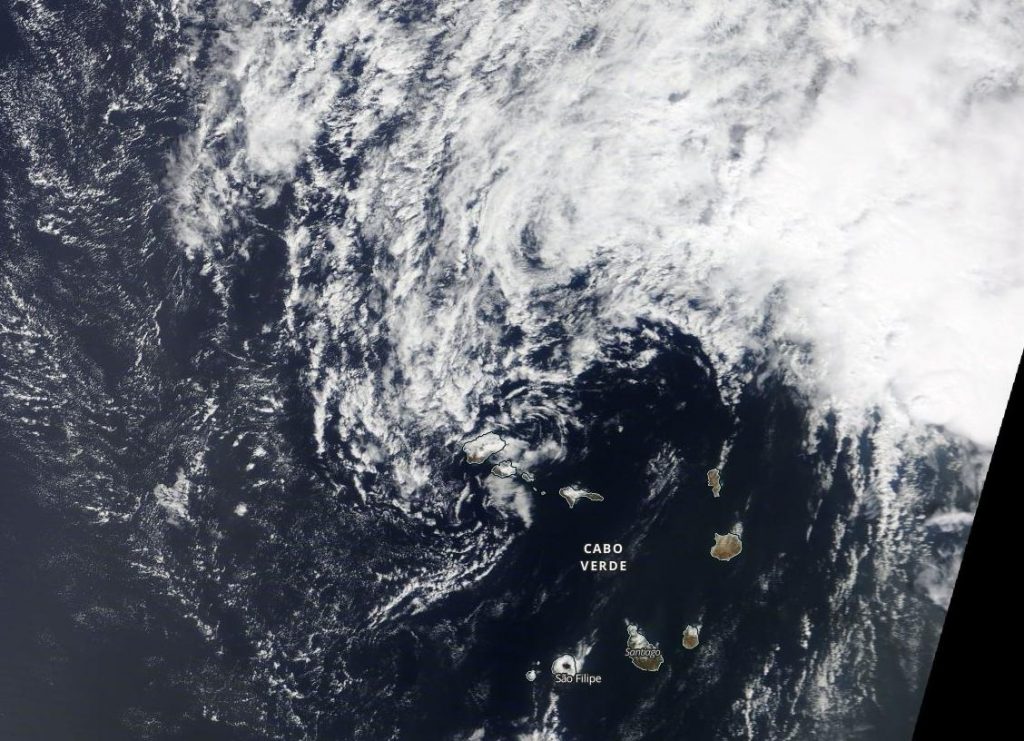
At 5 a.m. EDT (0900 UTC) on Oct. 16 the remnants of Fifteen were located near latitude 17.3 degrees north and longitude 24.1 degrees west. That is about 90 miles (145 km) north of the Cabo Verde Islands.  The remnants were moving toward the northwest near 8 mph (13 kph), and that motion should continue today. Maximum sustained winds were near 30 mph (45 kph) with higher gusts. The estimated minimum central pressure is 1009 millibars.

When NASA’s Terra satellite passed overhead at 1:30 p.m. local time, the Moderate Resolution Imaging Spectroradiometer or MODIS instrument aboard captured a visible image of TD15.

Visible imagery provides a look at the shape of the storm. A storm’s shape is a clue to forecasters that a storm is either strengthening or weakening. If a storm takes on a more rounded shape it is getting more organized and strengthening. Conversely, if it becomes less rounded or elongated, it is a sign the storm is weakening.

The image showed the surface circulation had become elongated from north to south. There were also just a few weak swirls in the circulation envelope, and has degenerated into a trough (elongated area) of low pressure. As a result, it is no longer a tropical cyclone. The system should weaken further today.

Hurricanes are the most powerful weather event on Earth. NASA’s expertise in space and scientific exploration contributes to essential services provided to the American people by other federal agencies, such as hurricane weather forecasting.

By Rob Gutro
NASA’s Goddard Space Flight Center

Hagibis – Northwestern Pacific Ocean

Oct. 16, 2019 – Typhoon Hagibis Leaves Destruction in Its Wake

Typhoon Hagibis, one of the most destructive storms to hit Japan in decades, made landfall on Saturday, Oct. 12, 2019 southwest of Tokyo with wind speeds equivalent to a Category 3 hurricane. The damage it left in its wake is visible from space.

ARIA image of destruction from Hagibis
NASA’s ARIA team, along with the Earth Observatory of Singapore, created this map showing damage from Typhoon Hagibis, which struck southwest of Tokyo on Oct. 12, 2019. Credit: Contains modified Copernicus Sentinel data (2019) processed by ESA, the ARIA team at NASA-JPL and Caltech, and EOS in Singapore

NASA’s Advance Rapid Imaging and Analysis (ARIA) team, in collaboration with the Earth Observatory of Singapore (EOS), used satellite data to create this map showing areas in Japan that are likely damaged as a result of Typhoon Hagibis. The color variation from yellow to red indicates increasingly more significant ground surface change, or damage.

The map was produced using synthetic aperture radar (SAR) data from the Copernicus Sentinel-1 satellites operated by the European Space Agency (ESA). The pre-event images were taken on Oct. 7, 2019, and the post-event image was acquired about 12 hours after the typhoon’s landfall. The map covers an area of 155 miles by 220 miles (250 kilometers by 350 kilometers) indicated by the red polygon.

The map was delivered to Sentinel Asia, a consortium that supports disaster management across the Asia-Pacific region using space-based technologies. Maps like this one can be used as guidance to help responders identify damaged areas and to allocate resources accordingly. The map may be less reliable over vegetated or badly flooded areas.

This map contains modified Copernicus Sentinel data processed by ESA, the ARIA team at NASA’s Jet Propulsion Laboratory and Caltech, both in Pasadena California, and EOS in Singapore. Its production was funded by NASA’s Disasters Program.

More information about ARIA and NASA’s Disasters Program is available here:

https://aria.jpl.nasa.gov/
https://disasters.nasa.gov/

By Esprit Smith
NASA’s Jet Propulsion Laboratory, Pasadena, Calif.

Hagibis – Northwestern Pacific Ocean

Oct. 15, 2019 – NASA’s Aqua Satellite Reveals Flooding in Japan from Typhoon Hagibis

Typhoon Hagibis made landfall in Japan over the weekend of October 12 and 13, bringing damaging winds, rough surf and flooding rains. NASA’s Aqua satellite provided a visible image of the flooding caused by the torrential rainfall.

Flooding in Japan as seen by Aqua
These two visible images of east central Japan were taken before and after the arrival of Typhoon Hagibis. The image of the left reveals dry land. The image on the right, after Hagibis made landfall and moved away from Japan, shows the extent of flooding in the central region around Toyko. Credit: NASA Worldview

Hagibis made landfall just before 6 a.m. EDT (7 p.m. local time, Japan) on Oct. 12, on the Izu Peninsula, located southwest of Tokyo.

On Oct. 12 at 5 p.m. EDT (2100 UTC), the Joint Typhoon Warning Center issued their final bulletin on Tropical Cyclone Hagibis. The storm has moved off Japan and re-emerged in the Northwestern Pacific Ocean where it is becoming extra-tropical. On Oct. 12 at 5 p.m. EDT, Hagibis was located near 28.6 north latitude and 141.9 east longitude, about 113 nautical miles south-southeast of Misawa, Japan. Hagibis was speeding to the northeast at 36 knots (41 mph/67 kph) and had maximum sustained winds 65 knots (75 mph/120 kph), still at hurricane-strength.

In its wake, Hagibis dropped large amounts of rainfall that flooded neighborhoods and cut power to thousands of people. There were also landslides from the heavy rainfall. Rainfall totals in Hakone were the highest at 994 mm (39.1 inches). Izu City received 760 mm (27.7 inches) and Chichibu received 683 mm (26.8 inches).

On Oct. 15, the Moderate Resolution Imaging Spectroradiometer or MODIS instrument provided a visible view of Japan, where Typhoon Hagibis made landfall and dropped huge rain totals. The image was compared to a visible image taken of the same region before the typhoon and showed a marked difference and many flooded areas.

On Oct. 13, Japanese public broadcaster NHK reported at least 31 deaths had occurred and there were still over 186 people missing. The storm was becoming extra-tropical as it moved east toward Alaska.

On Oct. 15, Hagibis’ remnants reached Alaska. The Southcentral and Southwest Alaska Forecast Discussion from the National Weather Service Anchorage Alaska on Oct. 15 cited “A strong 958 millibar low [pressure area] (remnants of Hagibis) centered west of St. Matthew Island continues to slowly move northward. This low has brought hurricane force gusts and high seas to the Bering waters overnight.”

For updated Alaska forecasts, visit:
https://forecast.weather.gov/MapClick.php?lat=53.6733&lon=-166.6483

By Rob Gutro
NASA’s Goddard Space Flight Center

Ema – Central Pacific Ocean

Oct. 15, 2019 – NASA’s Terra Satellite Catches a Glimpse of a Fleeting Ema

Tropical Storm Ema had a very short life, but NASA’s Terra satellite caught a glimpse of the storm before it dissipated in the Central Pacific Ocean.

Worldview image of Ema
On Oct. 13 NASA’s Terra satellite passed over Ema when it was still a tropical storm, but weakening. Strong convection was limited to the area north of the center of circulation due to southwesterly wind shear. The storm appears shallow other than that area of strong thunderstorms. Credit: NASA Worldview

The newest tropical storm of the Central Pacific Ocean hurricane season formed to the northwest of the Hawaiian Islands late on Oct. 12. Although there was no threat to Hawaii, there was a Tropical Storm Watch is in effect on Oct. 12 for portions of the Papahanaumokuakea Marine National Monument from Nihoa to French Frigate Shoals to Maro Reef.

At 2 a.m. HST/8 a.m. EDT (1200 UTC) on Oct. 13 the center of Tropical Storm Ema was located near latitude 22.1 North, longitude 165.9 West. Ema was moving toward the west-northwest near 10 mph (17 kph), and maximum sustained winds were near 40 mph (65 kph).

NASA’s Terra satellite passed over Ema on Oct. 13 when it was still a tropical storm. After Terra passed over Ema, the storm weakened to a depression. The MODIS or Moderate Resolution Imaging Spectroradiometer instrument visible image showed strong convection (rising air that forms the thunderstorms that make up a tropical cyclone) was limited to the area north of the center of circulation. That’s because of strong southwesterly wind shear affecting the storm that’s pushing the bulk of clouds and showers to the north. The National Hurricane Center also said that the storm appears shallow other than that area of strong thunderstorms.

By 11 a.m. HST/5 p.m. EDT on Oct. 13, the Tropical Storm Watch for portions of the Papahanaumokuakea Marine National Monument from French Frigate Shoals to Maro Reef has been canceled as Ema weakened to a depression.

On Monday, Oct. 14 at 5 a.m. EDT (0900 UTC), Ema, a post-tropical cyclone by that time, had dissipated near 25.4 degrees north latitude and 168.3 degrees west longitude.

By Rob Gutro
NASA’s Goddard Space Flight Center

Melissa – Northern Atlantic Ocean

Oct. 15, 2019 – NASA Provides a Farewell Infrared View of Extra-Tropical Storm Melissa

NASA’s Suomi NPP satellite passed over North Atlantic Ocean on Oct. 14 and provided forecasters with an infrared view of Tropical Storm Melissa that revealed wind shear was tearing the storm apart as it was becoming extra-tropical.

Suomi NPP image of Melissa
On Oct. 14, 2019 at 1:30 a.m. EDT (0530 UTC), the MODIS instrument that flies aboard NASA-NOAA’s Suomi satellite revealed that Melissa was being adversely affected by wind shear that was pushing all storms northeast of the center. In that area, cloud top temperatures were as cold as minus 70 degrees Fahrenheit (minus 56.6 Celsius). Credit: NASA/NRL

NASA’s Suomi NPP satellite used infrared light to analyze the strength of storms in Tropical Storm Melissa. Infrared data provides temperature information and the strongest thunderstorms that reach high into the atmosphere have the coldest cloud top temperatures.

Melissa became an extra-tropical cyclone on Monday, Oct. 14. The only thunderstorms and precipitation associated with the circulation were displaced up to 100 miles east of the center in this infrared image from NASA-NOAA’s Suomi NPP satellite on Oct. 14, 2019 at 1:30 a.m. EDT (0530 UTC). That area had cloud top temperatures as cold as or colder than minus 70 degrees Fahrenheit (minus 56.6 Celsius). Cloud top temperatures that cold indicate strong storms with the potential to generate heavy rainfall and that area was being pushed northeast by southwesterly wind shear. In general, wind shear is a measure of how the speed and direction of winds change with altitude. Tropical cyclones are like rotating cylinders of winds. Each level needs to be stacked on top each other vertically in order for the storm to maintain strength or intensify. Wind shear occurs when winds at different levels of the atmosphere push against the rotating cylinder of winds, weakening the rotation by pushing it apart at different levels.

The Suomi NPP satellite image also revealed that the inner-core consisted of a swirl of low clouds. NOAA’s National Hurricane Center (NHC) said the imagery also showed “a large amount of cool post-frontal stratocumulus wrapping into the northern and western portions of the circulation.”

What is Extra-tropical?

Extratropical means that a tropical cyclone has lost its “tropical” characteristics. The National Hurricane Center defines “extra-tropical” as a transition that implies both poleward displacement (meaning it moves toward the north or south pole) of the cyclone and the conversion of the cyclone’s primary energy source from the release of latent heat of condensation to baroclinic (the temperature contrast between warm and cold air masses) processes. It is important to note that cyclones can become extratropical and still retain winds of hurricane or tropical storm force.

Melissa’s Last Advisory

At 11 a.m. EDT (1500 UTC), on Oct. 14, the NHC or National Hurricane Center issued the final advisory on the system. The center of Post-Tropical Cyclone Melissa was located near latitude 41.0 degrees north and longitude 51.4 degrees west. Melissa was moving toward the east near 23 mph (37 kph) and this general motion is expected to continue through Tuesday. Maximum sustained winds were near 40 mph (65 kph) with higher gusts. NHC said, “Swells generated by Melissa are gradually subsiding along much of the U.S. east coast, portions of the Bahamas, Bermuda, and Atlantic Canada.”

The cyclone should gradually weaken before it dissipates today, Tuesday, Oct. 15.

Hurricanes are the most powerful weather event on Earth. NASA’s expertise in space and scientific exploration contributes to essential services provided to the American people by other federal agencies, such as hurricane weather forecasting.

By Rob Gutro
NASA’s Goddard Space Flight Center

Melissa – Northern Atlantic

Oct. 11, 2019 – NASA Sees Atlantic Subtropical Storm Melissa Form off New England Coast

Satellite data has confirmed the formation of Subtropical Storm Melissa. NASA’s Terra Satellite provided a visible image the former Nor’easter turned subtropical storm off the coast of New England.

The National Hurricane Center or NHC noted that the Nor’easter centered southeast of New England (in the northeastern U.S.) becomes a subtropical storm, and that the change in storm status does not change expected impacts from wind and coastal flooding along portions of the mid-Atlantic coast and Southeastern New England.

On Oct. 11, the Moderate Imaging Spectroradiometer or MODIS instrument that flies aboard NASA’s Terra satellite provided a visible image of the newly developed Melissa. Forecasters at the National Hurricane Center noted on Oct.11 at 11 a.m. EDT, “Convection increased near the center of the nor’easter centered southeast of New England overnight. First-light visible satellite imagery briefly showed an eye-like feature before the convection around the immediate center began to weaken. However, a large convective band still persists over the northern semicircle, and this structure indicated the system has transitioned to a subtropical cyclone.”

satellite image of Melissa
On Oct. 11, the MODIS instrument that flies aboard NASA’s Terra provided a visible image of Subtropical Storm Melissa off the New England coast. Credit: NASA Worldview, Earth Observing System Data and Information System (EOSDIS).

At 11 a.m. EDT (1500 UTC), on Oct. 11, the center of Subtropical Storm Melissa was located near latitude 38.5 degrees North and longitude degrees 69.6 West. That is about 190 miles (300 km) south of Nantucket, Massachusetts. Melissa is moving toward the south-southwest near 3 mph (6 kph), but little net motion is expected today. A turn toward the east-northeast with an increase in forward speed is forecast tonight and this motion will continue through the weekend. On the forecast track, the center of Melissa will move away from the east coast of the United States.

Maximum sustained winds are near 65 mph (100 kph) with higher gusts. Gradual weakening is expected over the next couple of days, and Melissa is forecast to lose its subtropical characteristics by Saturday night. Winds of 40 mph extend outward up to 345 miles (555 km) from the center, primarily over waters. The estimated minimum central pressure is 995 millibars.

Hurricanes are the most powerful weather event on Earth. NASA’s expertise in space and scientific exploration contributes to essential services provided to the American people by other federal agencies, such as hurricane weather forecasting.

For updated forecasts, visit: www.nhc.noaa.gov

Rob Gutro
NASA’s Goddard Space Flight Center, Greenbelt, Md.

Hagibis – Northwestern Pacific Ocean

Oct. 11, 2019 – Suomi NPP Satellite Finds a Weaker Typhoon Hagibis Nearing Japan

On Oct. 10, Hagibis was a super typhoon, but overnight, the storm weakened to typhoon status. NASA-NOAA’s Suomi NPP satellite provided a visible image of the large storm that stretched along most of the big islands of Japan.

Visible imagery from NASA satellites help forecasters understand if a storm is organizing or weakening, based on changes to its structure. The Visible Infrared Imaging Radiometer Suite (VIIRS) instrument aboard Suomi NPP provided a visible image of Hagibis that showed the eye had become cloud-filled. Despite that, A solid ring of deep convection (strong thunderstorm development) is evident around the compact, 10 nautical mile wide eye.

Satellite image of Hagibis
NASA-NOAA’s Suomi NPP satellite passed over Typhoon Hagibis and revealed the eye had become cloud-filled as the storm weakened from a super typhoon to a typhoon. The eye was surrounded by powerful thunderstorms and a large tail of clouds that covered most of Japan. Credit: NASA Worldview, Earth Observing System Data and Information System (EOSDIS)

The image was created using NASA Worldview, the Earth Observing System Data and Information System (EOSDIS) data product at NASA’s Goddard Space Flight Center in Greenbelt, Md. The image showed the cloud-filled eye circled by powerful thunderstorms and a large tail of clouds streaming to the northeast of the center that stretched along much of Japan’s east coast.

At 5 a.m. EDT (0900 UTC), the Joint Typhoon Warning Center reported the center of Typhoon Hagibis was located near latitude 28.8 degrees north and longitude 137.5 degrees east. Hagibis is about 406 nautical miles south of Yokosuka, Japan. Hagibis was moving toward the north-northwest. Maximum sustained winds are near 132 mph (213 kph/115 knots) with higher gusts. It is the equivalent of a Category 3 hurricane on the Saffir-Simpson hurricane wind scale.

The Joint Typhoon Warning Center noted that Hagibis has continued to weaken and will turn to the northeast on approach to Honshu. Hagibis is expected to make a brief landfall near Tokyo during Saturday (GMT) before curving back out into the Northwestern Pacific Ocean. The system is forecast to become extra-tropical south of the Kuril Islands on Sunday.

Hurricanes are the most powerful weather event on Earth. NASA’s expertise in space and scientific exploration contributes to essential services provided to the American people by other federal agencies, such as hurricane weather forecasting.

Rob Gutro
NASA’s Goddard Space Flight Center, Greenbelt, Md.

Hagibis – Northwestern Pacific Ocean

Oct. 10, 2019 – NASA-NOAA’s Suomi NPP Satellite Needed 3 Orbits to See All of Super Typhoon Hagibis

NASA-NOAA’s Suomi NPP satellite provided forecasters with a composite visible image of the very large Super Typhoon Hagibis in the Northwestern Pacific Ocean on Oct. 10. It took Suomi NPP three orbits to capture images to show the entire storm that revealed it maintained its impressive structure.

Visible imagery from NASA satellites help forecasters understand if a storm is organizing or weakening, based on changes to its structure. The Visible Infrared Imaging Radiometer Suite (VIIRS) instrument aboard Suomi NPP provided three visible images of Hagibis on Oct. 10. Those images had to be stitched together to show the entire storm on NASA Worldview, the Earth Observing System Data and Information System (EOSDIS) data product at NASA’s Goddard Space Flight Center in Greenbelt, Md. The image showed an eye surrounded by powerful thunderstorms and a large “tail” of clouds streaming to the northeast of the center.

satellite image of Hagibis
NASA-NOAA’s Suomi NPP satellite passed over Super Typhoon Hagibis and revealed the storm maintaining an eye surrounded by powerful thunderstorms, and a large “tail” of clouds streaming to the northeast of the center. Credit: NASA Worldview, Earth Observing System Data and Information System (EOSDIS)

At 5 a.m. EDT (0900 UTC), NHC reported the center of Super Typhoon Hagibis was located near latitude 24.4 degrees north and longitude139.4 degrees east. Hagibis is about 654 miles (560 km) south of Yokosuka, Japan. Hagibis is moving toward the north-northwest. Maximum sustained winds are near 161 mph (259 kph/140 knots) with higher gusts.

Hagibis remains at peak intensity as a Category 5 hurricane on the Saffir-Simpson Hurricane Wind Scale. The system will continue north-northwest as it goes through a weakening trend on approach to Japan. The Joint Typhoon Warning Center noted, “Hagibis will be making a quick landfall near Yokosuka via Sagami wan shortly after 48 hours (after 5 a.m. EDT (0900 UTC) on Oct. 10) before exiting back into the Pacific Ocean.”

Hurricanes are the most powerful weather event on Earth. NASA’s expertise in space and scientific exploration contributes to essential services provided to the American people by other federal agencies, such as hurricane weather forecasting.

For updated forecasts. visit: www.nhc.noaa.gov

Rob Gutro
NASA’s Goddard Space Flight Center, Greenbelt, Md.

Hagibis – Northwestern Pacific Ocean

Oct. 9, 2019 – NASA Covers Super Typhoon Hagibis Day and Night

NASA-NOAA’s Suomi NPP satellite provided daytime and nighttime imagery of powerful Super Typhoon Hagibis, revealing a small eye surrounded by powerful thunderstorms as the storm maintained strength.

Visible imagery from NASA satellites help forecasters understand if a storm is organizing or weakening. The Visible Infrared Imaging Radiometer Suite (VIIRS) instrument aboard Suomi NPP provided an infrared image of Hagibis on Oct. 8 at 11:56 a.m. EDT (1556 UTC) and a visible image of Hagibis on Oct. 9.

Hagibis as seen by NPP on Oct. 8, 2019
NASA-NOAA’s Suomi NPP satellite was able to catch a nighttime view of Hagibis around 11:56 a.m. EDT (1556 UTC) on Oct 8. The waxing gibbous Moon (76% illumination) was just setting providing ample lighting to see the small cloud filled eye along with lightning streaks and some tropospheric gravity waves. Credit: NASA/NOAA/UWM CIMSS, William Straka III.

The night-time high resolution infrared imagery showed a very small eye along with copious amounts of tropospheric gravity waves as well as some overshooting cloud tops (into the stratosphere) in some of the outer bands of thunderstorms. Overshooting cloud tops indicate very strong uplift of air and powerful thunderstorms. The waxing gibbous Moon (76% illumination) was just setting and provided ample lighting to see the small cloud-filled eye along with lightning streaks and some tropospheric gravity waves.

It took two images stitched together to create a complete visible, daytime picture of Hagibis. The Suomi NPP satellite passed over Hagibis twice on October 9 to get the entire storm. That image revealed that Hagibis maintained its small eye and powerful thunderstorms circling the center. Powerful bands of thunderstorms from north and south of center were also spiraling into the low-level center. The image was created by NASA Worldview, Earth Observing System Data and Information System (EOSDIS) at NASA’s Goddard Space Flight Center in Greenbelt, Md.

Hagibis as seen by NPP on Oct. 9, 2019
On Oct. 9, 2019, NASA-NOAA’s Suomi NPP satellite passed over Super typhoon Hagibis and captured this visible image of the storm. Credit: NASA Worldview, Earth Observing System Data and Information System (EOSDIS)

On Oct. 9 at 11 a.m. EDT (1500 UTC), Hagibis was centered near 21.2 degrees north latitude and 139.6 degrees east longitude. That is about 236 nautical miles south-southwest of Iwo To island, Japan. Hagibis was moving to the north-northwest at 6 knots and had maximum sustained winds near 140 knots (161 mph/259 kph) making it a Category 5 hurricane on the Saffir-Simpson hurricane wind scale.

Hagibis is expected to remain a strong tropical cyclone over the next day, eventually weakening as it turns to the north and likely impacting Japan by the weekend, per the Joint Typhoon Warning Center.

Hurricanes are the most powerful weather event on Earth. NASA’s expertise in space and scientific exploration contributes to essential services provided to the American people by other federal agencies, such as hurricane weather forecasting.

Rob Gutro
NASA’s Goddard Space Flight Center, Greenbelt, Md.

Hagibis – Northwestern Pacific Ocean

Oct. 8, 2019 NASA-NOAA Satellite Paints a Picture of Supertyphoon Hagibis

NASA-NOAA’s Suomi NPP satellite passed over the Northwestern Pacific Ocean and used infrared light to obtain temperature information about Supertyphoon Hagibis’ cold cloud tops, painting a picture of a super-strong storm.

NASA-NOAA’s Suomi NPP satellite used infrared light to analyze the strength of storms within the structure of Hagibis. Infrared data provides temperature information, and the strongest thunderstorms that reach high into the atmosphere have the coldest cloud top temperatures. This data is helpful to forecasters because storms are not uniform around tropical cyclones and it helps pinpoint where the strongest storms are located.

hurricane surrounded in red and green swirls
NASA-NOAA’s Suomi NPP satellite passed over Supertyphoon Hagibis and the VIIRS instrument aboard captured this image of the storm on Oct. 7 at 12:15 pm. EDT (1615 UTC). Suomi NPP found strongest thunderstorms around the center had cloud top temperatures as cold as 190 Kelvin (gray) or minus 117 degrees Fahrenheit (minus 83.1 Celsius). Credit: NASA/NOAA/UWM-CIMSS, William Straka III

Just before Suomi NPP passed over Hagibis, at 1:09 p.m. EDT (1509 UTC) Super Typhoon Hagibis passed just to the south of the island of Anatahan. The Joint Typhoon Warning Center or JTWC noted at 11 a.m. EDT (1500 UTC), that Hagibis  had winds of around 140 knots, which would make it a Super Typhoon or the equivalent of a Category 5 storm.

Oct. 7 at 12:15 pm. EDT (1615 UTC) the Visible Infrared Imaging Radiometer Suite (VIIRS) instrument aboard Suomi NPP found strongest thunderstorms circling Hagibis’ center had cloud top temperatures as cold as 190 Kelvin or minus 117 degrees Fahrenheit (minus 83.1 Celsius).  NASA research has shown that cloud top temperatures that cold indicate strong storms have the potential to generate heavy rainfall.

hurricane in black and white, with red/yellow eye
NASA-NOAA’s Suomi NPP satellite passed over Supertyphoon Hagibis and the VIIRS instrument aboard captured this close up image of the storm on Oct. 7 at 12:15 pm. EDT (1615 UTC). Suomi NPP found strongest thunderstorms around the center had cloud top temperatures as cold as 190 Kelvin (gray) or minus 117 degrees Fahrenheit (minus 83.1 Celsius). Credit: NASA/NOAA/UWM-CIMSS, William Straka III

On Oct. 8 at 5 a.m. EDT (0900 UTC), a Typhoon Warning remains in effect for Alamagan and Pagan Islands in the CNMI. Damaging winds of 39 to 50 mph will continue through at least late this evening. A Tropical Storm Warning remains in effect for Agrihan Island. Tropical storm conditions, including damaging winds of 39 to 50 mph, are expected through this evening.

At 10 p.m. CHST (8 a.m. EDT or 1200 UTC) the National Weather Service office in Tiyan, Guam noted that the center of Super Typhoon Hagibis was located near Latitude 18.5 degrees North and Longitude 141.8 degrees East. Hagibis is moving northwest at 15 mph. It is expected to maintain this general course with a decrease in forward speed during the next 24 hours. Maximum sustained winds remain at 155 mph. Hagibis is forecast to maintain this intensity through Wednesday then begin a gradual weakening trend.

Typhoon force winds extend outward from the center up to 85 miles. Tropical storm force winds extend outward from the center up to 300 miles to the northeast and up to 240 miles elsewhere.

Hagibis is moving northwest. The system will turn to the north as it goes through a weakening trend on approach to Japan.

Hurricanes are the most powerful weather event on Earth. NASA’s expertise in space and scientific exploration contributes to essential services provided to the American people by other federal agencies, such as hurricane weather forecasting.

By Rob Gutro
NASA’s Goddard Space Flight Center