Lowell – Eastern Pacific Ocean

Sep. 23, 2020 – NASA-NOAA Satellite Finds Wind Shear Affecting Tropical Storm Lowell

NASA-NOAA’s Suomi NPP satellite passed over the Eastern North Pacific Ocean and captured a visible image of Tropical Storm Lowell that revealed the storm was dealing with wind shear.
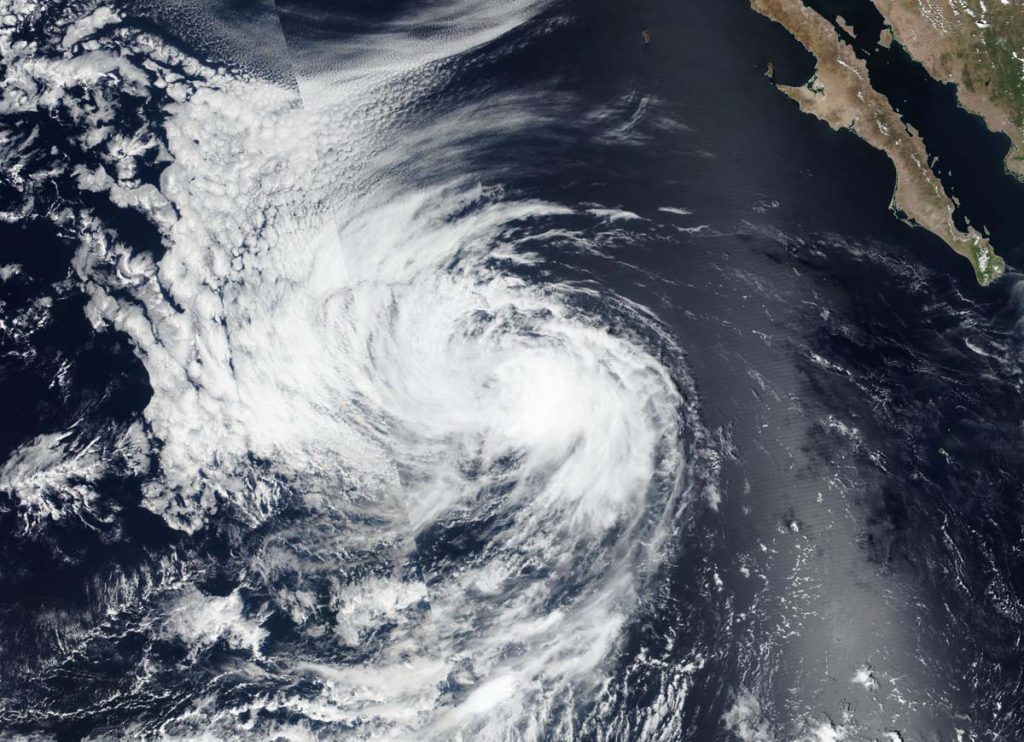
Suomi NPP image of Lowell
NASA-NOAA’s Suomi NPP satellite captured a visible image of Tropical Storm Lowell on Sept. 23 as it continued moving west through the open waters of the Eastern North Pacific Ocean. Credit: NASA Worldview, Earth Observing System Data and Information System (EOSDIS)

Wind shear is caused by winds outside of a tropical cyclone that are blowing against it at different altitudes and directions. Wind shear weakens tropical cyclones by adversely affecting their circulation. Wind shear can elongate a storm and make it spin more slowly, leading to weakening.

The Visible Infrared Imaging Radiometer Suite (VIIRS) instrument aboard Suomi NPP provided a visible image of Lowell on Sept. 23. Around the time of the Suomi NPP image, the National Hurricane Center noted a band of deep convection and thunderstorms had continued over the eastern quadrant of the storm, but the center was exposed and was located west of that band of thunderstorms. Lowell was being affected by moderate northwesterly wind shear which is not expected to abate much.

By 5 p.m. EDT on Sept. 23, Lowell was maintaining strength with a few bands of deep convection and developing thunderstorms located 30 nautical miles or more to the east of the exposed center.

Lowell’s Status on Sept. 24

At 5 a.m. EDT (0900 UTC) on Sept.24, the center of Tropical Storm Lowell was located near latitude 21.2 degrees north and longitude 123.7 degrees west. That is about 890 miles (1,435 km) west of the southern tip of Baja California, Mexico.

Lowell was moving toward the west-northwest near 10 mph (17 kph). Maximum sustained winds are near 45 mph (75 kph) with higher gusts. Gradual weakening is forecast to begin by late Thursday.

Lowell’s Forecast

NHC said a turn toward the west is expected Thursday morning, with that heading and a gradual increase in forward speed continuing through early next week. Lowell is expected to weaken to a tropical depression by late Friday and become a remnant low by early Saturday.

NASA Researches Tropical Cyclones

Hurricanes/tropical cyclones are the most powerful weather events on Earth. NASA’s expertise in space and scientific exploration contributes to essential services provided to the American people by other federal agencies, such as hurricane weather forecasting.

For more than five decades, NASA has used the vantage point of space to understand and explore our home planet, improve lives and safeguard our future. NASA brings together technology, science, and unique global Earth observations to provide societal benefits and strengthen our nation. Advancing knowledge of our home planet contributes directly to America’s leadership in space and scientific exploration.

By Rob Gutro 
NASA’s Goddard Space Flight Center

Dolly (was Subtropical Depression 4) – North Atlantic Ocean

June 23, 2020 – NASA Satellite Gives a Hello to Tropical Storm Dolly

During the morning of June 23, the fourth system in the Northern Atlantic Ocean was a subtropical depression. By the afternoon, the subtropical depression took on tropical characteristics and was renamed Dolly. NASA’s Terra satellite greeted Tropical Storm Dolly by taking an image of the new tropical storm.

Terra image of Dolly
NASA’s Terra satellite provided a visible image of Tropical Storm Dolly in the western North Atlantic Ocean on June 23, 2020 at 1:30 p.m. EDT. Credit: NASA Worldview

At 1 p.m. EDT (1700 UTC), the National Hurricane Center (NHC) classified Dolly as a tropical storm. The NHC Discussion said, “A (9:48 a.m. EDT) 1348 UTC an ASCAT-A scatterometer [a satellite instrument that measures wind speed and direction] pass, arriving just after the previous advisory was issued, indicates that the cyclone is producing winds of 35 to 40 knots (40 to 46 mph/65 to 74 kph) in its southern semicircle.  In addition, the radius of maximum winds has contracted to about 40 nautical miles. This, along with the current convective pattern, suggests that the system has made a transition from a subtropical to a tropical cyclone, and it has been designated as Tropical Storm Dolly.”

The center of Tropical Storm Dolly was located near latitude 39.4 degrees north and longitude 61.7 degrees west. That is about 370 miles (600 km) south-southeast of Halifax, Nova Scotia, Canada. Dolly was moving toward the east-northeast near 13 mph (20 kph).  A turn toward the northeast with an increase in forward speed is expected tonight and on Wednesday, June 24.

Satellite-derived wind data indicate that maximum sustained winds have increased to near 45 mph (75 kph) with higher gusts. Tropical-storm-force winds extend outward up to 70 miles (110 km) to the south of the center. The estimated minimum central pressure is 1002 millibars.

The Moderate Resolution Imaging Spectroradiometer or MODIS instrument that flies aboard NASA’s Terra satellite captured a visible image of Tropical Storm Dolly in the western North Atlantic Ocean on June 23, 2020 at 1:30 p.m. EDT. The image showed a thick band of thunderstorms wrapping around the center from the southern to the eastern quadrant of the storm. The image was created by NASA Worldview at NASA’s Goddard Space Flight Center in Greenbelt, Md.

The National Hurricane Center said, “Weakening is forecast during the next day or two as Dolly moves over colder waters, and the system is expected to become post-tropical on Wednesday. The low should then dissipate by early Thursday.”

NASA’s Terra satellite is one in a fleet of NASA satellites that provide data for hurricane research.

Tropical cyclones/hurricanes are the most powerful weather events on Earth. NASA’s expertise in space and scientific exploration contributes to essential services provided to the American people by other federal agencies, such as hurricane weather forecasting.

For updated forecasts, visit: www.nhc.noaa.gov

By Rob Gutro
NASA Goddard Space Flight Center

Nuri – South China Sea

June 12, 2020 – NASA Catches Development of Tropical Cyclone Nuri in South China Sea

A low-pressure system that developed in the Philippine Sea and tracked over the central Philippines has moved into the South China Sea and become a depression. NASA’s Terra satellite provided an image of the newly formed storm.

Terra image of Nuri
On June 12, 2020, the MODIS instrument that flies aboard NASA’s Terra satellite provided a visible image of the newly developed Nuri. The image showed a cluster of thunderstorms surrounding the center of circulation, and located between the Philippines and Hainan Island, China. Credit: NASA/Worldview

Tropical Depression Nuri (also known as 02W) formed by 5 a.m. EDT (0900 UTC) after passing over Luzon, Philippines and moved into the South China Sea. On June 12, 2020, the Moderate Resolution Imaging Spectroradiometer or MODIS instrument that flies aboard NASA’s Terra satellite provided a visible image of the newly developed Nuri. The image showed a cluster of thunderstorms surrounding the center of circulation and located between the Philippines and Hainan Island, China.

The Joint Typhoon Warning Center noted, “Animated enhanced infrared satellite imagery depicts discrete clusters of deep convection flaring around the periphery of a broad low-level circulation center. A microwave image indicates a broad weakly defined low level center with formative shallow banding [of thunderstorms] wrapping into the center.”

By 11 a.m. EDT (1500 UTC), it was located approximately 329 nautical miles south-southeast of Hong Kong, China, near latitude 17.9 degrees north and longitude 116.8 degrees east. Maximum sustained winds were 30 knots (34.5 mph/55.5 kph) and strengthening is forecast. Nuri has tracked west northwestward at 13 knots (15 mph/24 kph).

The storm is forecast to make landfall to the southwest of Hong Kong, China on June 14.

NASA’s Terra satellite is one in a fleet of NASA satellites that provide data for hurricane research.

Tropical cyclones/hurricanes are the most powerful weather events on Earth. NASA’s expertise in space and scientific exploration contributes to essential services provided to the American people by other federal agencies, such as hurricane weather forecasting.

By Rob Gutro
NASA’s Goddard Space Flight Center

Hagibis – Northwestern Pacific Ocean

Oct. 8, 2019 NASA-NOAA Satellite Paints a Picture of Supertyphoon Hagibis

NASA-NOAA’s Suomi NPP satellite passed over the Northwestern Pacific Ocean and used infrared light to obtain temperature information about Supertyphoon Hagibis’ cold cloud tops, painting a picture of a super-strong storm.

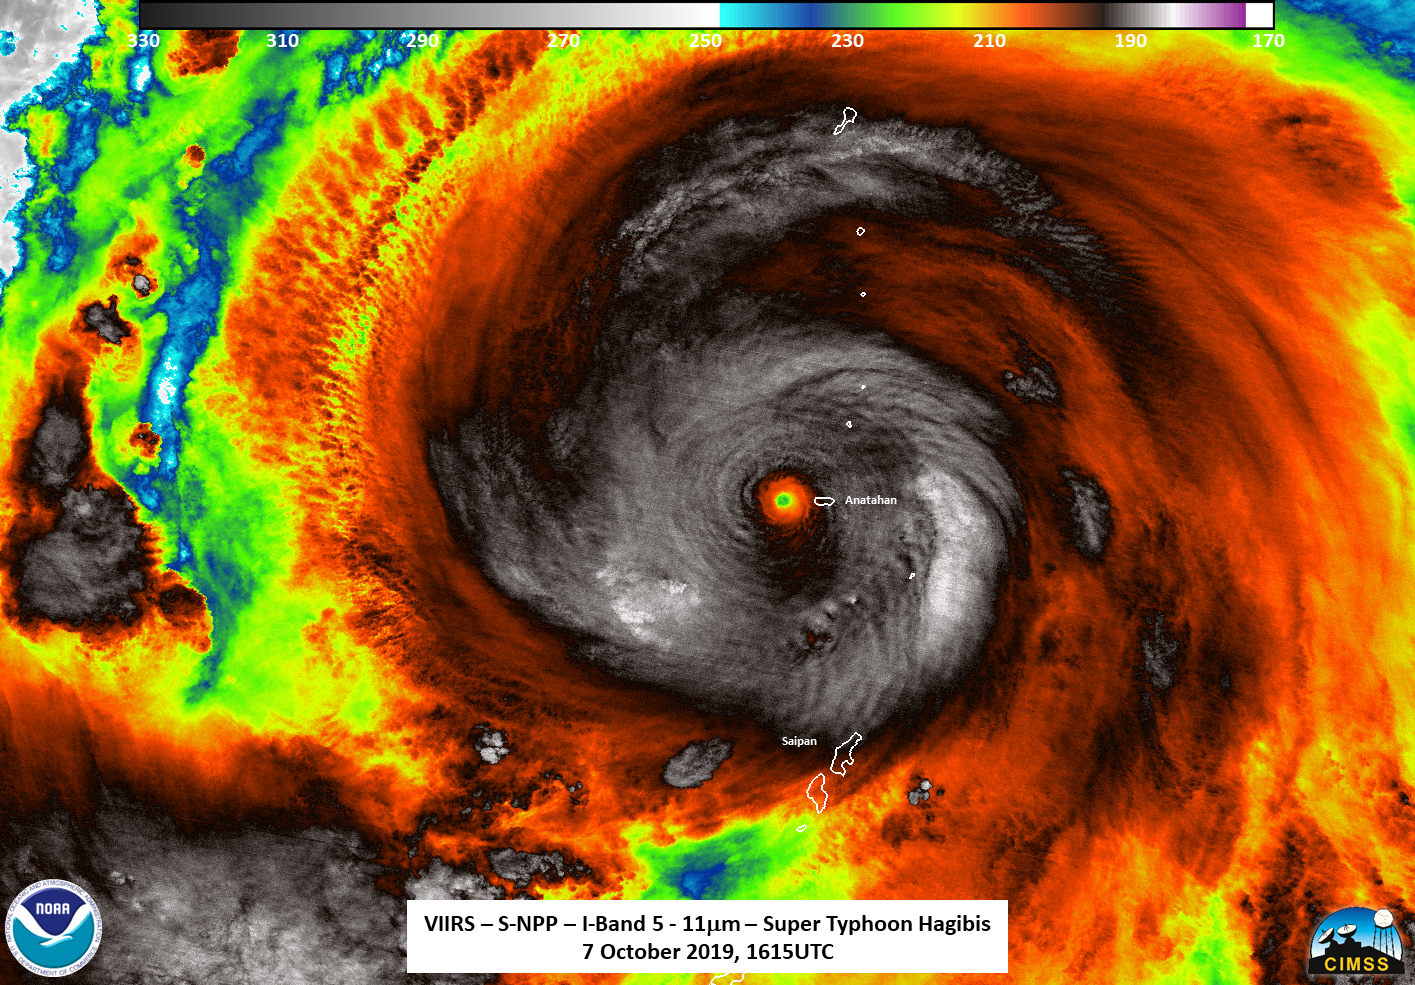
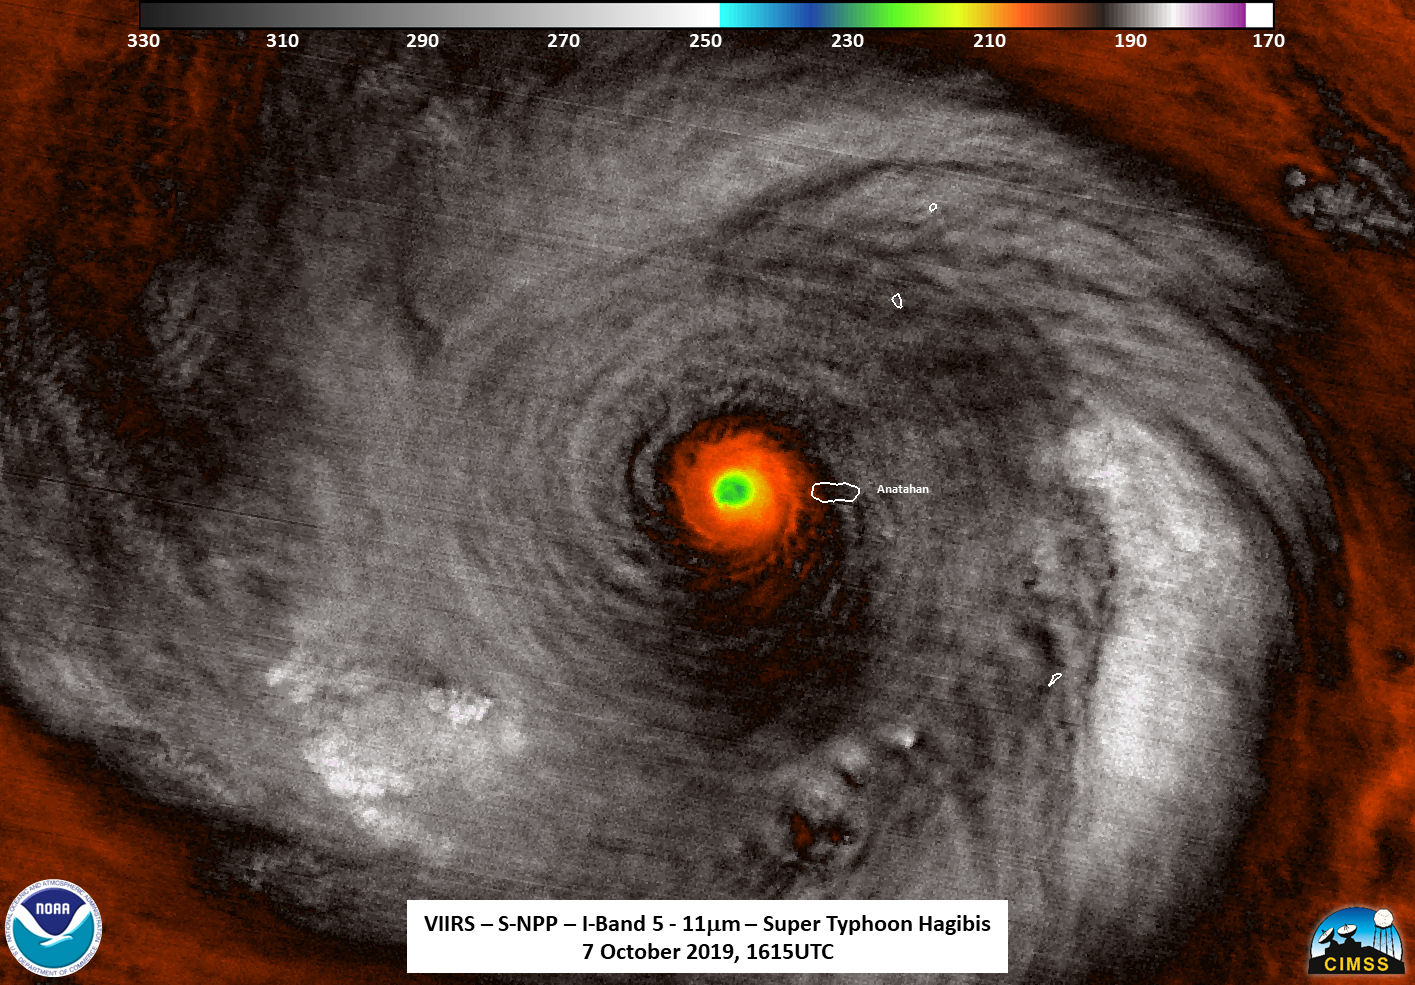
NASA-NOAA’s Suomi NPP satellite used infrared light to analyze the strength of storms within the structure of Hagibis. Infrared data provides temperature information, and the strongest thunderstorms that reach high into the atmosphere have the coldest cloud top temperatures. This data is helpful to forecasters because storms are not uniform around tropical cyclones and it helps pinpoint where the strongest storms are located.

hurricane surrounded in red and green swirls
NASA-NOAA’s Suomi NPP satellite passed over Supertyphoon Hagibis and the VIIRS instrument aboard captured this image of the storm on Oct. 7 at 12:15 pm. EDT (1615 UTC). Suomi NPP found strongest thunderstorms around the center had cloud top temperatures as cold as 190 Kelvin (gray) or minus 117 degrees Fahrenheit (minus 83.1 Celsius). Credit: NASA/NOAA/UWM-CIMSS, William Straka III

Just before Suomi NPP passed over Hagibis, at 1:09 p.m. EDT (1509 UTC) Super Typhoon Hagibis passed just to the south of the island of Anatahan. The Joint Typhoon Warning Center or JTWC noted at 11 a.m. EDT (1500 UTC), that Hagibis  had winds of around 140 knots, which would make it a Super Typhoon or the equivalent of a Category 5 storm.

Oct. 7 at 12:15 pm. EDT (1615 UTC) the Visible Infrared Imaging Radiometer Suite (VIIRS) instrument aboard Suomi NPP found strongest thunderstorms circling Hagibis’ center had cloud top temperatures as cold as 190 Kelvin or minus 117 degrees Fahrenheit (minus 83.1 Celsius).  NASA research has shown that cloud top temperatures that cold indicate strong storms have the potential to generate heavy rainfall.

hurricane in black and white, with red/yellow eye
NASA-NOAA’s Suomi NPP satellite passed over Supertyphoon Hagibis and the VIIRS instrument aboard captured this close up image of the storm on Oct. 7 at 12:15 pm. EDT (1615 UTC). Suomi NPP found strongest thunderstorms around the center had cloud top temperatures as cold as 190 Kelvin (gray) or minus 117 degrees Fahrenheit (minus 83.1 Celsius). Credit: NASA/NOAA/UWM-CIMSS, William Straka III

On Oct. 8 at 5 a.m. EDT (0900 UTC), a Typhoon Warning remains in effect for Alamagan and Pagan Islands in the CNMI. Damaging winds of 39 to 50 mph will continue through at least late this evening. A Tropical Storm Warning remains in effect for Agrihan Island. Tropical storm conditions, including damaging winds of 39 to 50 mph, are expected through this evening.

At 10 p.m. CHST (8 a.m. EDT or 1200 UTC) the National Weather Service office in Tiyan, Guam noted that the center of Super Typhoon Hagibis was located near Latitude 18.5 degrees North and Longitude 141.8 degrees East. Hagibis is moving northwest at 15 mph. It is expected to maintain this general course with a decrease in forward speed during the next 24 hours. Maximum sustained winds remain at 155 mph. Hagibis is forecast to maintain this intensity through Wednesday then begin a gradual weakening trend.

Typhoon force winds extend outward from the center up to 85 miles. Tropical storm force winds extend outward from the center up to 300 miles to the northeast and up to 240 miles elsewhere.

Hagibis is moving northwest. The system will turn to the north as it goes through a weakening trend on approach to Japan.

Hurricanes are the most powerful weather event on Earth. NASA’s expertise in space and scientific exploration contributes to essential services provided to the American people by other federal agencies, such as hurricane weather forecasting.

By Rob Gutro
NASA’s Goddard Space Flight Center

13W – Northwestern Pacific Ocean

Aug. 26, 2019 – NASA’s Terra Satellite Finds Some Power in Tropical Depression 13W

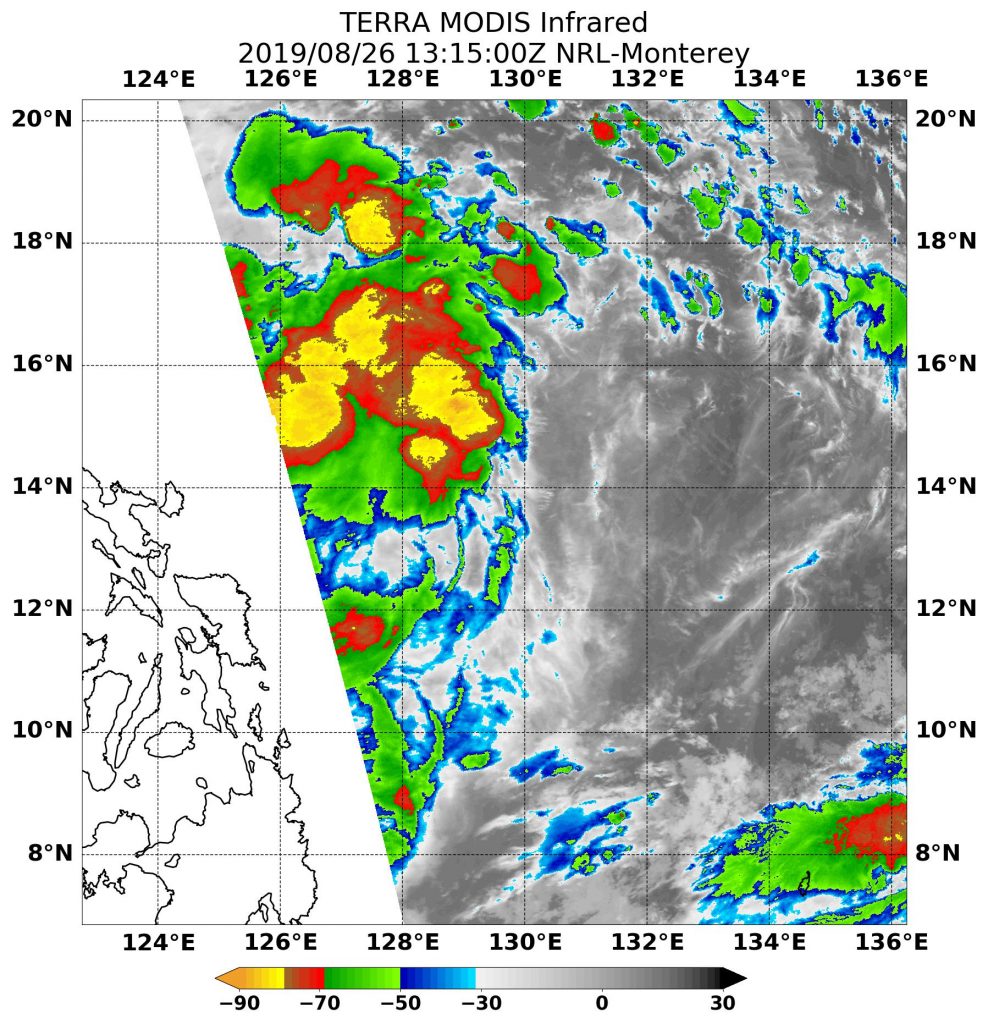
Infrared imagery from NASA’s Terra satellite revealed Tropical Depression 13W contained some powerful thunderstorms pushing high into the troposphere as it was moving west in the Philippine Sea toward the Philippines.

Terra image of 13W
On August 26 at 9:15 a.m. EDT (1315 UTC), the MODIS instrument that flies aboard NASA’s Terra satellite found strongest storms (yellow) had cloud top temperatures as cold as minus 80 degrees Fahrenheit (minus 62.2 Celsius). Credit: NASA/NRL

Tropical Depression 13W has already triggered warnings in the Philippines because it is located just east of the country. Philippines warnings include Tropical cyclone wind signal #1 over the following Luzon provinces: Cagayan, Isabela, Quirino, Nueva Vizcaya, Apayao, Abra, Kalinga, Mountain Province, Ifugao, Benguet, Aurora, Nueva Ecija, eastern portion of Pangasinan, northern portion of Quezon including Polillo Island and Catanduanes.

NASA’s Terra satellite used infrared light to analyze the strength of storms and found the most powerful thunderstorms stretching north over the center from west to east. Infrared data provides temperature information, and the strongest thunderstorms that reach high into the atmosphere have the coldest cloud top temperatures.

On August 26 at 9:15 a.m. EDT (1315 UTC), the Moderate Imaging Spectroradiometer or MODIS instrument that flies aboard NASA’s Terra satellite found those strongest storms had cloud top temperatures as cold as minus 80 degrees Fahrenheit (minus 62.2 Celsius). Cloud top temperatures that cold indicate strong storms with the potential to generate heavy rainfall.

At 11 a.m. EDT (1500 UTC), the center of Tropical Depression 13W was located near latitude 13.9 degrees north latitude and 128.5 degrees east longitude. That is about 498 nautical miles east of Manila, Philippines. 13W was moving toward the west and toward the Philippines. Maximum sustained winds are near 52 mph (45 knots/83 kph) with higher gusts.

The Joint Typhoon Warning Center expects 13W will move west across the Philippines, before turning northwest towards Hainan Island, China. The system will make final landfall in Vietnam after five days.

By Rob Gutro
NASA’s Goddard Space Flight Center

Kenanga (Southern Indian Ocean)

December 20, 2018 – Seeing Double: Tropical Cyclone Kenanga Same Strength as Other Storm

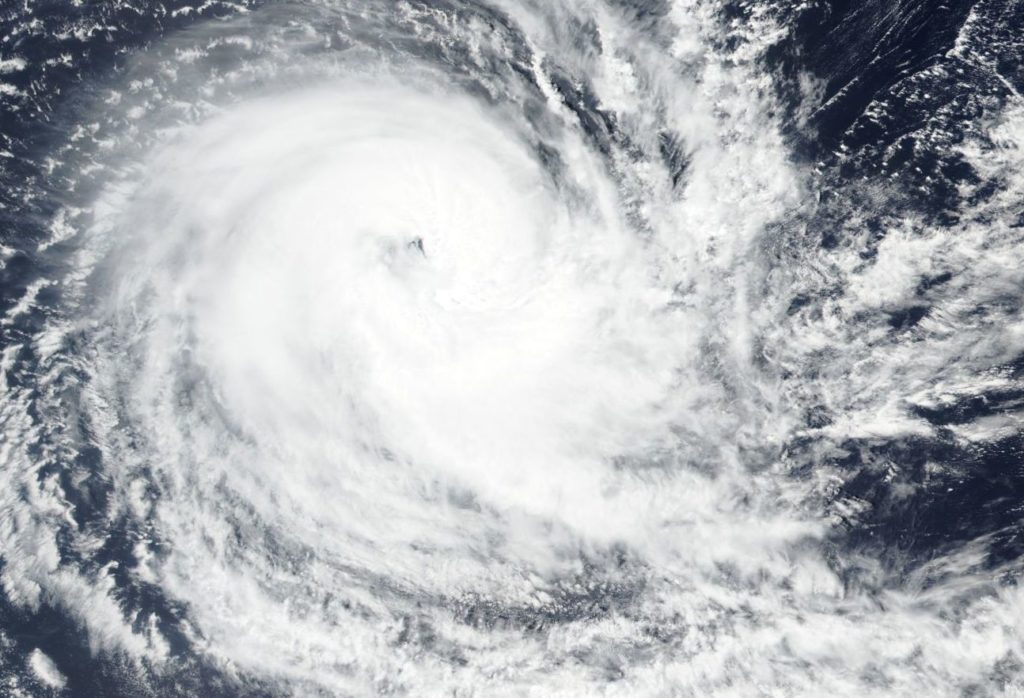
The Southern Indian Ocean is seeing double. Tropical Cyclone Kenanga was one of two storms at Category 2 hurricane strength in the Southern Indian Ocean on Dec. 20. Kenanga was sporting an eye on visible imagery from NASA-NOAA’s Suomi NPP satellite, and so was Tropical Cyclone Cilida, located west of Kenanga.

Suomi NPP image of Kenanga
On Dec. 20, the VIIRS instrument aboard NASA-NOAA’s Suomi NPP satellite captured a visible image of Tropical Cyclone Kenanga in the Southern Indian Ocean. Kenaga is located east of Tropical Cyclone Cilida. Credit: NASA Worldview, Earth Observing System Data and Information System (EOSDIS)

On Dec. 20, 2018 the Visible Infrared Imaging Radiometer Suite (VIIRS) instrument aboard NASA-NOAA’s Suomi NPP satellite showed a powerful thunderstorms circling Kenanga’s eye.

The Joint Typhoon Warning Center or JTWC noted that after the Suomi NPP image was taken, infrared imagery showed the loss of the eye and the erosion of the eyewall (powerful thunderstorms circling the open center).

Kenanga and Cilida are both Category 2 hurricanes on the Saffir-Simpson Hurricane Wind Scale, and both have maximum sustained winds near 90 knots (103.6 mph/166.7 kph) on Dec. 20 at 10 a.m. EDT (1500 UTC). Strongest storms appeared northwest of the eye.

Kenanga was located near 16.6 degrees south latitude and 81.2 degrees east longitude, approximately 773 nautical miles southeast of Diego Garcia. Kenanga was moving west.

The JTWC forecast calls for Kenanga to steadily weaken, and that will continue under the ongoing influence of moderate to strong vertical wind shear and passage over cooler water. The storm is expected to dissipate below 35 knots (40 mph/74 kph) in 5 days.

By Rob Gutro
NASA’s Goddard Space Flight Center

Walaka (Central Pacific Ocean) 2018

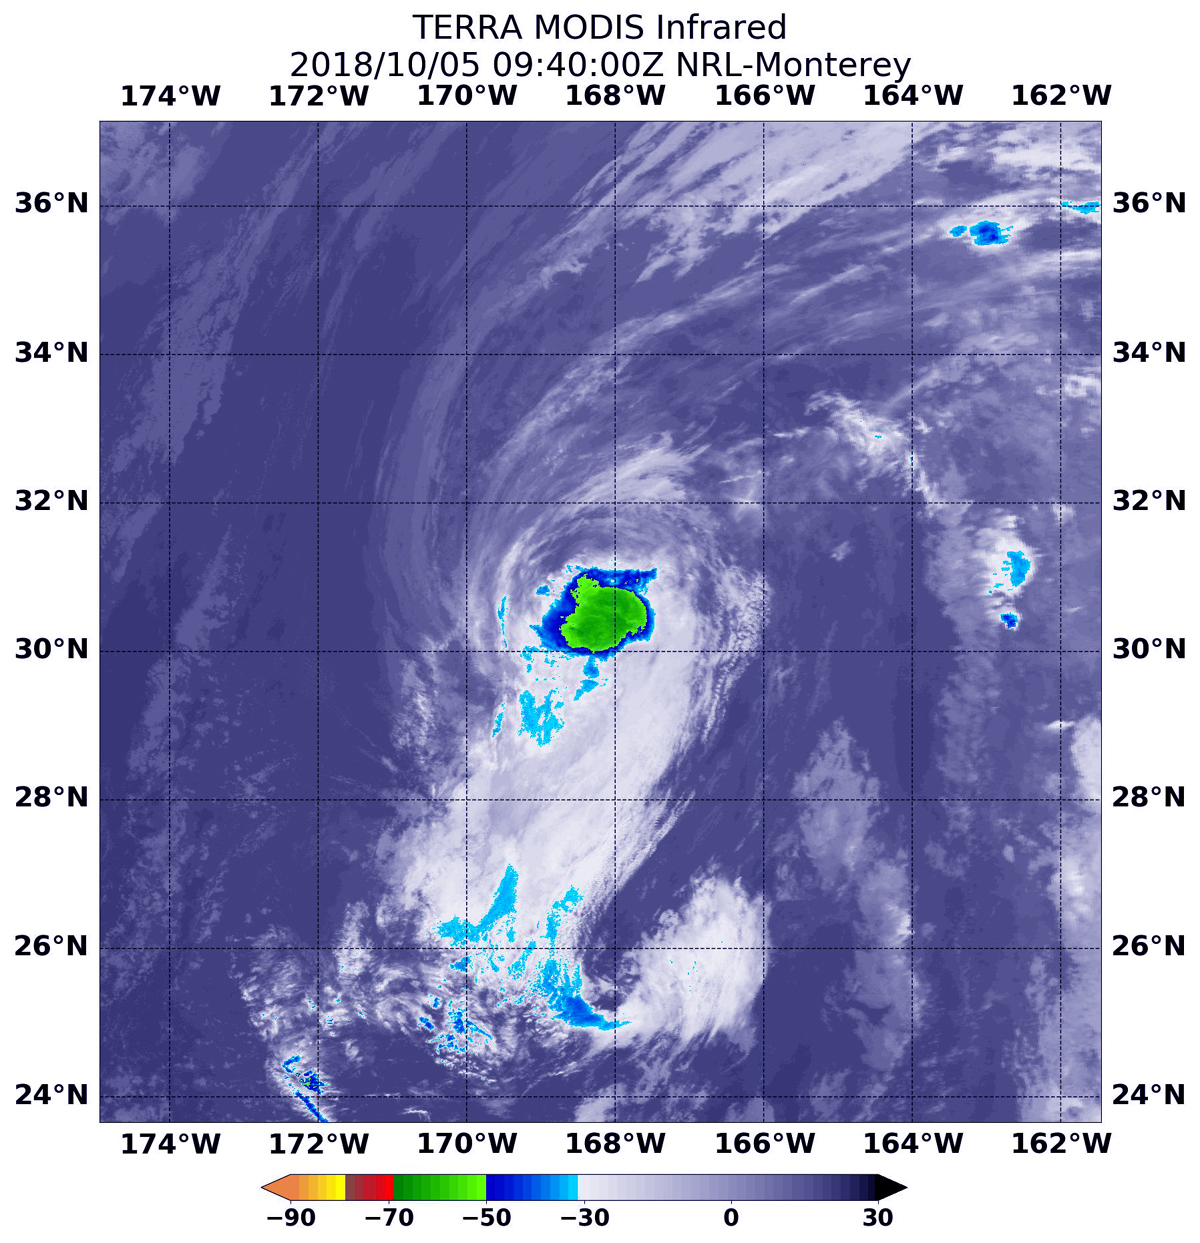
Oct. 05, 2018 -NASA Finds Walaka Weakened, Now a Tropical Storm

NASA’s Aqua satellite passed over the Central Pacific Ocean and obtained infrared data on Walaka, now weakened to a tropical storm with limited thunderstorm development.

hurricane in blue with green data center
At 5:40 a.m. EDT (0940 UTC) on Oct. 5, the MODIS instrument aboard NASA’s Aqua satellite looked at Tropical Storm Walaka in infrared light. MODIS found coldest cloud tops (yellow) in a small area near the center had temperatures near minus 63 degrees Fahrenheit (minus 53 degrees Celsius). Credit: NASA/NRL

Infrared satellite data at 5:40 a.m. EDT (0940 UTC) on Oct. 5, the Moderate Resolution Imaging Spectroradiometer or MODIS instrument aboard NASA’s Aqua satellite revealed strongest storms with the coldest cloud top temperatures in a small area around Walaka’s center. MODIS found coldest cloud tops had temperatures near minus 63 degrees Fahrenheit (minus 53 degrees Celsius). NASA research has found that cloud top temperatures that cold have the capability to generate heavy rainfall.

At 5 a.m. EDT (0900 UTC) on Friday, Oct. 5, the center of Tropical Storm Walaka was located near latitude 30.6 degrees north and longitude 168.3 degrees west. Walaka is about 480 miles (770 km) north-northwest of the French Frigate Shoals. Walaka is moving toward the north-northwest near 6 mph (9 kph). A turn toward the north is expected tonight, followed by an acceleration toward the northeast Friday through Saturday. Maximum sustained winds are near 70 mph (110 kph) with higher gusts.  Some weakening is forecast during the next 48 hours.

The Central Pacific Hurricane Center or CPHC said Walaka will be over cool sea surface temperatures through the remainder of its journey across the Pacific, with vertical wind shear expected to increase substantially Friday night and Saturday, Oct. 6. Steady weakening is forecast during the next 48 hours, and Walaka is expected to become a post-tropical low by Saturday evening.

CPHC noted that ocean swells generated by Walaka will continue to affect portions of the Papahanaumokuakea Marine National Monument and the main Hawaiian Islands tonight, Oct. 5.

For updated forecasts, visit:  http://www.prh.noaa.gov/cphc

Rob Gutro
NASA’ Goddard Space Flight Center

Leslie (Atlantic Ocean) 2018

NASA’s Aqua satellite passed over the Central Atlantic Ocean and obtained infrared data on Leslie, now weakened to a large tropical storm.

The National Hurricane Center or NHC said that Leslie remains a large tropical storm, with tropical-storm-force winds extending outward up to 290 miles (465 km) from the center. Because of the size and strength of Tropical Storm Leslie, waves from Leslie are expected to increase along the coasts of Atlantic Canada and New England today, Oct. 5.

Satellite data on Leslie
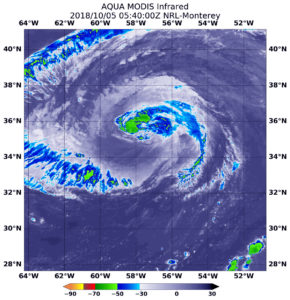
At 1:40 a.m. EDT (0540 UTC) on Oct. 5, the MODIS instrument aboard NASA’s Aqua satellite revealed strongest storms with the coldest cloud top temperatures (yellow) northwest of Leslie’s center with temperatures near minus 63 degrees Fahrenheit (minus 53 degrees Celsius). Credit: NASA/NRL

At 1:40 a.m. EDT (0540 UTC) on Oct. 5, the Moderate Resolution Imaging Spectroradiometer or MODIS instrument aboard NASA’s Aqua satellite revealed strongest storms with the coldest cloud top temperatures northwest of Leslie’s center. MODIS found coldest cloud tops had temperatures near minus 63 degrees Fahrenheit (minus 53 degrees Celsius). NASA research has found that cloud top temperatures that cold have the capability to generate heavy rainfall.

At 5 a.m. EDT (0900 UTC), the center of Tropical Storm Leslie was located near 35.9 degrees north latitude and 58.3 degrees west longitude. Leslie is moving toward the north-northwest near 14 mph (22 kph). A slower northward motion is expected to occur today, but Leslie will make a sharp turn toward the east and east-southeast over the weekend.

Maximum sustained winds are near 65 mph (100 kph) with higher gusts.  Little change in strength is forecast during the next several days.

NHC cautioned, “Large swells generated by Leslie will continue to affect portions of the southeastern coast of the United States, Bermuda, the Bahamas, and the Greater and Lesser Antilles during the next few days. Swells are expected to increase near the coasts of New England and Atlantic Canada today.”

For updated forecasts, visit: www.nhc.noaa.gov

Rob Gutro
NASA’ Goddard Space Flight Center