Four Times Around the World in 40 Days


From: Michael Studinger, Lamont-Doherty Earth Observatory, co-principal investigator on gravimeter team


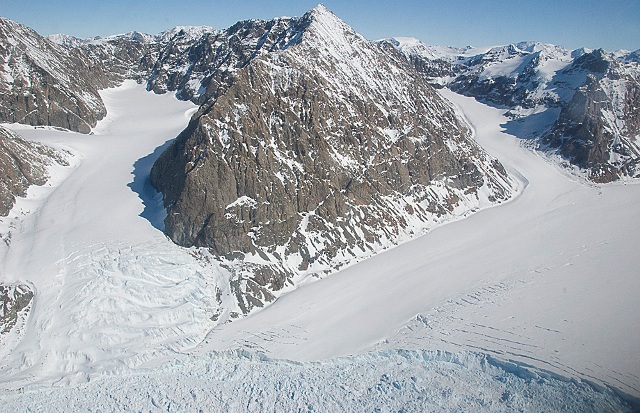
SANTIAGO, Chile — For the first time in more than 40 days, the nose of the NASA DC-8 pointed north on Nov. 23 after taking off from Punta Arenas airport. We have completed our Antarctic survey flights and are heading back home to Palmdale, Calif. Before we start climbing to cruising altitude we fly at 300 feet above the Strait of Magellan just outside Punta Arenas to collect atmospheric chemistry data. After two passes over the strait, we head north towards Santiago and enjoy the spectacular view of the Patagonian Ice Fields and the Torres del Paine from 35,000 feet.


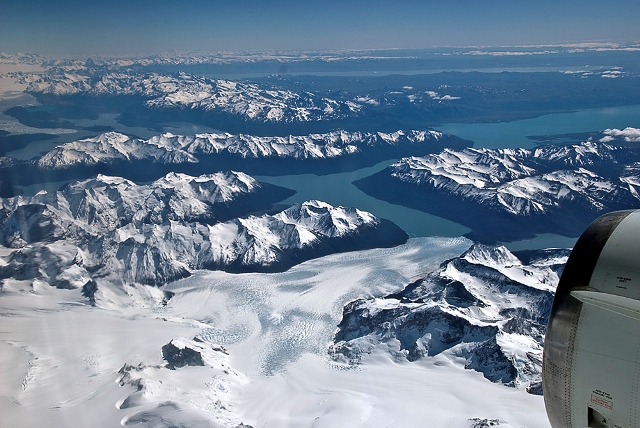
The Patagonian ice fields seen from 35,000 feet during the DC-8 flight from Punta Arenas to Santiago, Chile on Nov. 23. Photo by Michael Studinger.


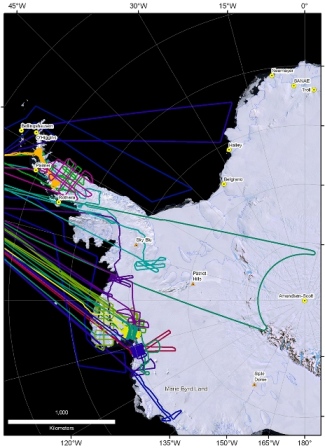
Over the past five weeks, the Ice Bridge teams have collected a landmark data set over Antarctica. We had originally planned to fly 17 missions but actually accomplished 21. We have flown more than 155,000 kilometers or almost 100,000 miles. This is almost four times around the world in 40 days.


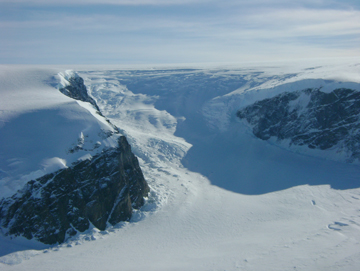
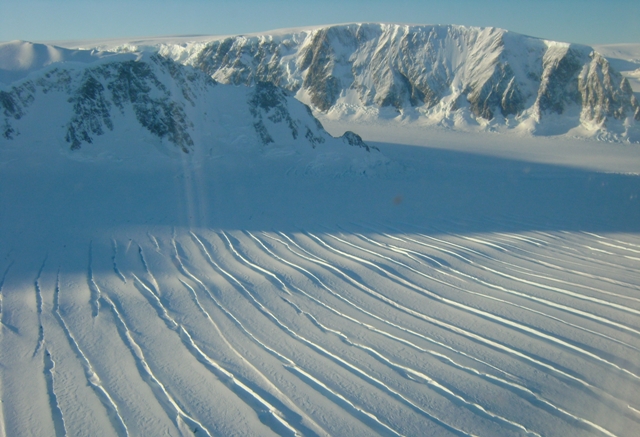
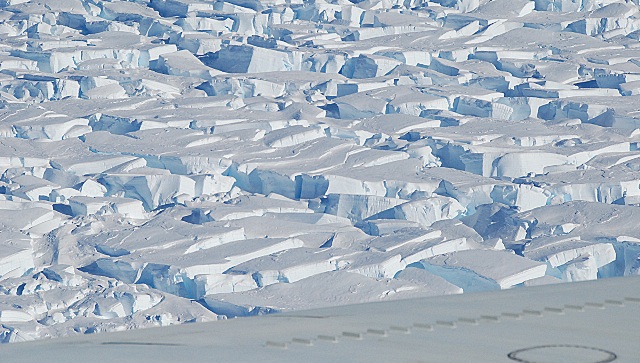
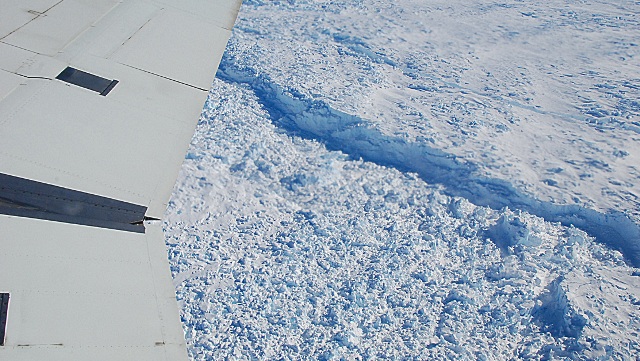
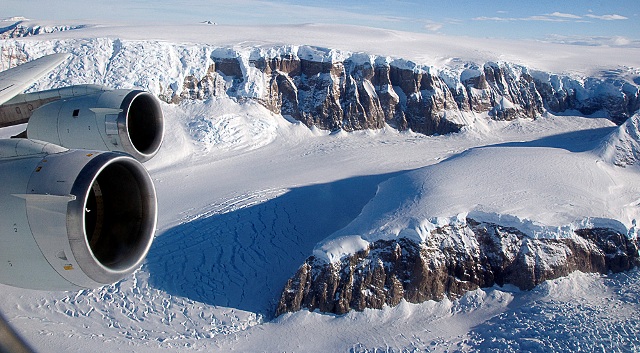
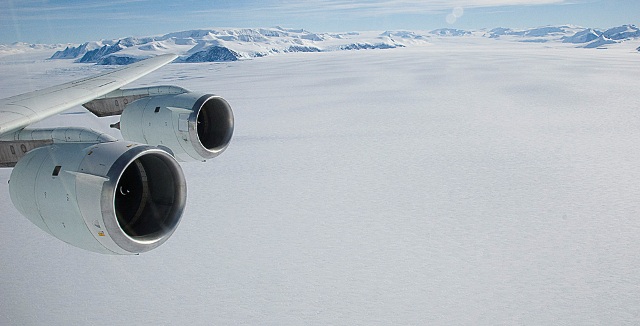
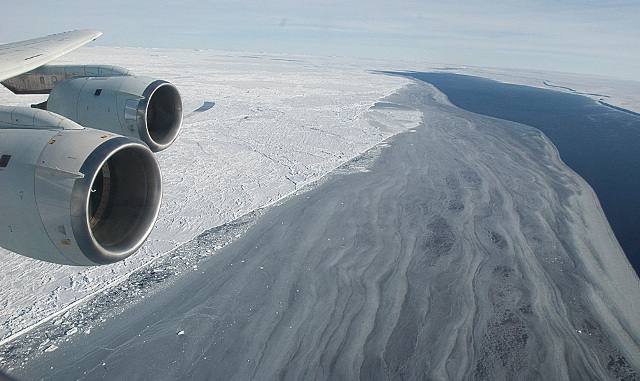
During this time, we collected high-precision measurements of the ice surface elevation of many glaciers and ice shelves in Antarctica. We have also mapped the thickness of the glacier ice and snow cover, have measured the freeboards and snow thicknesses of the sea ice in the Weddell and Ross seas, and have collected gravity measurements that will allow us to estimate how deep the water is beneath the floating glacier tongues.


We have collected an enormous amount of data and are keen to analyze the data together with our colleagues when we are back in our labs. From the analysis of this data we will gain a much more detailed understanding of how the glaciers, ice sheets, and sea ice respond to changes in the climate system.


A project of this size is only possible with the support of many people. We could not have done this without the help and support of our Chilean friends and colleagues in Punta Arenas and Valdivia, the airport and hotel staff, and the many NASA and university people back home who have worked long hours to make this project happen. We thank the National Science Foundation for giving us access to their forecasts. And we appreciate the help and assistance of the forecaster at the British Rothera Base (thanks Tony). For planning our flights, we also acknowledge our use of and dependence on the UCAR/NCAR NSF-supported Antarctic Mesoscale Prediction System. We had terrific aircraft crews both in the air and on the ground as well as excellent science teams.


We all had a great time in Punta Arenas and are looking forward to come back next year for another Ice Bridge campaign over Antarctica.


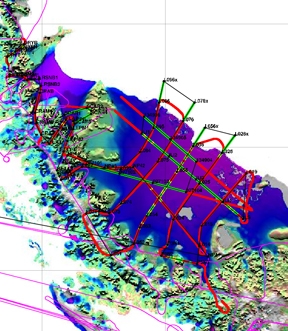
Map shows all the flight lines flown during the Operation Ice Bridge 2009 Antarctic campaign. Created by Michael Studinger.


Flying Low Over Pine Island Glacier


From: Michael Studinger, Lamont-Doherty Earth Observatory, co-principal investigator, gravimeter team


PUNTA ARENAS, Chile – After flying for several hours over a windswept Southern Ocean on Tuesday, Oct. 27, the mission director announces that we will be slowly descending towards Antarctica’s Pine Island Glacier. Just below are the Hudson Mountains, a small group of extinct volcanoes poking through the ice.


As we approach our survey area, John Sonntag with NASA’s Wallops Flight Facility and I watch the navigation display and admire the pilots’ precision as they steer the giant NASA DC-8 aircraft to the start of our first survey line.


We are here to measure the glacier’s ice surface with lasers, its bottom with radar, and estimate the depth of the water below it with an instrument that measures the gravity pull from above the glacier.


All systems are functioning well and we are excited about the data coming in. The computer screen mounted on the University of Kansas’ radar rack is a popular in-flight gathering spot since it provides a real-time view of the radar data that allows us to “see” the bottom of the glacier while we fly over it.


The structures we see are quite amazing and we toss around ideas about what this tells us about how the glacier is responding to warming temperatures. Science can be so much fun! After criss-crossing Pine Island Glacier several times, it’s time to head home to Punta Arenas.


A heavily crevassed area of Pine Island Glacier. Shows you how very difficult it would be to travel and work on the surface of this glacier. Data are best collected from aircraft flying over the glacier or from space.


The calving front of Pine Island Glacier. This is the end of the glacier where pieces of ice break apart from the floating glacier and become icebergs.


Flying at low elevation over the edge of the floating part of Pine Island Glacier. Winds have blown away the sea ice resulting in an area with open water called a polynya. The goal of this flight is to estimate the thickness of the water layer beneath the floating ice shelf from gravity data.


The Hudson Mountains near the edge of Pine Island Glacier are a small group of extinct volcanoes that poke through the ice and make for spectacular scenery.


A One-Day Tour of the Antarctic Cryosphere


From: Michael Studinger, Lamont-Doherty Earth Observatory, co-principal investigator on gravimeter team


PUNTA ARENAS, Chile – The weather forecast for our survey area yesterday, Nov. 16, over the Larsen C Ice Shelf predicted excellent conditions. Given the difficult weather situation over the past couple of days, this was a welcome change. After carefully studying satellite images and computer models and talking to the meteorologist at the Punta Arenas airport, we decided to fly NASA’s DC-8 over Antarctica again.


The flight took us through an almost complete tour of the Antarctic cryosphere. We followed the flow of ice from the interior all the way to the ocean where it ends up as icebergs and eventually melts. We began our tour by flying over small ice caps on the Antarctic Peninsula. The snow and ice that forms these ice caps eventually flows downhill through steep valleys that are occupied by glaciers or ice streams.


Glaciers flowing down steep valleys transport ice from the interior of Antarctica to the Larsen Ice Shelf near the coast.


At one point during the flight I took the seat in the cockpit behind our two pilots to get a better view of the spectacular scenery. We descended into a steep valley that was filled with ice flowing into the remnants of the former Larsen B Ice Shelf that broke apart a few years ago. The ice that’s flowing down through the valleys is pushing the ice in the ice shelves away and eventually huge chunks of ice break off and form icebergs. On the ice shelf the ice goes afloat and forms huge flat surfaces that seem to be endless. Beneath the ice is ocean water. We are here to study how the warm ocean water melts the ice shelf from beneath.


Small caps of stagnant ice cover the summits while the ice in the valley is moving relatively fast towards the coast.


Our next survey line takes us all the way to the edge of the ice shelf where we can see several of these gigantic icebergs floating in the far distance surrounded by sea ice and pockets of open water. After crisscrossing the part of the Larsen C Ice Shelf that is still intact, we head back up to the crest of the Antarctic Peninsula and repeat our mini-tour through the Antarctic cryosphere on a different survey line.


Every time I look out of the window and soak in the spectacular scenery I see an incredibly beautiful but fragile landscape.


We fly over the flat and mostly featureless Larsen Ice Shelf. You can see the steep mountains and glaciers in the background.


We complete our tour of the Antarctic cryosphere at the edge of the Larsen C Ice Shelf where we reach open water and sea ice.


All photos: Michael Studinger


A Splendid Day for Flying Glaciers


From: Kathryn Hansen, Science Writer, NASA Goddard Space Flight Center


A last-minute change in flight plans made for another great science flight on Nov. 4. Initial plans were to make a high-altitude flight, according to program director Jim Yungel of NASA’s Wallops Flight Facility.  But a forecaster in the Punta Arenas airport weather office advised crew of the potential for weather to interfere with the high-altitude measurements for the mission’s LVIS instrument.


With a new flight plan in place, NASA’s DC-8 took off just a few minutes after the scheduled 11 a.m. departure time. The new plan called for low-altitude flights over the Antarctic Peninsula.


“The forecaster was completely correct,” Yungel wrote to colleagues after the flight. “We flew into sunny conditions with occasional very light high cirrus over flight lines, resulting in an outstanding data set over the Larsen Ice Shelf and many impressive glaciers.”


Instruments that collect data at lower altitudes, including the Airborne Topographic Mapper, had a successful 11.3-hour flight.


Much of this flight surveyed a grid over the Larsen C Ice Shelf,” Yungel wrote. “Later in the flight we surveyed several significant glaciers in the central Peninsula area, including the Atlee, Flask, Crane, Hektoria, and Drygalski glaciers. It was a splendid day for flying glaciers!”


Despite the busy flight, Yungel managed to capture these images of the landscape from the aircraft window …


A Challenging Glacier Flight


From: Seelye Martin, Chief Scientist, Operation Ice Bridge

PUNTA ARENAS, Chile — Using the first potentially clear day on the Antarctic Peninsula since we began flights in mid-October, we decided to fly on to targets there on Saturday, Oct. 31.


The DC-8 flight path took us over ice elevation lines surveyed by the ATM laser instrument in October 2008. The path included tracks over the Fleming Glacier, one to the George V ice shelf and a parallel one over Palmer Land, plus a single pass down Crane Glacier. The purpose of these flights will be to study the glacier response to the collapse of the adjacent ice shelves. There was also a long grounding line flown around the inside of the Larson-C Ice Shelf. This was a challenging flight, with large elevation changes.


This map of our actual flight lines (in red) shows that at the most southern point or our flight plan we turned early to get out of the clouds.


About three and a half hours into the flight we flew the survey line down the Fleming Glacier followed by a descent over the Clifford Glacier. We had a beautiful run down Clifford glacier, which was about our steepest descent in the mission. We then headed north over the southern edge of the Larsen-C shelf.


Eight hours into the flight we descended over Crane Glacier into Exasperation Inlet, which is next to Cape Disappointment. The DC-8 pilots say we have a little extra time, so we are going to do a run up Atlee Glacier.


One of the scientists onboard came by with the observation that the remnant of Larsen-B in Carr Inlet was showing signs of breaking loose. This does appear to be the one part of the continent where climate change is actually visible, particularly in the northern ice shelves and glaciers. The removal of the buttressing effect of the Larsen-B has led to a speedup of the surrounding glaciers. We repeated Atlee Glacier, then overflew Palmer Station. With that we climbed up in altitude and headed back to Punta Arenas.


Although we lost the southern end of our flight lines due to clouds, we got all of our northern track. We also took 300 kilometers of track along the grounding line of the Larsen C, covering most of the shelf.


This is my last flight report from Antarctica. I’m rotating out and William Krabill of NASA Wallops Flight Facility will continue as Ice Bridge project scientist for the remainder of our Antarctica 2009 mission.


A nunatak sticking through cloud deck at the southern end of our traverse.


The foot of Crane Glacier, with glacier ice mixed with sea ice to the left, and the glacier to the right. If you look at the rock wall, there is a suggestion of the former height of the glacier and adjacent Larsen B ice shelf. The glacier surface height drop of about 100 meters has been confirmed by repeated laser observations.


Mountains during maneuvering on the Peninsula plateau.