Underflying CryoSat-2 at the North Pole


From: Sinéad Farrell, sea ice team member, Earth System Science Interdisciplinary Center at the University of Maryland

The penultimate sea ice flight to be conducted during phase one of the Arctic 2010 IceBridge campaign was exciting. After days of bad weather and confinement to quarters at Thule Air Base, the flight team was finally able to accomplish the remaining sea ice flights. With only three days left in the campaign, and three sea ice surveys to complete, the pressure was on!

Favorable weather conditions on April 20, 2010, meant that the “Sea Ice 07” flight plan could be attempted. For the ad-hoc sea ice team back home, anticipation was mounting. Several days earlier, on April 8, the European Space Agency (ESA) launched the CryoSat-2 satellite to monitor changes in the thickness of polar ice. By April 11, CryoSat-2’s main sensor — the Synthetic Aperture Interferometric Radar Altimeter (SIRAL) — was turned on and meant that an underflight of CryoSat-2 by the DC-8 and its onboard sensors was possible.

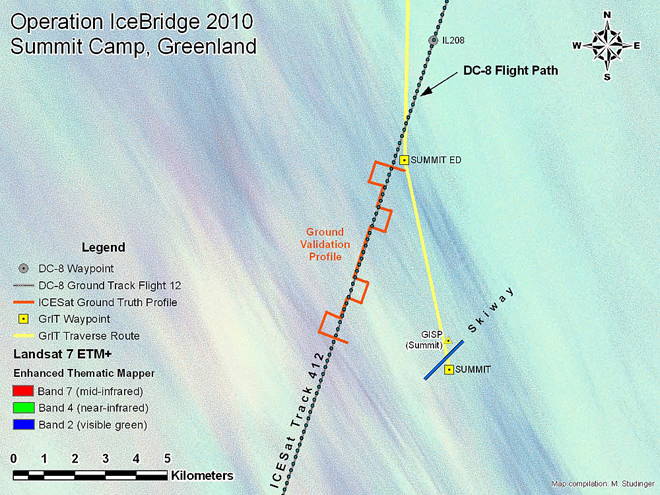
To mitigate against the impact of the drifting sea ice pack, detailed planning and coordination was required to ensure the IceBridge sea ice flight was timed to be coincident with the satellite overpass near-by the North Pole. International collaboration between IceBridge team members at NASA, ESA and NOAA, as well as at a number of academic institutions, ensured the flight was both spatially and temporally coincident with CryoSat-2’s transit across the Arctic Ocean (see map below).


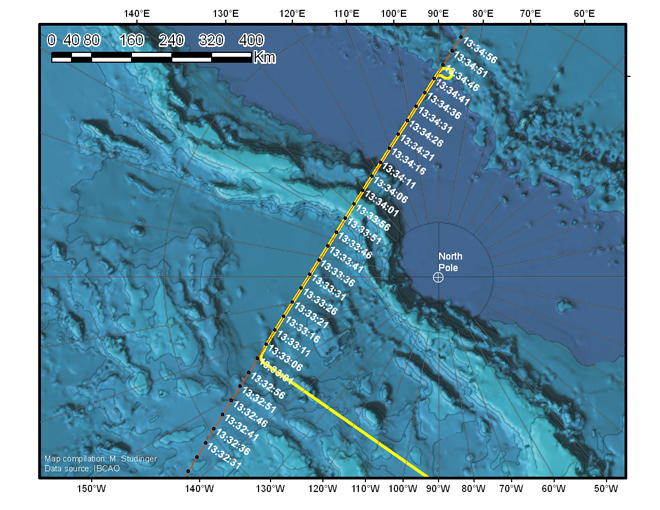
A map of the “Sea Ice 07” flight path, flown on April 20, illustrates the coincident DC-8 flight trajectory (yellow) and the CryoSat-2 orbit (orange) with the times of the satellite over-pass indicated (white). Image is courtesy of Michael Studinger.

Although clouds were encountered en-route to the North Pole, the DC-8 began surveying the CryoSat-2 ground-track just 14 minutes after the satellite passed overhead, in cloud-free conditions. A suite of instruments on the DC-8 including the Land, Vegetation and Ice Sensor (LVIS) and the Airborne Topographic Mapper (ATM) surveyed sea ice elevation along a 465-mile (750-kilometer) CryoSat-2 track at two altitudes: 25,000 feet (LVIS) and 1,500 feet (ATM).

LVIS’s wide swath was particularly suited to capturing the footprint of the satellite’s main sensor. Optical mapping systems, a snow radar, and a gravimeter onboard the DC-8 provided further science data. When analyzed in concert these data provide a valuable baseline for evaluating CryoSat-2’s capabilities for measuring Arctic sea ice thickness.

The flight demonstrated successful collaboration between federal agencies in the United States as well as international cooperation with ESA. Not only did the IceBridge mission carry out the first attempt by aircraft to validate the state-of-the-art radar altimeter onboard CryoSat-2, it contributed to a number of other firsts. The flight marked the most northerly IceBridge survey thus far, utilizing airborne laser and radar altimetry to survey sea ice at a latitude of 88oN. The flight also provided the first opportunity to compare the airborne ATM and LVIS instruments, which use lasers to gather complimentary surface elevation data over sea ice, with a new snow radar system. The sea ice science community looks forward to analyzing the wealth of data gathered during this flight.

Moment of Truth at Summit Camp

IceBridge mission planners plot some flight lines to match the location — and sometimes the timing — of measurements collected on the ground or from satellites. This “ground-truthing” technique helps scientists calibrate and interpret air- or space-based measurements. On April 14, IceBridge flew along a previous track from the Ice, Cloud, and land Elevation Satellite (ICESat), while at the same time scientists at Summit Camp collected ground-based data. Christina Hammock and Sonja Wolter share some images from the event, and provide a look inside the life of a “Summit Camp techie.”

We had been anticipating this flight for almost a month because we were timing some ground-truthing measurements to coordinate with the flight (more below). We had near-daily contact with John Sonntag for a few weeks prior to the flight over Summit Camp. It took a while, but both the weather and the logistics finally came together for the flight on Wednesday, April 14.

Sonja Wolter(right) from Summit Camp in Greenland was working in the field when NASA’s DC-8 passed overhead. Credit: Christina Hammock

Summit Camp is a research station dedicated mainly to atmospheric and climate research. There are only five people on station during the winter months, which is divided into three phases, late August to early November, early November to early February, and early February to late April. During the summer (late April to late August), the station population goes up to 25-50 researchers and support staff (starting a week from today with the arrival of an LC-130 bringing about 25 people – ack!)

Our crew includes a Station Manager — Ken Keenan; a heavy equipment operator — Geoff Miller; a power plant mechanic — Luke Nordby; and the two of us — the Summit science technicians. When we have an involved task like the IceBridge coordination, everyone helps get us out the door.

Gear for the IceBridge and ICESat transect at Summit Station included two snowmobiles, an emergency snow camper, a GPS system and a bamboo pole to make the measurement. Credit: Sonja Wolter

As science techs, we carry out and maintain all the ongoing experiments at or near camp. One of these experiments is the ICESat transect, which is (or was) a ground-truthing measurement for the now-defunct ICESat. The Summit ICESat transect is a zigzagging path of bamboo poles that underlies one of the swaths of the icecap that an ICESat overpass used to include. Once per month, we manually measure the snow depth at the poles and also get exact GPS coordinates at these spots.

To do this, we drive two snowmobiles out and cruise (well, putt putt) along the line poles (at -35 F this week). We don’t know for sure, but we’re guessing the round trip is about 8 miles, and it takes us 2.5 to 3 hours. Although the ICESat instruments are no longer working, we have carried on with the transect measurements to continue the data set for this snow accumulation study. This month’s measurements had the extra bonus of being coordinated with IceBridge for verification of their measurements.

During the winter, the last brush with the outside world (not including the world wide web and telephone, that is) is the Twin Otter flight that comes to pick up the outgoing crew after a week of turnover. So, seeing the NASA DC-8 plane was the first reassurance that people are in fact still out there. Maybe we are geeks, but it was exciting and fun for us to be a part of the IceBridge project.

On April 14, 2010, NASA’s DC-8 flew over Summit Camp, Greenland. Credit: Christina Hammock

When not on the ice, Sonja Wolter works full-time as the operations coordinator for NOAA’s Carbon Cycle/Greenhouse Gases group in Boulder, Colo. Christina Hammock works in Space Science Instrumentation at the Johns Hopkins Applied Physics Lab in Laurel, Md., and formerly worked in the Laboratory for High Energy Astrophysics at NASA’s Goddard Space Flight Center. 

The downward-looking Digital Mapping System camera captured an image of what scientists think is the ground crew from Smmit Camp.Credit: NASA

Yes,It's Cold in Thule

On April 6, the IceBridge blog received a comment from a first-grade class in response to a March 30 post,”Notes from the Shack.” The class asked a series of questions based on Colleen McIntosh’s words and photos from Thule, Greenland, where she is working as a data analyst and programmer in a GPS Shack during NASA’s IceBridge mission. Answers to the class’ questions, below, were compiled by McIntosh.

Students: How cold is it there?

IceBridge: During the time we have been up here the temperatures have ranged from -12 to 35 F. Typically, like just about everywhere, it is colder in the morning and night, and as the sun rises higher in the sky it warms up. However, on average for the last week or so, it has been around 11 F throughout the day.

Students: Does it ever snow?

IceBridge: Yes it does snow here. However, it is extremely cold and dry up here. When the air is very cold there is a lack of water vapor. Snow is of course made of water, so if it is too dry — even though it may be very cold — it is less likely to snow. And if it does snow it doesn’t snow a whole lot. But since it is so cold up here, when it does snow, it takes a very long time for the snow to melt. So there is snow up here that may be from snowfalls months ago, it just hasn’t melted yet!


DC-8 crew members Leo Salazar and Scott Silver in blowing snow on the ramp shortly before takeoff from Thule Air Base to the fifth science flight of Operation IceBridge. Credit: Michael Studinger

Students:
How many people are working with you?

IceBridge: It depends on what you mean by working with me … working on the LVIS instrument, there are five of us (including me). On the IceBridge mission, there are about 70 people, however, they are not all up here at once. On average there about 30 people in the IceBridge group in Greenland at one time during this mission. And out of all of those 70 people, only SIX are women!! Also on the entire Air Base in Thule, including contractors, natives, and Air Force people, there are only about 400 to 500 people, only about 75 are women! Oh and there are also children up here as well, most are the native Greenlandic children, but there are a few children who are visiting their mother or father who are stationed up here in the Air Force.

Students: Is it ever springtime there?

IceBridge: They do have all four seasons up here, however spring and fall are very very short compared to winter and summer. During the summer and winter there are about three months where they have either “24 daylight” or “24 nighttime.” And then for about a month before and after winter and summer, it is either quickly getting dark or quickly getting light. And then for around a month or so in fall and spring there is “normal sunlight time.”

Students: Is that mountain made of ice?

IceBridge: No, Dundas Mountain is made out of rock and dirt, just like mountains we have in the United States. It is just surrounded by and topped with a lot of snow and ice this time of year. You can climb the mountain when it is warm enough, but it is a very hard climb. Toward the top there is even a rope to help you pull yourself up the rest of the way up the mountain because it becomes very steep!

Students: How tall is that mountain?

IceBridge: The mountain is about 700 feet high

Sled dog race in Thule, Greenland, with Dundas Mountian in the background. Credit: Michael Studinger

Students: How far away from where you are standing is the mountain?

IceBridge: It is about 1.5 miles to Dundas Mountain from the GPS shack.

Students: Why does the sun look so big and so close to the Earth?

IceBridge: When celestial objects, like the sun and the moon, they get closer to the horizon and they “appear” bigger. However, this is just an optical illusion. The fact is that the illusion is dependent entirely on the visual cues provided by the terrain when the moon is near the horizon, and the lack of such cues when it’s at the zenith (directly above our heads). To prove this, try viewing the moon through a cardboard tube or a hole punched in a sheet of paper to mask out the landscape — the illusion disappears.

This time of year time of year the sun stays in the sky for almost 24 hours. Come April 17, the sun will not set here for the next three months. This is because of the way the Earth is tilted. Right now the Earth is tilting toward the sun, and because Greenland is just about at the top of the world, the Earth’s top always sees the sun. But something to note is that although the sun does not set for three months, the temperature still only reaches 60 degrees at its hottest!

Students: How do you make electricity?

IceBridge: There are several diesel generators that power the entire base. Also on the base are several cylindrical containers that hold the fuel for the airplanes that land and take off from this base. There used to be a lot more containers, but now that the base isn’t used as much as it was in the 1950s and 1960s, they have taken out these containers.


The IceBridge Routine

From: John Sonntag / ATM Senior Scientist and IceBridge Management Team

Working in the field with Operation IceBridge, we think that every day we fly is exciting. We’re soaring above the stupendous Greenland Ice Sheet, spectacular outlet glaciers, or ever-changing, always mesmerizing polar sea ice, after all. These are not the kinds of settings most people get to call their “office” every day. On top of that we’re making important contributions to knowledge about a part of our world which is important to the future of all mankind, with every mile we fly. It’s good stuff, a dream job for many of us.

But there is no denying that even the unique can become routine after a while. We are now more than three weeks into our deployment in Greenland. As I write this we are conducting our 11th flight of the campaign, part of a four-mission effort to survey the lower Northeast Greenland Ice Stream in unprecedented detail. And things are going smoothly and well. They are going so well, in fact, that many of the scientists and engineers are battling drowsiness as they monitor their instruments, and those who are off-duty are often napping.

University of Kansas snow radar engineer Ben “Blitzkrieg” Panzer monitors his instrument (well, we think). He’s not nearly as intimidating as he looks. Note the first-class airline-style seats, too. Every experimenter has one, and they’re comfy. Image is courtesy of John Sonntag.

We sometimes fly visitors on these flights, and occasionally they’ll express surprise to see so little apparently going on. There’s no chatter on the intercom system and not much movement aft of the flight deck (where I can assure you our flight crew is wide awake and probably chatting merrily). But some of us on board have years of experience with research flying, many hundreds of flights in my case, and we know and appreciate days like this. The lack of apparent activity indicates that nothing is going wrong! On board these flights, if you see a flurry of activity, people rushing around, or the like, it usually means something bad happened. It might be engineers rushing to replace a failed hard disk where science instrument data was being funneled. It could be that weather over the science target was poorer than expected, and we are scrambling to put together an alternate plan to deal with the situation. Or perhaps somebody’s lunch just boiled over in the microwave and made a mess.

But when things go smoothly, the appearance is one of calm, quiet, even boredom. The boredom is often real, believe me, especially 11 long flights into a campaign. But the instruments are still working and recording their data, the airplane is flying smoothly, and all is well in the Operation IceBridge world. I like days like this.


DC-8 data systems engineer Eric Buzay always looks productive. I’ve never seen this guy take a nap.Image is courtesy of John Sonntag.

Notes from the Shack: On Receivers and Data Processing

From: Colleen McIntosh, data analyst/programmer, Sigma Space/NASA’s Goddard Space Flight Center

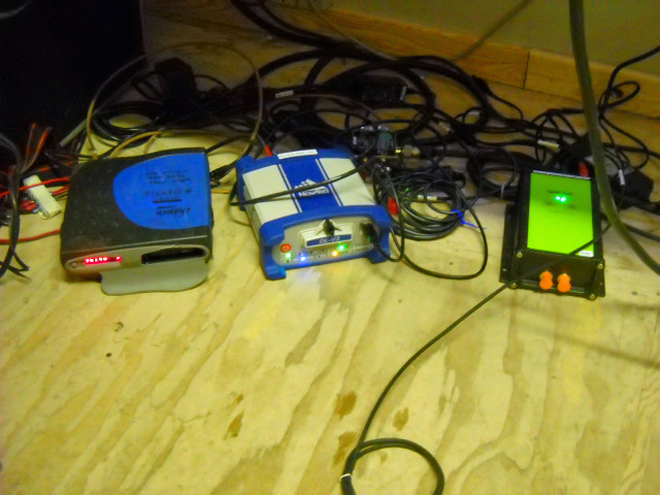
Staying on the ground as part of the GPS base station crew, there isn’t a whole lot to do as far as maintaining the receivers. The Land, Vegetation, and Ice Sensor (LVIS) team has three receivers, all different. We have a Javad which records data at 20 hertz, a Novatel which records data at 10 hertz and an Ashtech which records data at 2 hertz. These receivers are running all day every day.

Running receivers at different frequencies is somewhat of an experiment. The higher the frequency the more data points you get and, theoretically, the better the results. We are just testing that theory to figure out the best rate for LVIS.

I check on the receivers twice a day: once in the morning before the flight takes off, and then again an hour after the plane lands. The most important data, of course, is taken while the plane is in flight. The remaining data is used to get the most accurate position of our base station possible. Inside the collected data file are coordinates, which should be the same from day to day, but nothing is perfect, so they are slightly different. We take an average of the coordinates, and I use those values when processing the data.

It may seem that I only do something before and after the flight, but while the plane is in flight I process the data collected from previous days. The internet is rather slow up here, so sometimes processing can take some time.