From: Kathryn Hansen, NASA’s Earth Science News Team/Cryosphere Outreach Specialist
 KANGERLUSSUAQ — There was a rumor that the flight on Friday, May 10, would be among the most scenic of the 2010 Arctic campaign. The high-priority flight along Greenland’s southeast coast required clear weather for pilots to maneuver along the sinuous glaciers at low altitudes. We were fortunate. The first opportunity to fly from Kangerlussuaq with the P-3 on this Arctic 2010 campaign turned up clear skies and relatively balmy temperatures, and we lifted off for Geikie Plateau shortly after 8 a.m.
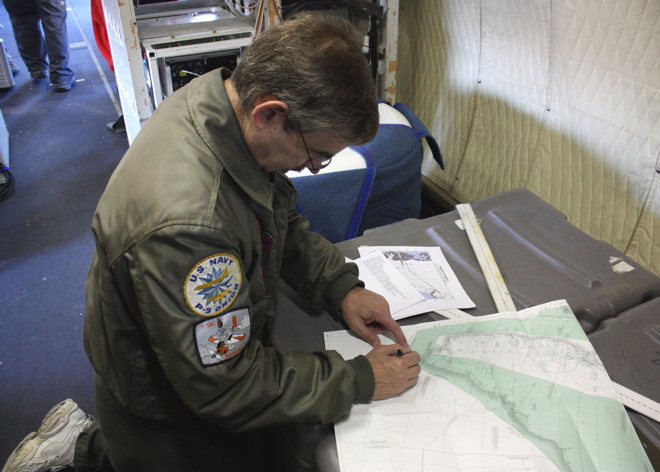
Why Geikie? The plateau is “dynamically isolated” from the rest of the ice sheet. That means what happens to the main ice sheet is not necessarily also happening to Geikie. So, IceBridge scientists want to collect Geikie’s vitals — ice thickness, surface elevation, bedrock profile — and compare them with the rest of the ice sheet. “They’re potentially doing very different things, which can tell you something about climate’s impact on the region,” said John Sonntag, Senior Scientist with the ATM laser instrument and IceBridge management team member.
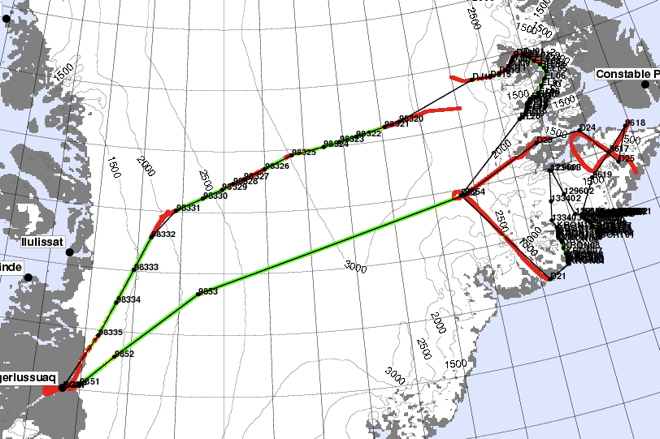
The survey of Geikie Plateau called for about eight hours of total flight time. Credit: NASA/John Sonntag
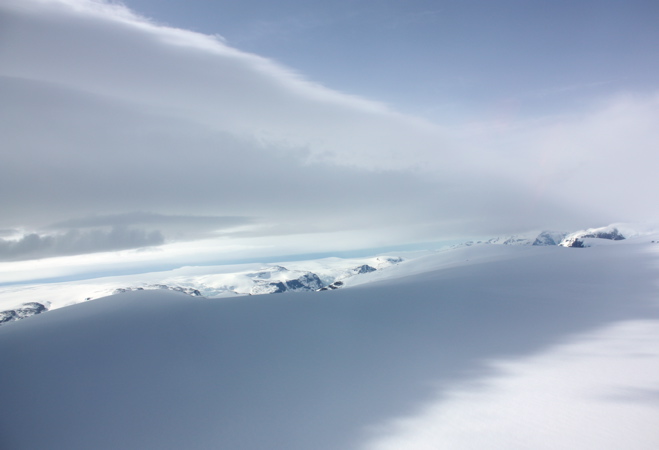
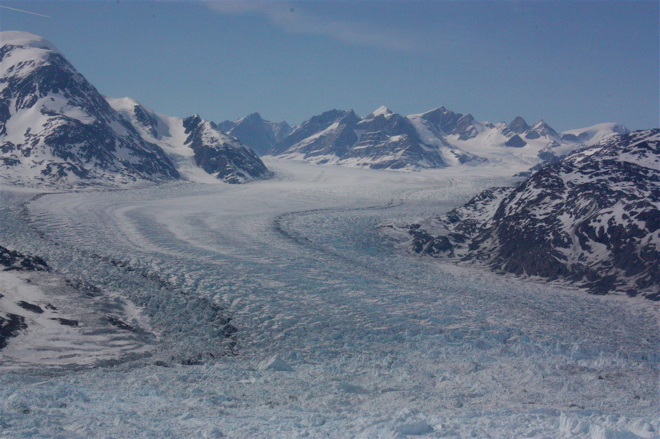
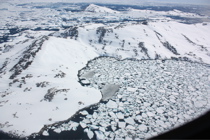
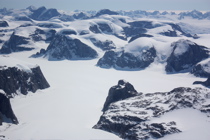
Observing from one of the P-3’s few windows, I was struck by the scale of the landscape. As we closed in on the southeast coast, the flat barren ice sheet soon mingled with occasional hills and then steep mountains with sharp peaks. Ice appeared to be making its escape, flowing down valleys and merging with the glacial superhighway. Some glaciers terminated in cliffs half a mile high. For others, all that remained were the brown, silty remnants.

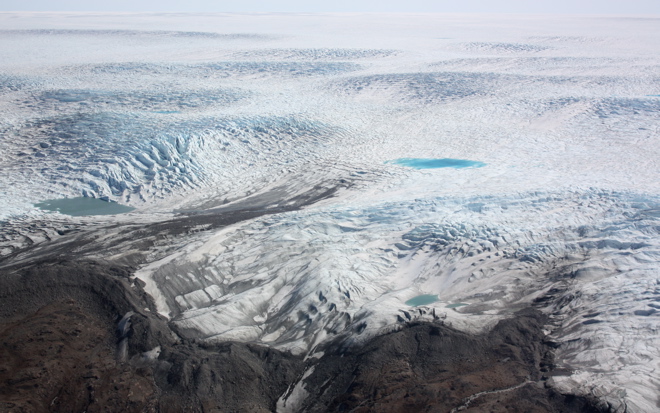
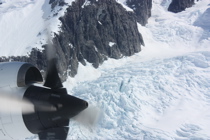
Ice works its way down between mountains before joining a larger glacier. Credit: NASA
At the same time that I was making my visual inspection, however, IceBridge instruments were collecting a more scientific type of information. Lasers mapped the surface while radars dove down for a look below. Will scientists find that Geikie indeed acts in isolation? They’ll have a better idea after deciphering and analyzing the data. In the meantime, the IceBridge team is plotting to visit a few other isolated ice sheets throughout the mission — if time and weather permit.
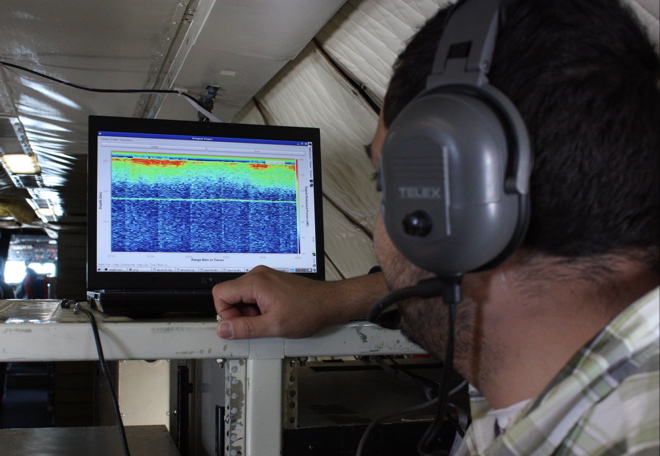
The Multichannel Coherent Radar Depth Sounder instrument shows ice characteristics at depth and also the shape of the bedrock below (thin green line). Credit: NASA

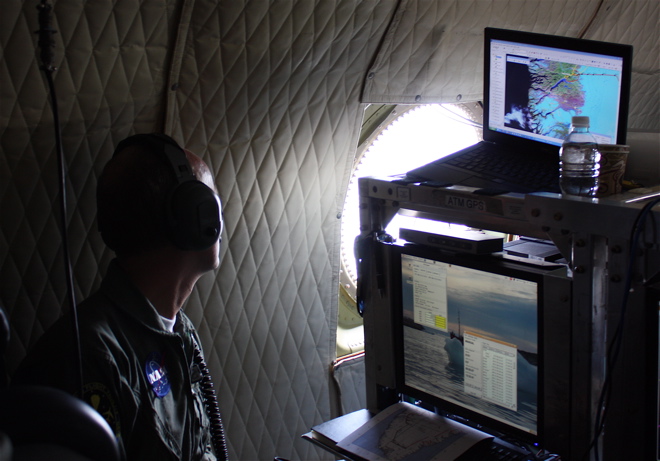
 My involvement with Operation IceBridge comes from a desire to better understand the polar climate and the climatic changes that are evident there. I have been working with NASA through the last five years as a system engineer for the Constellation project, while working to complete my doctoral dissertation in Aerospace Engineering Sciences at the University of Colorado in Boulder. I have also been recently involved with airborne remote sensing and LiDAR systems by completing a three year, NASA-funded research campaign that involved flying a small Mooney M20K aircraft to the Northwest Territories, Canada to better understand noctilucent clouds through synchronized observations with NASA’s Aeronomy of Ice in the Mesosphere (AIM) satellite.
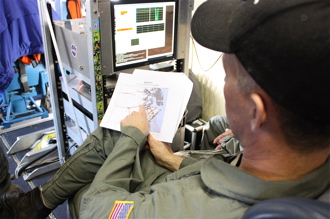
 During an IceBridge science flight, a GPS instrument onboard collects measurements of the aircraft’s position. Scientists later combine the positional information with other data, such as surface elevation from the
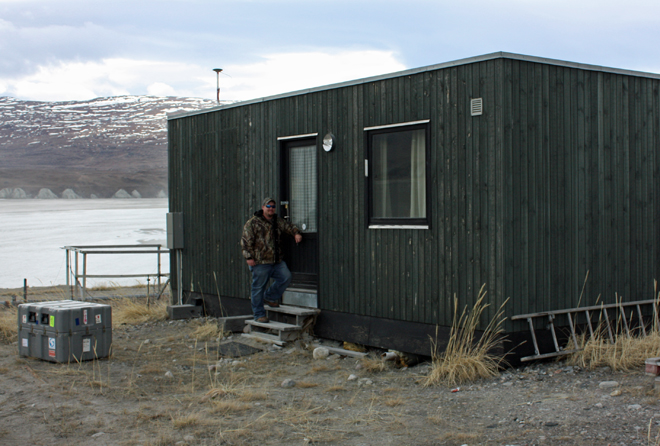
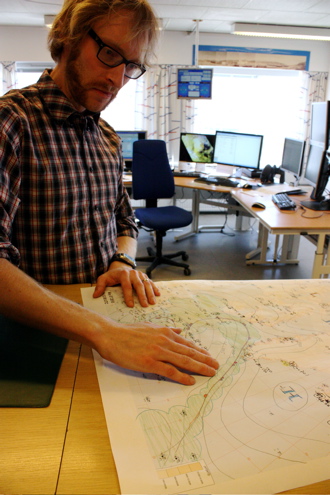
 Scientists have long been tracking Greenland’s outlet glaciers, yet aspects of glacier dynamics remain a mystery. One school of thought was that glaciers react to local forces, such as the shape of the terrain below. Then, researchers noticed that glaciers in different regions were all thinning together, implying a connection beyond local influences. Scientists have posed theories about what that connection might be, but the jury is still out.
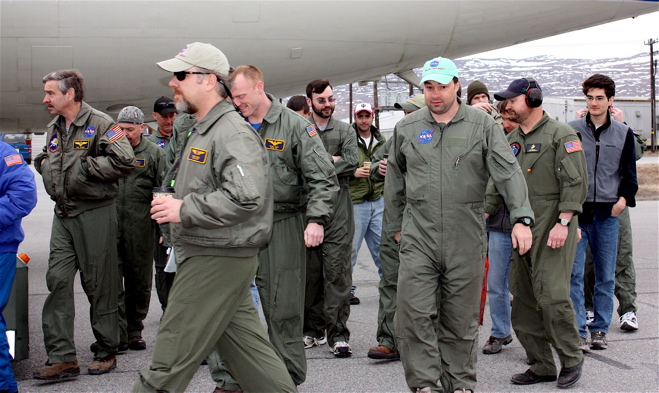


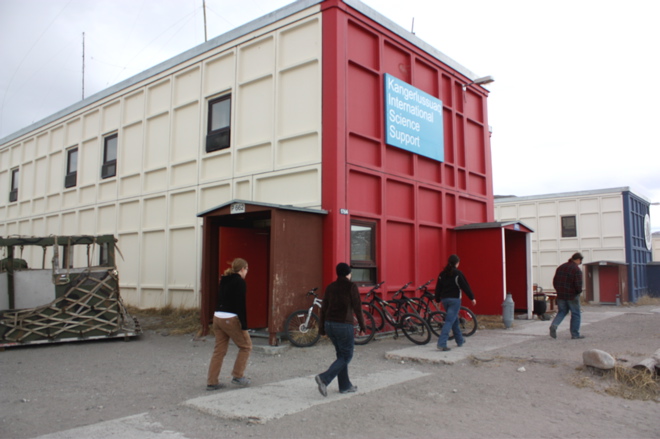
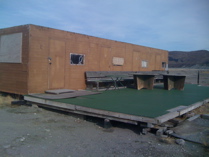
 KANGERLUSSUAQ – Kangerlussuaq International Science Support is a red, boxy building that doubles as a laboratory and a hotel for polar researchers. Upon my arrival it was quiet, nearly empty. By the end of the week, however, an influx of scientists staging field expeditions quickly filled the kitchen and halls.
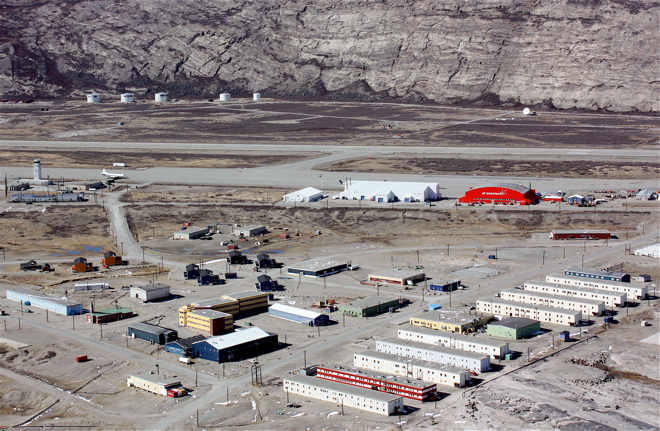

 KANGERLUSSUAQ — IceBridge flight planners woke this morning to news that volcanic ash from Iceland had moved over almost half of Greenland, blocking flight lines to survey outlet glaciers along the southeast coast. In response, the team came up with a shortened flight plan that called for limiting the mission to western targets.