Scientific Snapshots: Using IceBridge Data in the Field

By George Hale, IceBridge Science Outreach Coordinator, NASA Goddard Space Flight Center

Every IceBridge flight adds to a growing collection of geophysical data. Gigabytes of information on surface elevation, ice thickness and sub-ice bedrock topography are collected, but collecting the data is only the beginning of the job. After each campaign, information is downloaded from the instruments and processed to be delivered to the National Snow and Ice Data Center in Colorado, who store IceBridge data and make it freely available to the public.

Preparing data to send to NSIDC is a long and painstaking process, usually taking about six months. Before even starting data processing for the Airborne Topographic Mapper, IceBridge’s laser altimeter instrument, it’s necessary to calculate aircraft position and attitude and even mounting biases on ATM’s laser itself. “Once all the calibrations take place, the processing of all the ATM lidar data can take place,” said ATM program manager Jim Yungel. After that, processing to remove returns from clouds and ice fog and quality checking takes place. And because there are two ATM lidars, one narrow-band and one medium-band, this process is done twice and the results are compared.

But sometimes researchers want a visual representation of something interesting in the field. By combining lidar data with rough GPS trajectories and information from the aircraft’s inertial navigation system, researchers like Yungel can use a custom-built graphics program to create visual representations of the ice. These snapshots of the surface aren’t meant to be precise, but to give IceBridge scientists a rough idea of what was seen, and when combined with images from the aircraft’s Digital Mapping System, it’s easy to see side-by-side, a representation of what information the instruments collect. Below are a few representations of features seen during 2012 Antarctic campaign flights.

A graphical representation of processed Airborne Topographic Mapper data.
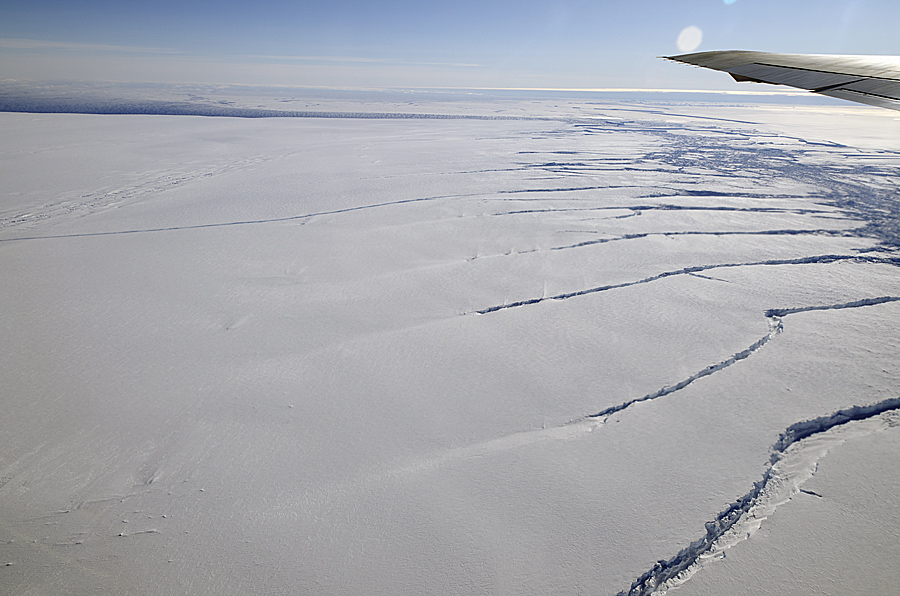
A graphical representation of processed Airborne Topographic Mapper data from the 2011 Antarctic campaign showing the rift in Antarctica’s Pine Island Glacier. Credit: NASA / ATM Team


Animation showing ATM data representation of Pine Island Glacier rift and images from the Digital Mapping System
Animation showing a 2012 ATM data representation of Pine Island Glacier rift and images from the Digital Mapping System. Credit: NASA / ATM and DMS teams


Crevasses in a glacier seen from the DC-8 near the Ronne Ice Shelf on Nov. 1.
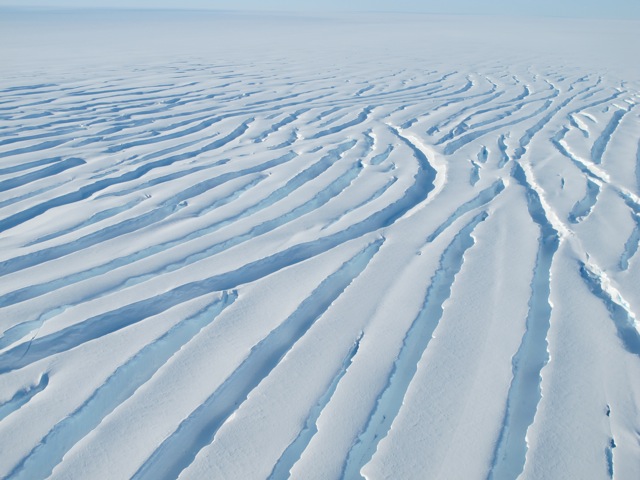
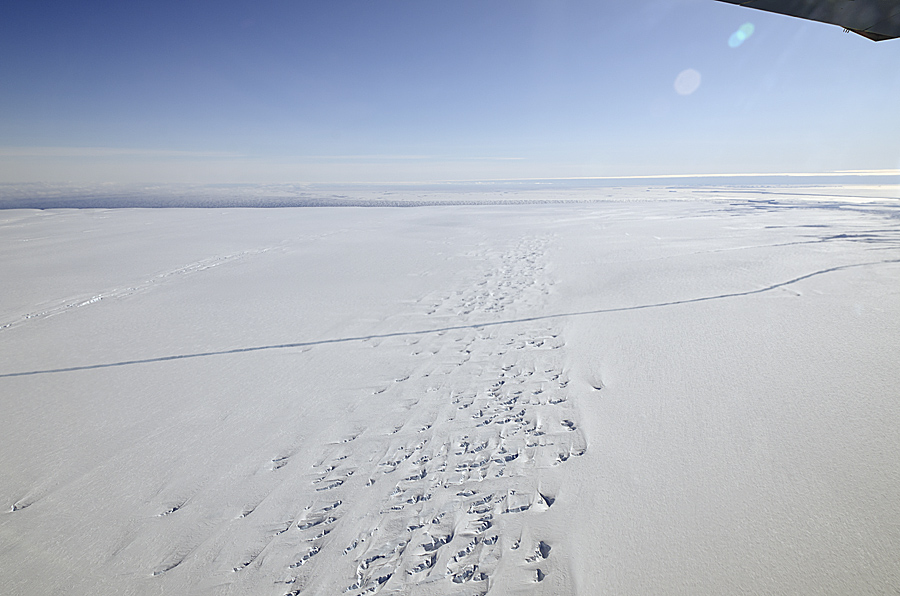
Crevasses in a glacier seen from the DC-8 near the Ronne Ice Shelf on Nov. 1. Credit: NASA / Jim Yungel
ATM data representation of the glacier crevasses seen on the Nov. 1, 2012 flight.
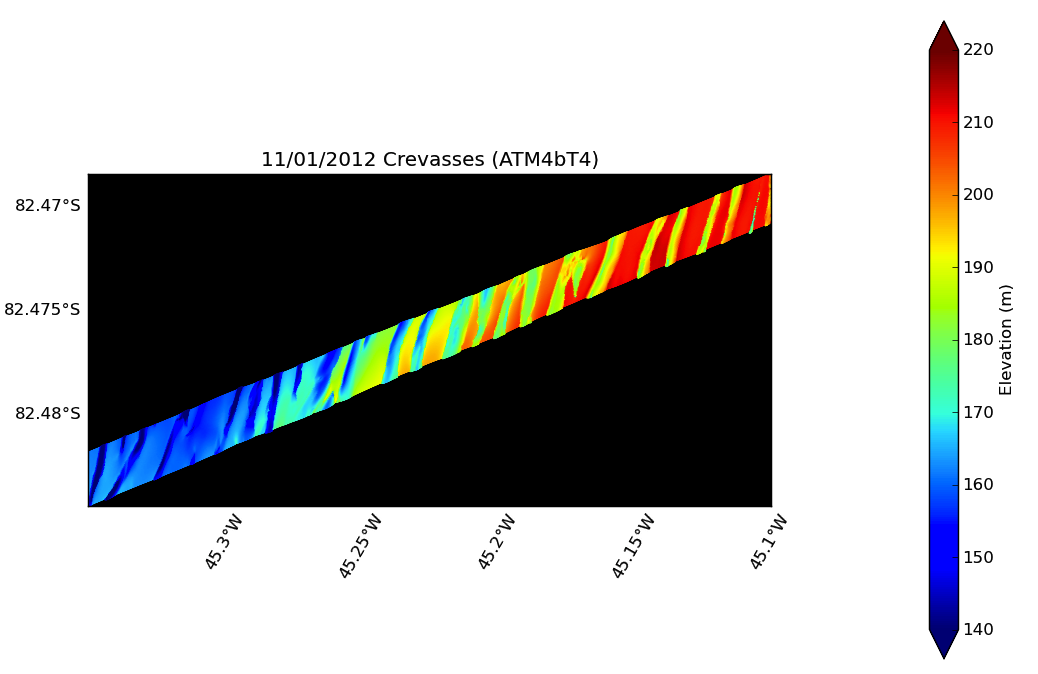
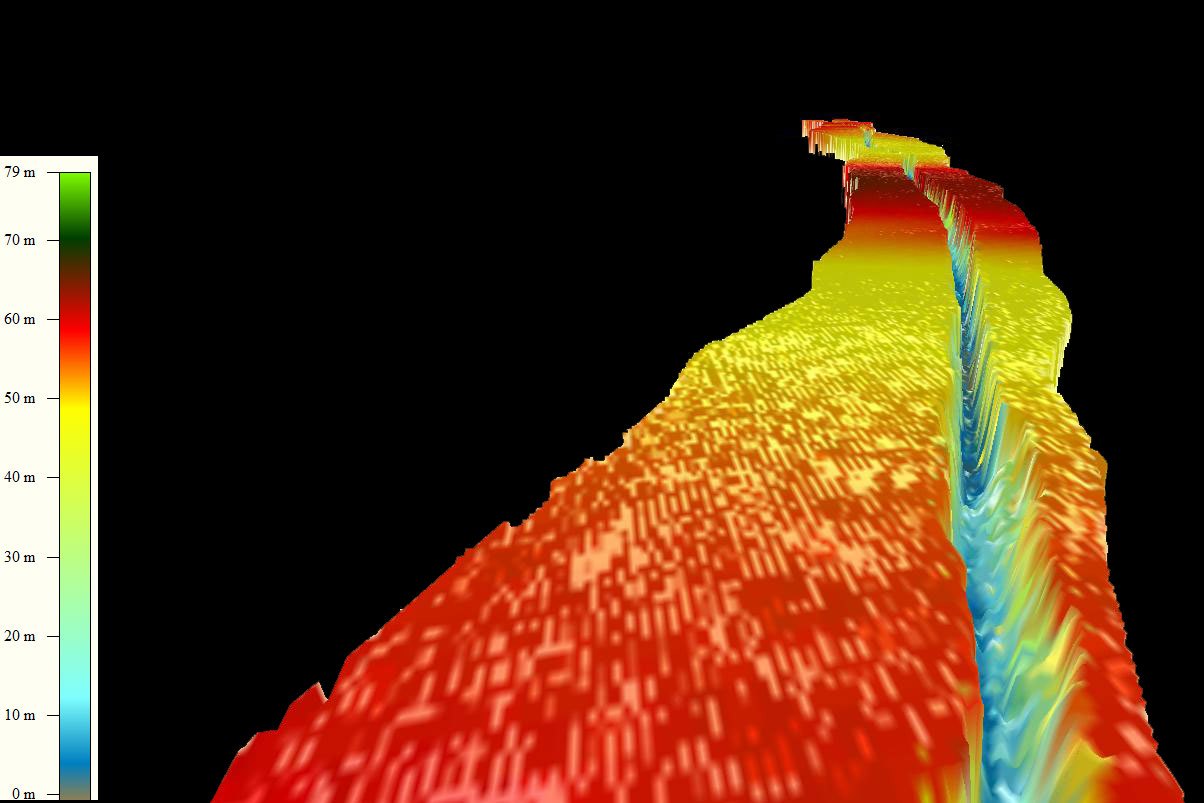
ATM data representation of the glacier crevasses seen on the Nov. 1, 2012 flight. Credit: NASA / ATM

A Crack in the Pine Island Glacier Ice Shelf

A crack runs across the floating ice shelf of Pine Island Glacier in Antarctica, seen from NASA’s DC-8 on Oct. 14, 2011. Credit: Michael Studinger/NASA

Note: IceBridge flew a second mission to the Pine Island region on Wed., Oct. 26. Look for more imagery of the crack coming soon. To see more pictures from the Oct. 14 flight, go to the NASA_ICE flickr page.

After more than two weeks of successful flights over Antarctica and its surrounding waters and sea ice, one of the more interesting things NASA’s Operation IceBridge team has seen this year is a large crack running across the floating ice shelf of Pine Island Glacier. The team observed the crack on the DC-8’s Oct. 14 flight. The flight was designed to get better measurements of the region around the ice shelf’s grounding line — where the shelf meets the landmass under the water. It was also flown to collect data along lines that a ground-based expedition will traverse in the coming months. 

That data was collected, as expected. What wasn’t expected was the crack.

Pine Island is one of the largest and fastest-moving glaciers in Antarctica. It has captured scientists’ attention for years because of the rate at which its ice is thinning. The ice shelf thins, the grounding line retreats and the speed of the glacier increases. As it sits on bedrock below sea level — West Antarctica is the last place with such so-called “marine glaciers” — and drains about 10 percent of the West Antarctica ice sheet, scientists are concerned about the impact Pine Island’s continued thinning will have on sea level.

Ice shelves naturally calve icebergs to shed ice that flows from the landmass to the sea. However, given Pine Island’s prominence as a target of study for glaciologists, the crack is at the very least an interesting observation.

“It’s part of a natural cycle, but it’s still very interesting and impressive to see up close,” said IceBridge project scientist Michael Studinger. “It looks like a significant part of the ice shelf is ready to break off.”

The IceBridge team made a preliminary calculation that the area that could calve in the coming months covers about 310 square miles (800 square kilometers), Studinger said.

The team on the DC-8 observed the crack running across the breadth of the ice shelf. Credit: Michael Studinger/NASA

Peter Rejcek, Editor of The Antarctic Sun, wrote a piece about the crack that notes its location is about nine miles north of where a largely National Science Foundation-funded team, led by Bob Bindschadler of NASA’s Goddard Space Flight Center, will drill this December and January. The team will put instruments below the ice shelf to provide data about ice sheet-ocean dynamics.

Rejcek writes:

Bindschadler had previously calculated the propagation of earlier iceberg-releasing cracks at less than 50 meters per day. This crack must have moved much faster across the ice shelf, he said via e-mail.

“The characteristics of the PIG crack that I find surprising are the fact that it is so far across the ice shelf after not having been observed up until the end of last season,” he said.

The location of the crack is near where past rifts have appeared in the ice shelf, according to Bindschadler. He estimated that a new, rather large iceberg will probably form in the coming months, if not weeks.

“I hope that our field team will have enough time to get onto the ice shelf and set up GPS receivers before the calving event,” Bindschadler said. “We’d like to measure if the ice shelf notices the loss.”

Ted Scambos, lead scientist at the Boulder, Colo.-based National Snow and Ice Data Center, agreed that it’s likely that the crack is part of a natural cycle.

“These are cyclical, occurring every few years, very similar in size and even shape,” said Scambos via e-mail. “As a cyclical process, they are not part of the real climate-change/ice-shelf disintegration story.”

In 2002, the Larsen B Ice Shelf on the eastern side of the Antarctic Peninsula disintegrated in spectacular fashion, losing about 3,250 square kilometers of ice in a single season. More recently, the Wilkins Ice Shelf on the western side of the peninsula has started to collapse. Scientists believe both events are linked to climate change, though some researchers have suggested that wave action from distant storms could have helped break up the Wilkins Ice Shelf.

“If something different happened this time; for example, the pace of calvings changed, or this one was farther upstream from the past ones, then it might signal some major change in the Pine Island system,” said Scambos, adding that the area is changing in other ways, but the rate of calving has been steady over the last few decades.