A Crack in the Pine Island Glacier Ice Shelf

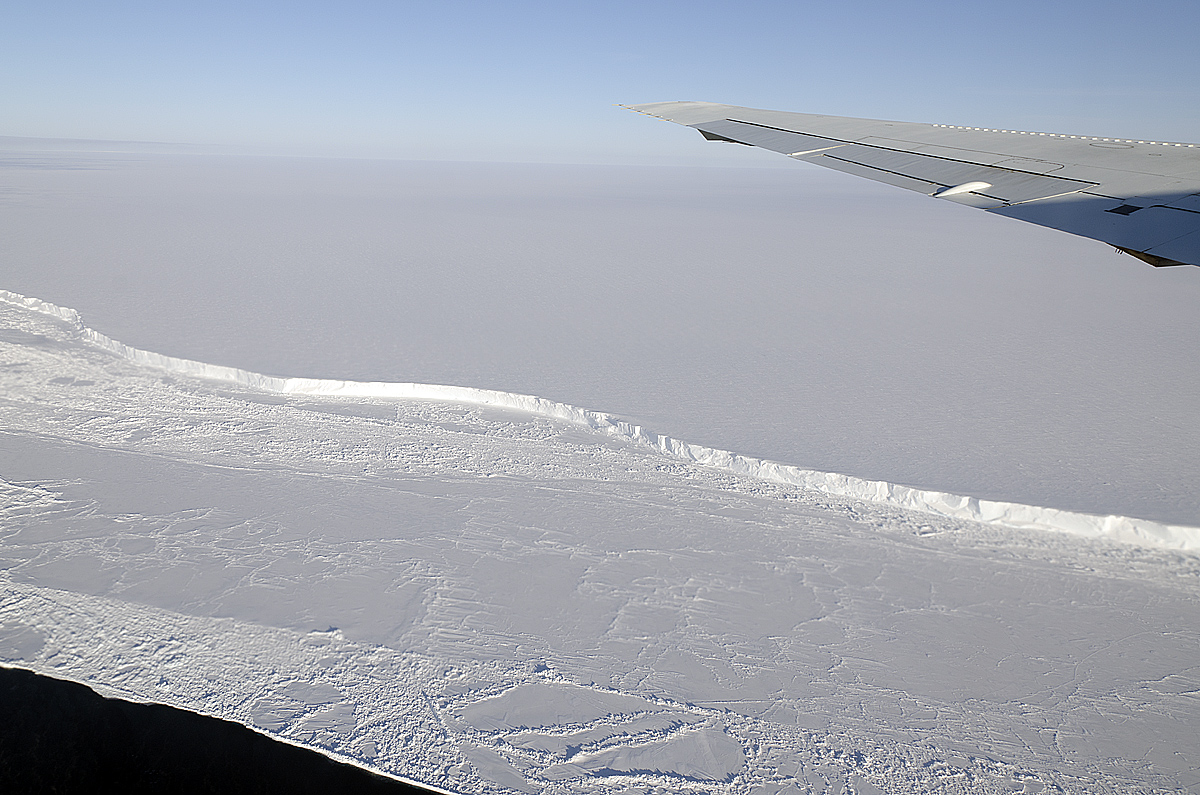
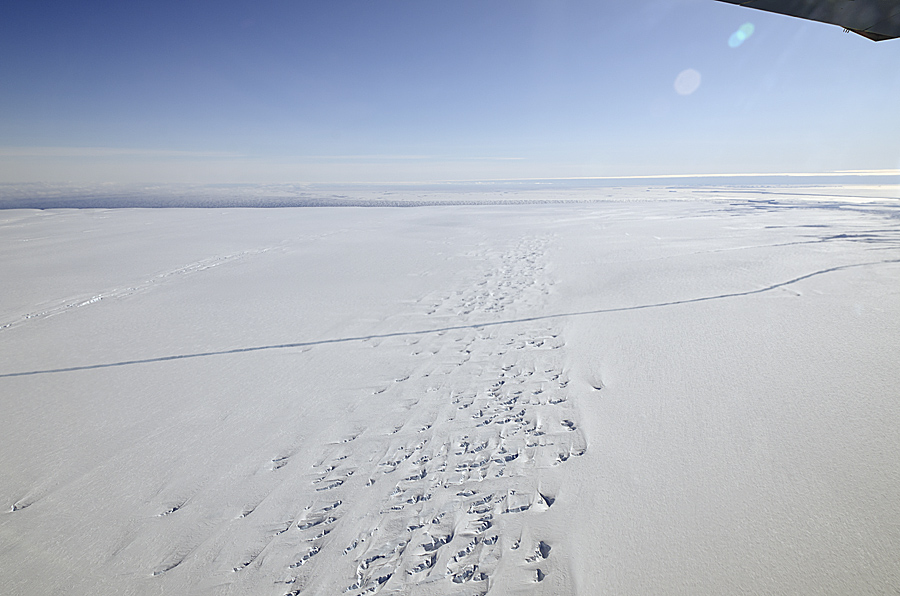
A crack runs across the floating ice shelf of Pine Island Glacier in Antarctica, seen from NASA’s DC-8 on Oct. 14, 2011. Credit: Michael Studinger/NASA

Note: IceBridge flew a second mission to the Pine Island region on Wed., Oct. 26. Look for more imagery of the crack coming soon. To see more pictures from the Oct. 14 flight, go to the NASA_ICE flickr page.

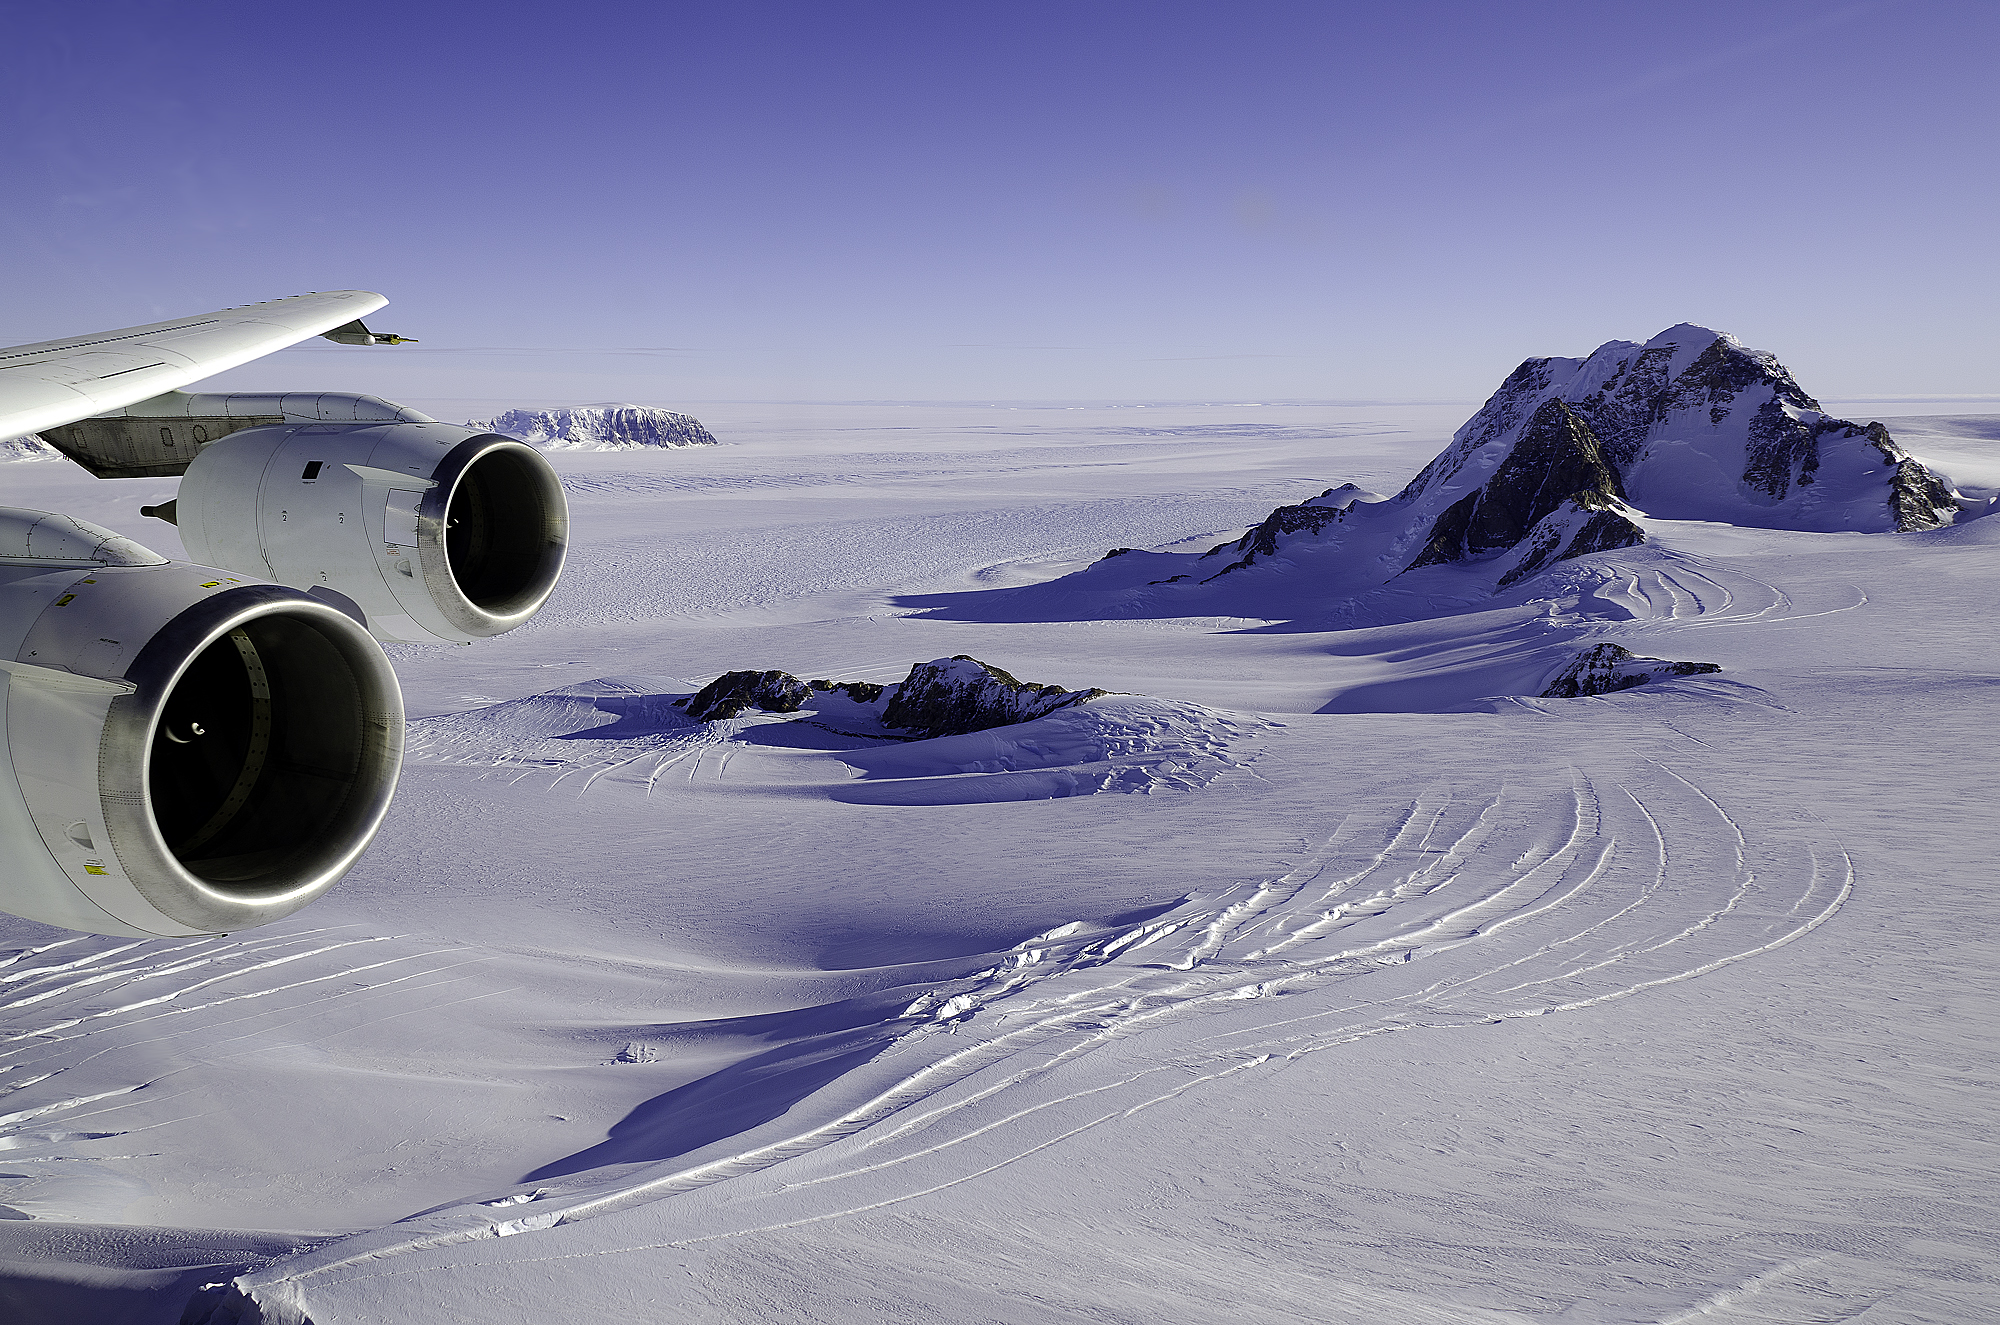
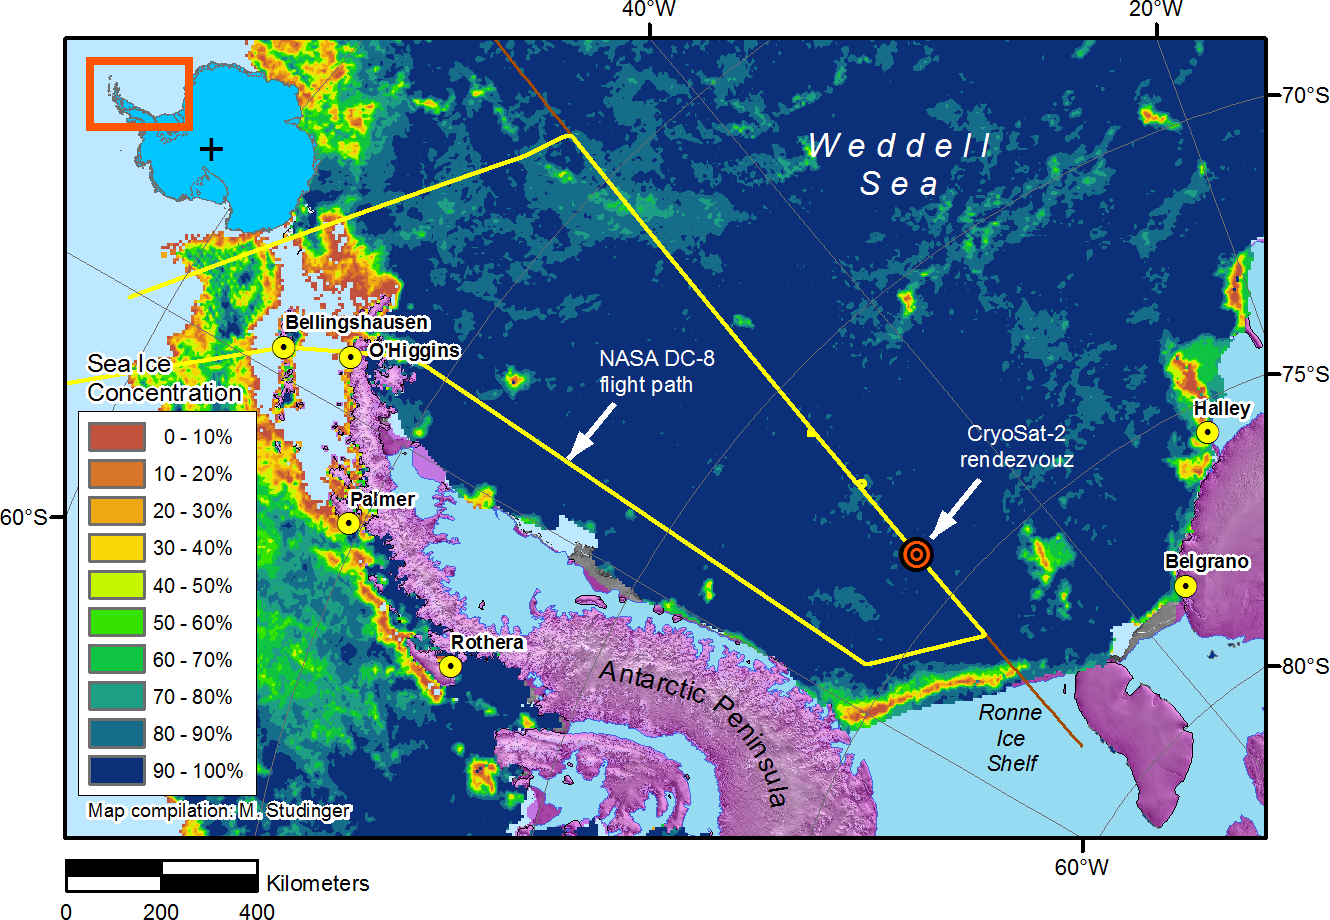
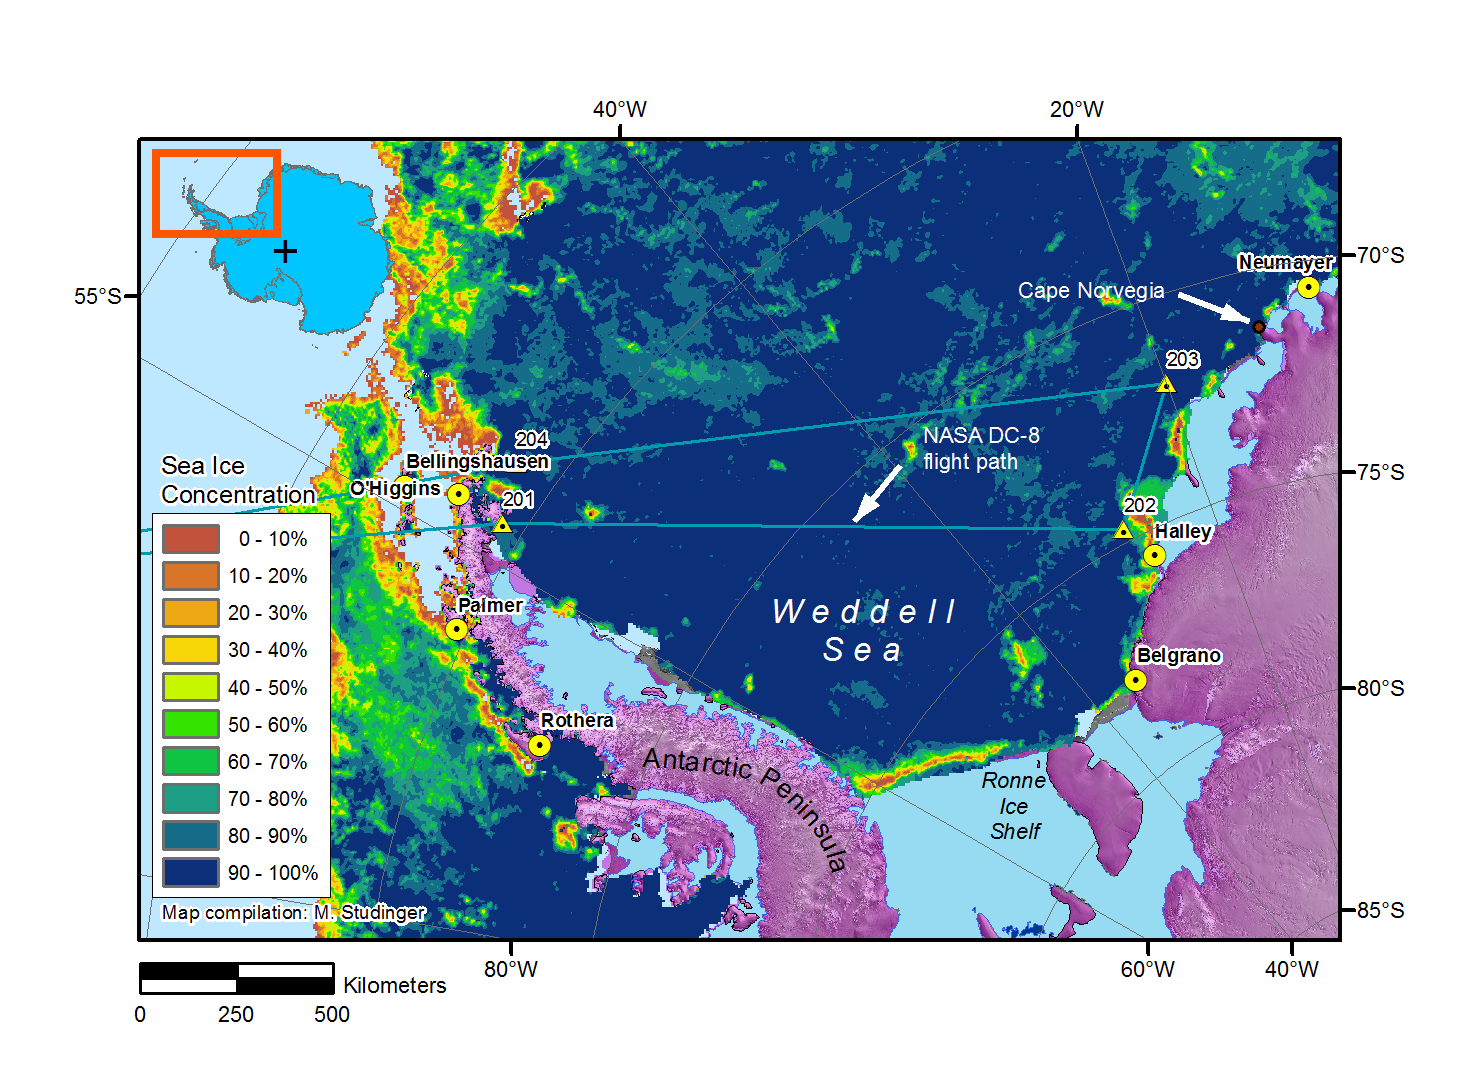
After more than two weeks of successful flights over Antarctica and its surrounding waters and sea ice, one of the more interesting things NASA’s Operation IceBridge team has seen this year is a large crack running across the floating ice shelf of Pine Island Glacier. The team observed the crack on the DC-8’s Oct. 14 flight. The flight was designed to get better measurements of the region around the ice shelf’s grounding line — where the shelf meets the landmass under the water. It was also flown to collect data along lines that a ground-based expedition will traverse in the coming months. 

That data was collected, as expected. What wasn’t expected was the crack.

Pine Island is one of the largest and fastest-moving glaciers in Antarctica. It has captured scientists’ attention for years because of the rate at which its ice is thinning. The ice shelf thins, the grounding line retreats and the speed of the glacier increases. As it sits on bedrock below sea level — West Antarctica is the last place with such so-called “marine glaciers” — and drains about 10 percent of the West Antarctica ice sheet, scientists are concerned about the impact Pine Island’s continued thinning will have on sea level.

Ice shelves naturally calve icebergs to shed ice that flows from the landmass to the sea. However, given Pine Island’s prominence as a target of study for glaciologists, the crack is at the very least an interesting observation.

“It’s part of a natural cycle, but it’s still very interesting and impressive to see up close,” said IceBridge project scientist Michael Studinger. “It looks like a significant part of the ice shelf is ready to break off.”

The IceBridge team made a preliminary calculation that the area that could calve in the coming months covers about 310 square miles (800 square kilometers), Studinger said.

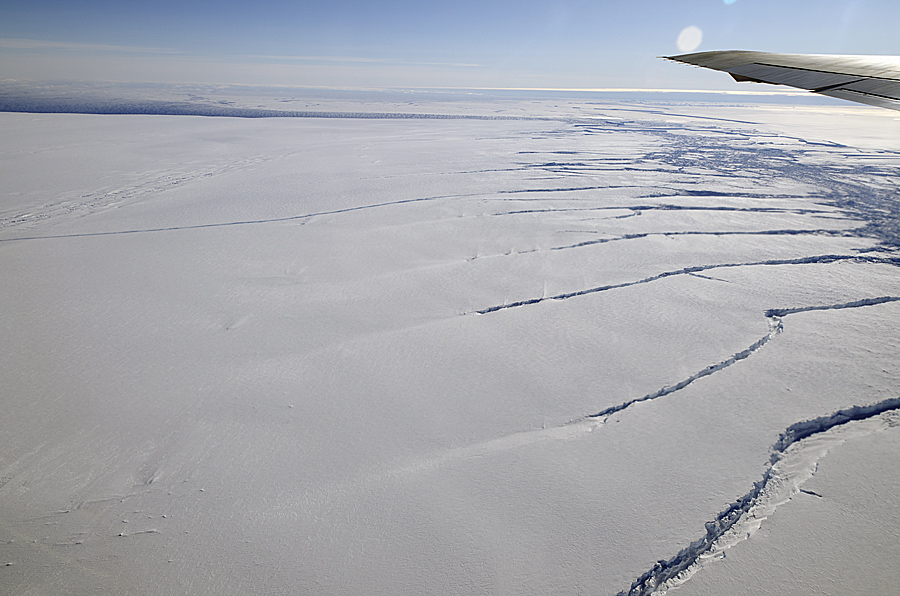
The team on the DC-8 observed the crack running across the breadth of the ice shelf. Credit: Michael Studinger/NASA

Peter Rejcek, Editor of The Antarctic Sun, wrote a piece about the crack that notes its location is about nine miles north of where a largely National Science Foundation-funded team, led by Bob Bindschadler of NASA’s Goddard Space Flight Center, will drill this December and January. The team will put instruments below the ice shelf to provide data about ice sheet-ocean dynamics.

Rejcek writes:

Bindschadler had previously calculated the propagation of earlier iceberg-releasing cracks at less than 50 meters per day. This crack must have moved much faster across the ice shelf, he said via e-mail.

“The characteristics of the PIG crack that I find surprising are the fact that it is so far across the ice shelf after not having been observed up until the end of last season,” he said.

The location of the crack is near where past rifts have appeared in the ice shelf, according to Bindschadler. He estimated that a new, rather large iceberg will probably form in the coming months, if not weeks.

“I hope that our field team will have enough time to get onto the ice shelf and set up GPS receivers before the calving event,” Bindschadler said. “We’d like to measure if the ice shelf notices the loss.”

Ted Scambos, lead scientist at the Boulder, Colo.-based National Snow and Ice Data Center, agreed that it’s likely that the crack is part of a natural cycle.

“These are cyclical, occurring every few years, very similar in size and even shape,” said Scambos via e-mail. “As a cyclical process, they are not part of the real climate-change/ice-shelf disintegration story.”

In 2002, the Larsen B Ice Shelf on the eastern side of the Antarctic Peninsula disintegrated in spectacular fashion, losing about 3,250 square kilometers of ice in a single season. More recently, the Wilkins Ice Shelf on the western side of the peninsula has started to collapse. Scientists believe both events are linked to climate change, though some researchers have suggested that wave action from distant storms could have helped break up the Wilkins Ice Shelf.

“If something different happened this time; for example, the pace of calvings changed, or this one was farther upstream from the past ones, then it might signal some major change in the Pine Island system,” said Scambos, adding that the area is changing in other ways, but the rate of calving has been steady over the last few decades.

A Second IceBridge Experience: It Just Gets Better

By Nathan Kurtz, NASA’s Goddard Space Flight Center and University of Maryland, Baltimore County

Looking back, I’m extremely happy that my second time on the IceBridge mission to the Antarctic was a much more intense experience than my first. Last year bad weather kept us grounded quite often and I was limited to going on three flights over the vast extent of sea ice that surrounds the continent. But this year we hit the ground running, well, flying I should say. There were many more flights, more thrills, more snow, more ice…or was there more snow and ice? In fact, one of the main goals of the IceBridge project is to find out whether the Antarctic is gaining or losing ice. While some regions are gaining ice and others are losing it, the question remains as to whether the sum of the parts is in balance. More importantly, how will the southern polar ice cover drive and respond to changes in the climate? How will these climate impacts affect humanity?

An apron of sea ice floats in front the Brunt Ice Shelf, seen on the first flight of the Antarctica 2011 campaign. Credit: Michael Studinger/NASA

With these questions in mind the DC-8 airplane used for IceBridge launched tirelessly day after day to provide some answers. The plane was loaded with instruments to get a unique look from the air that we cannot get with our eyes and hands. It’s amazing for me to think about what great things just a bit of electricity powering the scientific instruments can accomplish (not to mention the massive amounts of coffee apparently fueling the instrument operators). Some electricity fed through an antenna mounted on the aircraft wings produces a radar pulse that can tell us how thick the snow is beneath us. Electricity through a different antenna produces a radar pulse that can tell us how thick the ice is. While even more electricity fed other instruments such as the lasers, gravimeter, and the often-times spectacular photography of all the beautiful areas we pass over.

Outcroppings near Marie Byrd Land. Credit: Michael Studinger/NASA

With all that sensitive equipment loaded on the plane our next step was to fly over interesting areas to measure. We started out with flights in the Weddell Sea to measure the thickness of the sea ice surrounding the Antarctic continent. Antarctic sea ice is a fantastic sight to behold as the strong ocean dynamics in the region create a wide variety in the types of structures that we see. Like a snowflake, no two views of the sea ice are ever the same. In some areas the ice is very consolidated with the ice floes constantly crashing into each other and creating human-sized ridges. In other areas the ice has moved apart, exposing the ocean to the cold polar air and creating intricate geometrical structures as the water freezes and gets stirred together by the wind and ocean.

It is freezing and dynamic processes such as these which determines how much sea ice there is surrounding the Antarctic continent. As a scientist, one of my goals is to use the data collected during these flights to determine how the sea ice is changing and if so, what is causing the changes? How will these changes in such a remote area impact the world at large? It is thought that changes in the sea ice cover will have a large impact on the global temperature by changing the amount of solar radiation absorbed by the Earth. But presently it is not well known how changes in the global temperature will affect the Antarctic sea ice cover. While one may expect warmer temperatures to reduce the amount of ice, it is also possible that complex feedback mechanisms between the ocean and atmosphere could cause the Antarctic sea ice cover to increase with a warming climate. Connecting the observations taken during these IceBridge flights to those from satellites over the past decade will be critical to determining what factors have and will play a part in impacting the ice. While it will take some time to understand what the IceBridge measurements are showing us, there are high hopes for learning a great deal from what has been done.

Path of the IceBridge sea ice flight over the Weddell Sea. Credit: Michael Studinger/NASA

While on my previous flights over sea ice with IceBridge we would often fly near the great ice shelves surrounding the Antarctic continent. To me, the great white ice sheets always looked foreboding, as if they were waiting to swallow up the airplane if we dared venture too far into the interior of the continent to spy on its secrets. This year during my first land ice mission to Pine Island Glacier I half-expected something terrible to happen as soon we crossed the threshold from the ocean to the continent. Thankfully, the plane held a steady pace as if it had absolutely no concern for where it was going. In fact, the plane ended up dutifully flying all over the continent carrying me to some of the most remote and hostile environments on the planet. On the way I saw desolate islands buried in ice, giant crevasses, flew perilously close to lonely mountains with peaks just barely reaching up from the 1+ mile thick sheet of ice covering the land, and so much more. But it didn’t seem scary at all, in fact it was quite beautiful! Well, from 1500 ft above the ground everything looked beautiful. At times, the sensors in the plane showed surface temperatures below -50 F and winds blowing at more than 60 mph. Blowing snow was easy to spot with such strong wind. Perhaps not such a cheery and inviting environment to visit, but perched safely on the plane it was easy to appreciate the splendor of the world below. Interestingly, the map display on the plane showed nothing but an ominous black void beyond 80 degrees latitude, the edge of the world apparently. But the mapmakers have it wrong. While the bottom of the world is certainly a vast abyss, it is of white snow and ice rather than a black nothingness.

Given the enormity of the sheet of ice covering Antarctica it’s hard to imagine that changes could also be happening to it. Yet, as I’ve learned many times throughout my experience with IceBridge, it takes sophisticated instruments to learn what is really happening there. With many more flights to go, and countless more hours spent by scientists looking at the instrument data, we will hopefully find out soon enough.

Flying Under A Satellite

By Michael Studinger, IceBridge Project Scientist, NASA Goddard Space Flight Center

Punta Arenas, Chile – Better understanding of changes that occur in the polar ice sheets and sea ice requires observations over many years. With Operation IceBridge we make sure that there are no gaps in these critical measurements. In particular, we “bridge” the gap in laser altimeter measurements from space between ICESat, which ended in 2009, and the follow-up mission ICESat-2, which will launch in 2016. Using data from these two satellite missions and combining them with our aircraft measurements we will be able to build a time series of measurements that spans 17 years. In order to build long time series we often have to combine measurements from different instruments and satellites and it is important to make sure we calibrate and validate these measurements against each other, which will allow us to detect changes in the polar ice sheets and sea ice. The goal of Thursday’s IceBridge mission into the Weddell Sea was to better understand how radar altimeter measurements from ESA’s CryoSat-2 satellite can be combined with laser altimeter measurements from NASA’s IceBridge satellites. 

Scarred and chiseled sea ice in the Weddell Sea, where the DC-8 followed in CryoSat-2’s tracks on Thursday’s IceBridge flight. The DC-8’s shadow appears as a dark speck in the lower right. Credit: Michael Studinger/NASA

With IceBridge we are in a unique position to answer these questions because we fly both kinds of instruments on the DC-8 aircraft. In order to compare our measurements we have to fly the DC-8 directly beneath the CryoSat-2 satellite and collect data at the same time in the exact same location. It sounds easier than it is. Many things have to come together to make this happen. First, the weather in the Weddell Sea needs to be suitable for our flight. We need a large, cloud-free area beneath us, which is very rare to find. Second, we need the CryoSat-2 spacecraft on an orbit that allows us to take off from Punta Arenas and fly the DC-8 on the satellite ground track at the same time the spacecraft passes overhead. Third, we need this location to be over a certain type of sea ice that is suitable for comparison of the different measurements. Last, but not least, the weather conditions in Punta Arenas have to be suitable for safe takeoff and landing. Today, we were facing very strong winds that have been close to preventing a flight. While we were flying over the Weddell Sea our colleagues informed us that the winds in Punta Arenas had become so strong that the G-V aircraft had to be moved to Puerto Montt because the wind conditions exceeded the safety specifications for safe parking on the ramp for the G-V. All in all, flying an aircraft directly beneath a satellite in one the most remote parts on Earth is far from trivial. Today, everything went well and the DC-8 flew along the CryoSat-2 ground track in the southern Weddell Sea while the spacecraft passed overhead. The ice conditions were just perfect.

After our rendezvous with CryoSat-2 we reversed course on the ground track to fly back on the same line for 130 kilometers. We did repeat measurements over the exact same segment of our survey line over the course of one hour in order to track the drift of the sea ice. Wind and ocean currents move sea ice floes around. We can estimate how fast and in which direction the sea ice is moving by correlating patterns in our data between the three passes. It is very difficult to make these measurements from space.

After reaching the northern end of our survey line we transit back to Punta Arenas, knowing that we accomplished another landmark sea ice mission for Operation IceBridge.

DC-8 joins G-V for Antarctic IceBridge flights


The Dryden-based DC-8 flight crew handles the plane on its first Antarctica 2011 flight. Credit: Michael Studinger/NASA


By Michael Studinger, IceBridge Project Scientist, NASA Goddard Space Flight Center

Punta Arenas, Chile – Today marks a milestone for IceBridge. For the first time, both NSF’s Gulfstream V (G-V) and NASA’s DC-8 aircraft took off from Punta Arenas for science flights over Antarctica. 

The G-V, with NASA’s Land Vegetation and Ice Sensor (LVIS) on board, headed toward Evans Ice Stream, which flows into the southern part of the Ronne Ice Shelf in Antarctica. 

The DC-8, with its suite of IceBridge instruments, headed toward the Weddell Sea to measure the thickness of the sea ice and the snow on top of it along two 1,700-km-long transects that cross the entire Weddell Sea from east to west. It’s like flying from Chicago to Miami and back at 1,500 feet above the ground. This mission is an exact repeat of two missions that we have flown in 2009 and 2010. The goal is to measure how much sea ice is being exported through the “gate” connecting the tip of the Antarctic Peninsula with Cape Norvegia and determine the changes that occur over time. The export of sea ice from this area is a major contributor to the total ice volume exported into the Antarctic Circumpolar Current.

The DC-8 takes in a stunning view of the Brunt Ice Shelf on its first Antarctica 2011 flight. Credit: Michael Studinger/NASA

The Weddell Sea encompasses a large area and the chances of getting such a large area cloud-free are small. We rely on several different weather forecast models, satellite imagery and meteorologists at the Punta Arenas airport to get a picture of the weather conditions in the survey area before the flight. It requires many years of experience to interpret the different pieces of information and make a decision in the morning whether we launch a mission into the Weddell Sea or not. There is not a single weather station in the Weddell Sea or nearby to provide observations we could use to confirm the model predictions. Imagine needing to rely on a weather forecast back at home that has no weather data between Chicago and Miami. During the flight we encountered the expected mix of clouds, fog and sunshine. We often were able to fly below the clouds and continue to collect data. All in all a great start to our Antarctic campaign.

Preparing for Punta Arenas

By Michael Studinger, IceBridge Project Scientist, NASA Goddard Space Flight Center

Dryden Flight Research Center, Palmdale, CA – Welcome to another Antarctic campaign with NASA’s Operation IceBridge. Over the next two months the IceBridge teams will be collecting data with two aircraft based in Punta Arenas, located at the southern tip of Chile. We have installed cutting-edge laser altimeters and extremely sensitive radars that will allow us to measure changes in thickness of the sea ice surrounding Antarctica. We will also be monitoring changes in the thickness of ice sheets and glaciers that cover 98% of the Antarctic continent.

NASA’s DC-8 flies over Dryden Flight Research Center on a test flight Wednesday before next week’s transit to Chile. Credit: Kyle Krabill/NASA

Before we can start collecting data over Antarctica we have to make sure that all installed sensors on NASA’s DC-8 work and are calibrated. (The second plane in this fall’s campaign, a Gulfstream-V operated by the National Science Foundation and the National Center for Atmospheric Research, has already landed in Punta Arenas and could start science flights as early as Friday.) In order to make extremely precise laser altimeter measurements of the ice surface elevation we use target sites in the Mojave Desert that we have surveyed on the ground to calibrate the instruments. El Mirage, a dry lake bed, not far away from Dryden’s Flight Research Center is a perfect target site to calibrate our laser. We also fly over the ramp at Dryden and over two ICESat ground tracks in the desert to make sure our equipment works. A second test flights takes us out over the Pacific Ocean, some 200 miles away from the coast, where we can switch on our radars without interfering with other systems. We use the radar signal that is bouncing back from the ocean surface to calibrate the radars. We did a couple of maneuvers at high-altitude over the Pacific Ocean to calibrate the antennas of the ice-penetrating radar systems that we will use to survey the sea ice, glaciers, and ice sheets. 

The flight track of the DC-8 during a calibration flight over the Mojave Desert in California. Credit: Michael Studinger/NASA

In a few days we will be ready to go south. In previous years we have laid down the foundation for repeat measurements of many glaciers and ice streams in Antarctica. This year we will be re-surveying our previous flight lines in order to determine how much these glaciers have changed compared to previous years. We also plan to survey a few new areas in order to establish baseline measurements for future years and for the upcoming ICESat-2 mission in 2016.

The IceBridge teams have enjoyed working in sunny and warm California for a few weeks, preparing for our trip to Chile. We are looking forward to another successful campaign with exciting new data and spectacular Antarctic scenery. You can follow us on this blog and on Twitter at Twitter.com/nasa_ice.