From: Nathan Kurtz, NASA’s Goddard Space Flight Center/University of Maryland, Baltimore County

Our flight today, Oct. 28, was a partial repeat of a mission conducted last year. The flight was to take place at 1,500 feet along the western edge of the Weddell Sea following the Antarctic Peninsula, turning south and east along the Ronne Ice Shelf, then heading north into the central Weddell Sea. The primary instruments used on this flight were a specially designed suite of laser and radar altimeters for measuring the thickness of the snow and ice underneath.
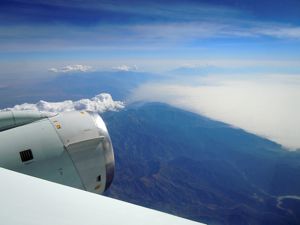
I began my journey in the cockpit of the NASA DC-8, my first time seeing what all is involved in bringing a large aircraft from the runway into the sky. We took off on schedule flying briefly around the countryside surrounding Punta Arenas, heading back over the airport ramp to calibrate some of the instruments. We then started our push towards the Weddell Sea. Along the way there were spectacular views of the normally cloud enshrouded mountains and glaciers of Tierra del Fuego. Even at an altitude of 18,000 ft the 8,000 ft peaks looked a bit too close for comfort, but the calmness and confidence of the pilots helped rid my mind of any thoughts of catastrophe.
After a couple hours transiting through serene blue skies we spotted the Antarctic Peninsula and began our descent to low altitude. My first ever science flight to the polar regions from two days ago was still fresh in my mind, but the view of the pristine landscape still captivated me. As we passed over the peninsula, there were breathtaking views of jagged brown mountains, bright white snow, sky blue glacier ice, and murky black water all mixed together in a chaotic jumble. I was struck by how truly remote and harsh the world down below was. A place only for well prepared humans and the hardiest of animals. Despite the uninviting look of the land below, I couldn’t help imagining what it might be like to ride a sled or go skiing down some of the mountains.
As we left the peninsula, we passed southward over still waters filled with icebergs, finally entering into the sea ice region to begin our science mission. We first entered into a region of small sea ice floes which had been broken up by wind and waves. The aircraft instruments showed the surface and air temperatures were near the freezing point, probably the reason for the absence of any newly growing ice in the open water areas. As we continued our flight southward we entered the consolidated ice cover of the western Weddell Sea. The region we were flying over today is some of the thickest and most compact ice in the Southern Ocean. The vastness of the sea ice cover became readily apparent as this leg of the journey consisted of miles of ice extending into the horizon in all directions. The area was a mixture of open water, freshly grown ice, smooth areas, rubble fields, ridges, and many other ice types each with intricate geometries reflecting the physical processes which shaped their formation. Towards the end of the peninsula region we turned east following the outline of the Ronne Ice Shelf. Though we couldn’t see it in the distance, evidence of its presence was all around us as numerous icebergs could be seen. The huge size of the icebergs dwarfed the surrounding sea ice, but the icebergs were held steady inside like giants chained into a prison of sea ice.
The sea ice itself looked benign and serene, like a vast unmoving and unchanging landscape. But looks can be deceptive as the aircraft instruments showed temperatures of -10 C and 60+ mph winds outside. Telltale signs of the force of wind and water acting on the ice could be seen in the piled up and crushed ice of the ridges. The wind had also blown the snow into patterns called sastrugi, some of them looked like flowers dotting the landscape. The plane marched on relentlessly throughout the day as miles of sea ice passed below us. The last leg of the science portion of the flight took us underneath the orbit of CryoSat-2, a radar altimeter launched earlier this year by ESA.
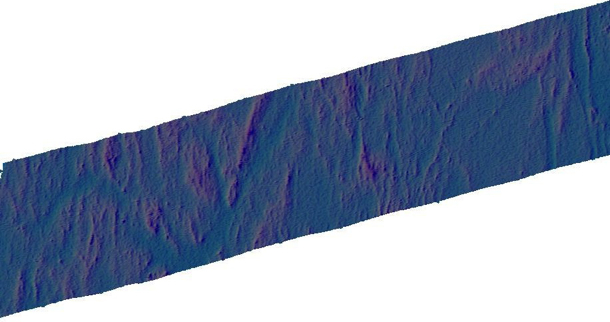
Data from the Airborne Topographic Mapper (ATM) show a swath of sea ice at the time of the CryoSat-2 overpass on Oct. 28, 2010. Data in this image are preliminary. Credit: NASA/ATM Group
One goal of this mission was to collect coincident data between IceBridge and CryoSat-2 for doing intercomparisons between the various altimeter data sets used in cryospheric research. We were a bit ahead of schedule however, so we looped back over portions of our flight line to ensure that we were still collecting data when the satellite crossed over. Finally, as the sun hung began to sink low on the horizon, hundreds of miles above us CryoSat-2 passed silently overhead covering hours of our flight track in a matter of minutes. We continued flying northward a little while longer towards the edge of the ice pack where the ice became less consolidated and more broken up. Our mission finished, we climbed high into the sky and sped back to our temporary home in Punta Arenas.

Image is courtesy of NASA/Jim Yungel
It’s difficult for me to tell much about the ice cover properties from the limited perspective of my human eyes, but memories of the journey will remain with me for a long time to come. An enduring and detailed record has also been written into the hard drives of the IceBridge instrument archives. I and other scientists are eagerly anticipating doing a thorough analysis of the data collected. Hopefully it will tell us more about what we saw today and how this record can be used to enhance our understanding of the climate system.

 A second problem involves the avoidance of bird and seal colonies. Low overflights stress the birds and seals; so we need to stay 4,000 feet away from the colonies in the vertical, or 1 nautical mile in the horizontal. We are making every effort to avoid the colonies, many of which are concentrated along our path in the northern peninsula.
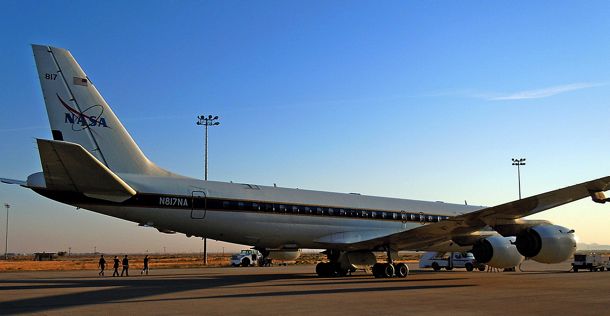
 But before we can go south we have to go through a series of test flights here in California to make sure that all the installed sensors work and to calibrate our science instruments. In order to do this we fly over target sites in the Mojave Desert that we have surveyed on the ground a few days before the test flights. The desert environment that we have selected for our test flights here is very different from the barren land of snow and ice that we will be flying over the next couple of weeks and we all enjoy the low altitude flights over the Mojave Desert, the San Gabriel Mountains and the San Andreas Fault. When the pilots ask you if it would be a problem if the belly of the aircraft is facing the sun you know that you are in the world of research flying. We did a couple of 90 roll maneuvers at high altitude over the Pacific Ocean to calibrate the antennas of the ice-penetrating radar systems that we will use to survey sea ice, glaciers, and ice sheets.