IceBridge Field Work – A Project Manager's Perspective

By Christy Hansen, IceBridge Project Manager, NASA Goddard Space Flight Center

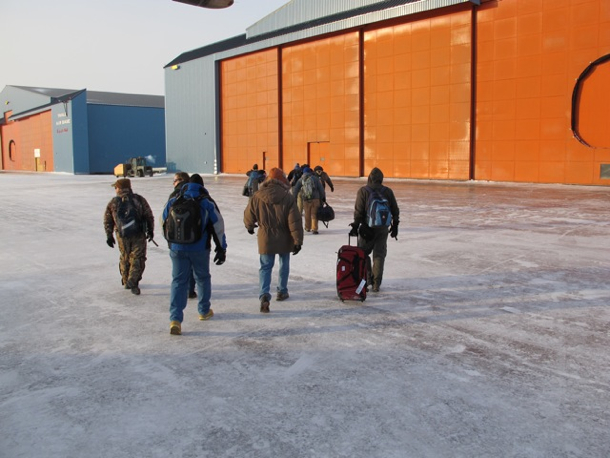
Field work in the Arctic is a unique and challenging experience. It takes an experienced and tough team to complete mission objectives from start to finish despite the biting cold, long days and noisy environment. Early morning temperatures are often in the negative single digits, and the IceBridge team powers through it preparing for flight each day. A typical day’s work can range 12 to 14 hours, a schedule that is repeated daily until the airport is closed or until the flight crew reaches a required hard down day.

My project management perspective allows me to take a step back and appreciate not only the technical expertise of our instrument and flight crew teams, but the masterful choreography that unwinds each day to ensure the P-3B aircraft is prepped and ready, the instruments are powered on and in working condition, and the weather and corresponding science flight plan has been assessed and defined. Being actively involved in all phases of Operation IceBridge makes for a stronger and well-versed leader better able to assist any part of the team at any time. By doing this, I can ensure we are on track to meet our mission and science requirements, assist with troubleshooting in and out of the field, better manage project milestones, and ensure streamlined communication across all IceBridge disciplines with a common goal.

IceBridge project manager Christy Hansen on the stairway to NASA's P-3B.
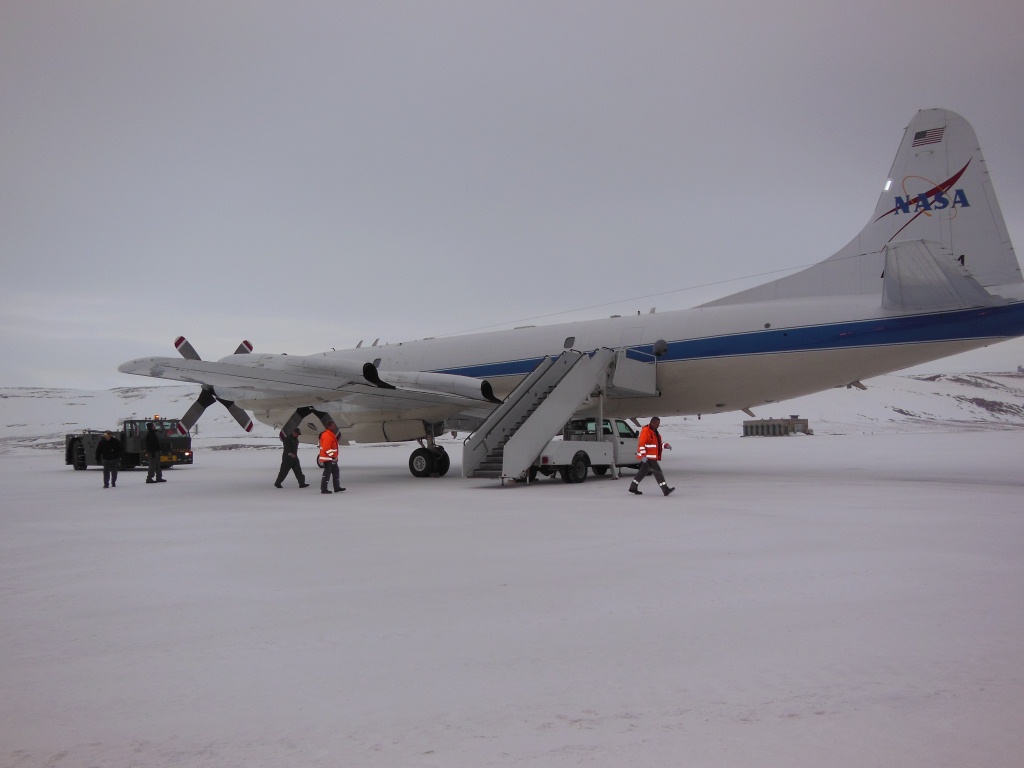
IceBridge project manager Christy Hansen on the stairway to NASA’s P-3B. Credit: NASA / Christy Hansen
But why do we do this? How do we do this? 

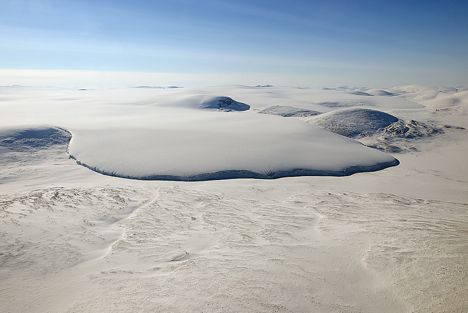
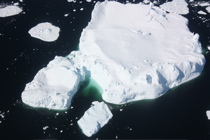
We do all of this in the name of science, collecting polar geophysical data that will help characterize the health of the Arctic and Antarctic. The in-field data and derived data products IceBridge produces are helping to show annual changes in the ice. These data can be entered into models that can more accurately predict what might happen in the future in terms of ice sheet, glacier, and sea ice dynamics, and ultimately sea level rise; all of which have serious consequences for climate change.

But how do we reach these science goals? The steps and teamwork required are simply astounding. Each part of our team is like a puzzle piece and everyone is needed to complete the puzzle. All teams must clearly know their individual responsibilities, but also be able to work together and mesh where their job ends and another begins.

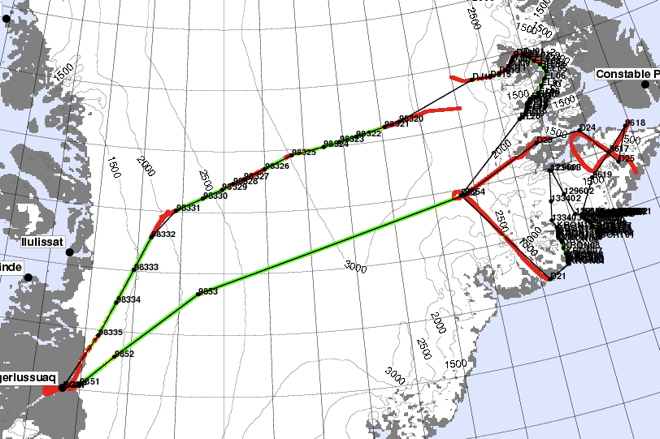
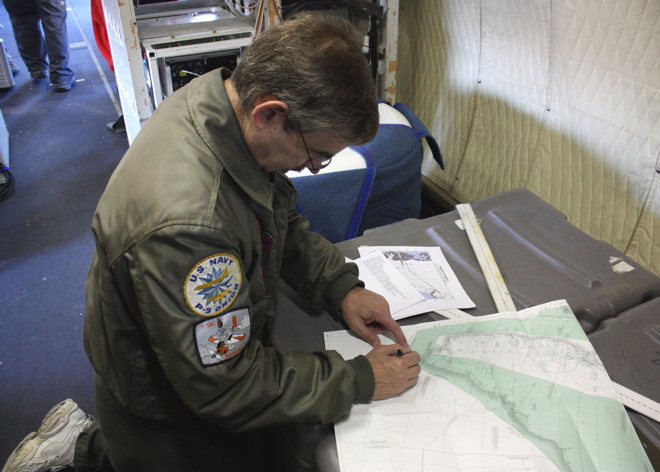
The choreography starts in the beginning, or planning phase where the science team establishes targets of interest on the ice in accordance with our level 1 science requirements. Then our flight planner designs survey flights, having a unique ability to efficiently mesh the science targets with the range and flight dynamic capabilities of the P-3B aircraft.

Next the aircraft office at NASA’s Wallop’s Flight Facility prepares the P-3B for deployment to some of the harshest environments on Earth and supplies the flight crew that executes the specific flight paths over our required science targets. The instrument teams provide the instrumentation—laser altimeters, radars, cameras and a gravimeter and magnetometer—and expertise in operating equipment and processing data during and after flights. Our logistics team deploys to the field ahead of time, establishing security clearances, local transportation and accommodations, and internet and airport utilities.

Finally, our data center ingests and stores the data that our team collects, ensuring it’s useable and available to the wider community. Our data is not only used by polar scientists and other researchers around the world, it is also used to help satellite missions like the European Space Agency’s CryoSat-2 and NASA’s ICESat-2 calibrate and validate satellite instrumentation.

A view of ice from NASA's P-3B airborne laboratory.

A view of ice from NASA’s P-3B airborne laboratory. Credit: NASA / Christy Hansen

And finally, a day in the field …

Assuming a standard 8 a.m. local takeoff and eight hour mission duration, we generally have three major groups who follow different schedules pre-flight each morning.

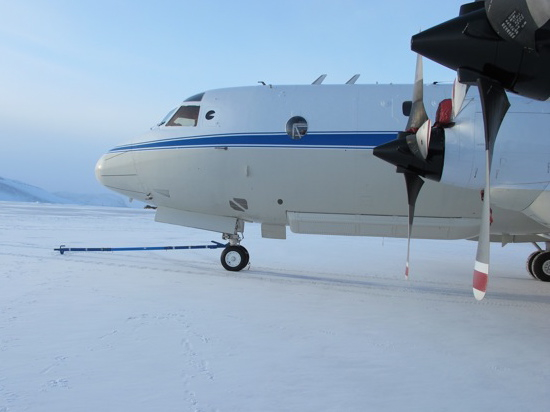
The P-3 maintenance and flight engineer crew typically starts the earliest, heading to the airport about three hours before takeoff. They prep and warm up the plane, conduct some tests and fuel it, all in preparation for the instrument team arrivals and flight operations.

In parallel with aircraft prep, IceBridge’s project scientist, project manager and flight planner team head to the weather office. The team works with local meteorologists, reviewing satellite imagery and weather models to determine the optimal weather patterns that support our flight requirements—clear below 1500 feet, the altitude we typically fly—and final target selection.

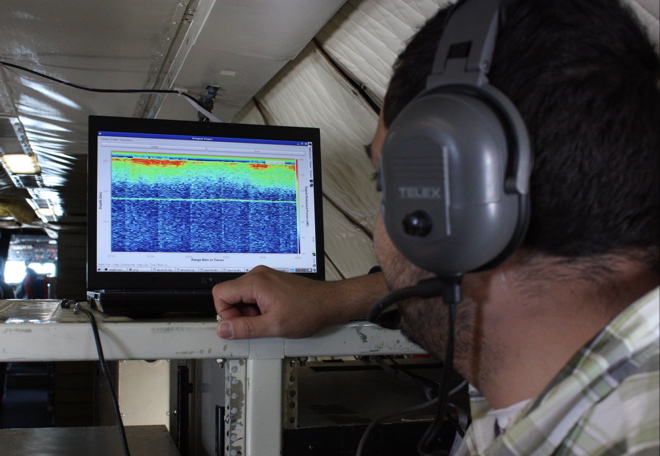
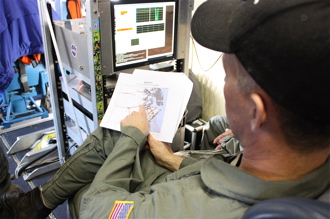
In the meantime, the instrument teams arrive at the aircraft to power up and check their systems prior to takeoff. By 7:30 a.m., the aircraft doors close, and we take off by 8. Our eight-hour flights range between flying high and fast, to low and slow over our targets, which include geophysical scans of ice sheets, glaciers, and sea ice.

We typically land around 4 p.m., close out the plane, check data and meet at 5:30 for a science meeting. Many folks continue to work for a few hours afterward, processing data or writing mission reports. All of this is repeated daily, for up to 6 days in a row, which can be exhausting, but in the name of important scientific research, an amazing team, and majestic polar landscapes, I could not imagine anything else.


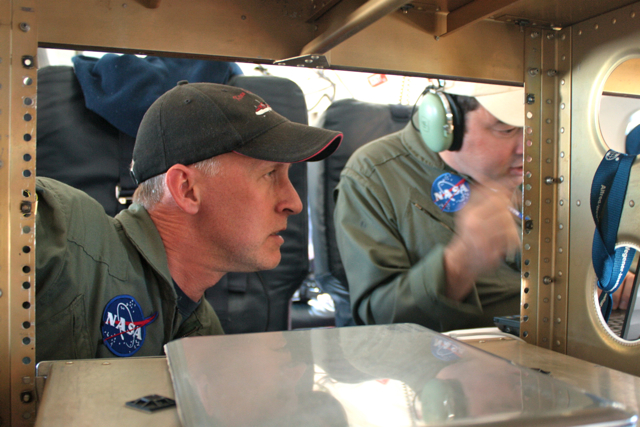
Crew members working on the P-3B. Credit: NASA / Christy Hansen

Ice Cap Recap

From: Kathryn Hansen, NASA’s Earth Science News Team / Cryosphere Outreach

May 16, 2011

Last month, IceBridge surveyed Sukkertoppen Ice Cap — a mass of ice southwest of the mission’s base in Kangerlussuaq, Greenland. I didn’t know what to expect from an ice cap. Would it resemble the vast, white expanse of the Greenland Ice Sheet next door?

At the surface, Sukkertoppen looked remarkably like an ice sheet. After all, both form from the accumulation of snow compacted over thousands of years. Before long we reached the rugged mountains and blue-green fjord that separates the cap from the main ice sheet, and we turned back for another pass.

On April 8, 2011, IceBridge flew a mission to coastal areas in southwest Greenland. Mountains and an open-water fjord surround one of the mission’s targets, a small ice cap called Sukkertoppen Isflade. Credit: NASA/Michael Studinger

Ice caps are simply small versions of ice sheets, measuring in at a maximum area of 50,000 square kilometers (about 19,000 square miles). Anything larger is considered an ice sheet. They’re also thinner. It’s their small stature that makes ice caps more prone to melt in a warming Arctic.


Charles Webb of NASA’s Goddard Space Flight Center in Greenbelt, Md., explains the importance of monitoring ice caps in the Canadian Arctic. Credit: NASA/Jefferson Beck

South of Sukkertoppen lies the Canadian Arctic – home to the largest amount of ice outside of Greenland and Antarctica and contributing significantly to sea level rise.

IceBridge is adding to the long-term record of changes to the ice caps. On May 5, IceBridge surveyed the Devon Ice Cap – among the Canadian Arctic’s top ten largest caps. Then on May 10, the P-3 surveyed several glaciers and small ice caps on Ellesmere Island, Axel Heiberg Island and Meighen Island, including the Prince of Whales Ice Field and the Agassiz Ice Cap.

Finally on May 12, IceBridge surveyed the Barnes Ice Cap. Barnes is a curiosity because it is considered a significant remnant of the vast Laurentide Ice Sheet the covered most of Northeast America and Canada during the last glacial. NASA previously used the ATM laser altimeter to map the ice cap in 1995, 2000 and 2005, showing a slight acceleration in thinning of the ice cap.

“It’s our hope that by combining these data sets we’ll have a long term time series about whats happening there so we can better understand the dynamic of the ice caps as well as use them as early warning indicators of what is happening in our climate,” said Charles Webb of NASA’s Goddard Space Flight Center in Greenbelt, Md.

On May 12, IceBridge surveyed Barnes Ice Cap on Baffin Island. In addition to mapping its surface elevation, instruments also measured the bedrock topography, which will allow scientists to better model ice dynamics and estimate when the Barnes Ice Cap will be completely melted. Credit: NASA/Michael Studinger

Welcome to the 2011 Arctic Campaign

From: Kathryn Hansen, NASA’s Earth Science News Team/Cryosphere Outreach Specialist


On March 14, NASA’s P-3B landed in Thule, Greenland, for the start of the Arctic 2011 campaign of Operation IceBridge. Credit: NASA/Jim Yungel


On March 14, NASA’s P-3B aircraft landed in Thule, Greenland, where it will be based for the first leg of the Arctic 2011 campaign of Operation IceBridge. It’s our third annual campaign over the frozen north, ensuring the continuity of ice elevation measurements that scientists use to monitor change. This year, IceBridge is bigger than ever before and delving into new areas of exploration. Read more about the Arctic 2011 campaign and watch the video here.

Follow this blog throughout the 10-week campaign to read about the mission from the perspective of the scientists and crew on the ground (and in the air) who make the mission possible. They will give a behind-the-scenes account of individual flights and daily life in the field. They will share pictures and video from the sky and ground. And they will discuss the science questions being probed by the array of instruments onboard the flying laboratories. Welcome aboard!

Mission participants chat inside the P-3B during transit on March 14 from NASA’s Wallops Flight Facility in Wallops Island, Va., to the mission’s base in Thule, Greenland. Credit: NASA/Jim Yungel

IceBridge teams arrive in cold and sunny Thule, Greenland. Credit: NASA/Jim Yungel

Media Day in Chile

From: Kathryn Hansen, NASA’s Earth Science News Team, NASA’s Goddard Space Flight Center

Video conference between IceBridge scientists in Punta Arenas, Chile, and reporters in Santiago. Credit: NASA/Sarah DeWitt

PUNTA ARENAS, Chile — In a perfect world, IceBridge researchers would make science flights over Antarctica almost every day and return home with a check next to every high-priority science flight. The 2009 campaign — the first year IceBridge made flights over Antarctica — was just about perfect. But that’s a rarity in Antarctic research where whether and unanticipated aircraft maintenance can ground flights.

During days on the ground, however, researchers keep busy. On Monday, Nov. 15, IceBridge scientists gathered at Universidad de Magallanes in Punta Arenas, Chile, to answer questions from local reporters and from reporters in Santiago via live video feed (video below).


Video credit: NASA/Michelle Williams

Missed it? Get a replay of the teleconference until Nov. 29 by calling:

Phone: Tfree:800-469-6597

Toll:203-369-3288

Rollercoaster of Opportunity

From Kathryn Hansen, NASA’s Earth Science News Team, Goddard Space Flight Center

Nov. 13, 2010

John Sonntag (left), of NASA’s Wallops Flight Facility/URS, and Michael Studinger (right), of NASA’s Goddard Space Flight Center/UMBC, evaluate the Peninsula mission on the fly. Credit: NASA/Kathryn Hansen

PUNTA ARENAS, Chile — Friday evening, IceBridge teams gathered in the hotel conference room to discuss logistics for upcoming flights. First up: weather. The audience watched the animated WRF model, a tool used for flight planning because it tells you what the weather will be like in the next 6-12 hours. On this particular morning, the model showed system after system lined up to pummel Antarctica. “Are we sure this isn’t the WTF model?” a scientists inquired.

Saturday morning, scientist and flight planner John Sonntag arrived at the airport offices with the flight decision. Weather conditions weren’t perfect, but were the best the Antarctic Peninsula had seen in a month. Given that it had been a few days since the last flight and the forecast looked to only worsen in the days ahead, mission planners decided to take the opportunity to fly under the cloud ceiling. The model predicted clear skies below 10,000 feet. “I hope they’re right,” Sonntag said.

The flight planners quickly worked up a modified version of the “Pen 23” flight plan and at 9:23 we took off for the Peninsula.

The DC-8 approaches the Antarctic Peninsula. Credit: NASA/Kathryn Hansen

We flew the planned route backward, hitting northern cloud-free regions first. Heading south, we followed the eastern side the “spine” — the crest of a mountain range that extends down the middle of the Peninsula. Unfortunately for stomachs, the spine influences weather patterns and the east side also happened to be the windy, turbulent side. The DC-8 may need to restock the little white bags!

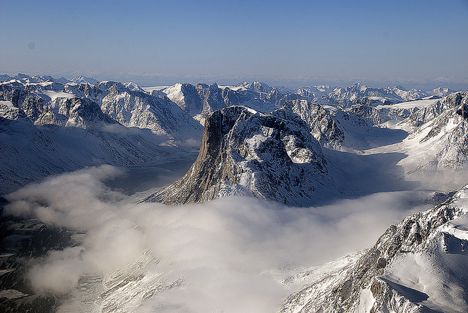
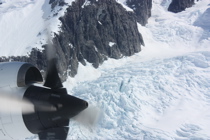
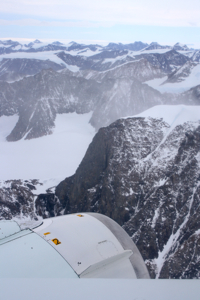
Stomachs also suffered from the dramatic changes in altitude necessary to collect data. The measurements require a relatively consistent altitude, which can be tricky when accessing a glacier behind a rock cliff. But the pilots deftly handled the 7,000-foot-roller coaster flight line to collect data over targets also surveyed during the 2009 campaign.

Glaciers meander through the rocky terrain of the Antarctic Peninsula (right). Credit: NASA/Kathryn Hansen

Targets flown: Hektoria, Drygalski, Crane, Flask and Leppard. Each of these glaciers drain into the Larsen A and B ice shelves which broke apart in 1995 and 2002, respectively. Attlee, Hermes, Lurabee and Clifford. Each of these glaciers drains into Larsen C, which is still intact.

So what? Like a cork in a bottle, ice sheets can plug the neck of a glacier. Remove that ice shelf and the glacier more freely dumps ice into the ocean. Scientists want to keep an eye on how these glaciers continue to respond years and decades after the loss of the shelves. Crane, for example, which feeds into the remnant of Larsen B, shows little sign of slowing down.

Cruising further south, however, we encountered too many clouds so we cut across to the west side of the spine to check out the Fleming Ice Shelf. Clouds there also proved too dense, however, so we turned north back to Punta Arenas. At 8.4 hours, the modified Pen 23 became the shortest flight of the campaign — to the relief of many yellow-faced passengers.

Ice Calves from Russell Glacier

From: Kathryn Hansen, NASA’s Earth Science News Team/Cryosphere Outreach Specialist


On May 14, 2010, scientists working from Kangerlussuaq, Greenland, with NASA’s IceBridge mission observed ice calving from nearby Russell Glacier. Credit: Eric Renaud/Sander Geophysics Ltd.

IceBridge scientists spend many days in flight surveying the snow and ice from above. On research “down days,” some scientists use their day off to take in the sights. On Friday, May 14, a group of scientists with Columbia University’s gravimeter instrument — which measures the shape of seawater-filled cavities at the edge of some major fast-moving major glacier — made the trek out to Russell Glacier. In the right place at the right time, the group witnessed a calving event that sent ice cascading down the glacier’s front.

“I took burst speed photos with my Canon 40D and just kept my finger on the trigger until everything stopped moving,” said Eric Renaud, an electronic technician with Sander Geophysics Ltd. “We were lucky to witness it.”

Read more about the group’s trek in a blog post by Columbia University’s Indrani Das, and watch a time-lapse video of the calving event composed by Renaud.

An Inland Connection?

From: Kathryn Hansen, NASA’s Earth Science News Team/Cryosphere Outreach Specialist

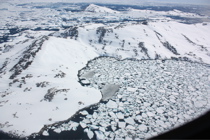
Scientists have long been tracking Greenland’s outlet glaciers, yet aspects of glacier dynamics remain a mystery. One school of thought was that glaciers react to local forces, such as the shape of the terrain below. Then, researchers noticed that glaciers in different regions were all thinning together, implying a connection beyond local influences. Scientists have posed theories about what that connection might be, but the jury is still out.

Recently, the landscape in southeast Greenland has started to change. Helheim Glacer, which was thinning at 20-40 meters per year, slowed dramatically to just 3 meters per year while thinning of the nearby Kangerdlugsuaq also slowed. Further south, two neighboring glaciers showed the opposite trend and started thickening by as much as 14 meters per year. Neighboring glaciers behaving in similar ways implies a connection, but what exactly?

The IceBridge flight on May 12 will help scientists learn how changes to outlet glaciers affect the ice sheet inland. Instruments on the P-3 surveyed in detail three southeast glaciers: Fridtjof-Nansen, Mogens North and Mogens South. Next they flew four long lines mapping changes near the ocean and up to 60 kilometers inland, capturing the extent, if any, at which thinning near coast reflects on changes to the ice inland. It’s an important connection to make; while the loss of outlet glaciers alone would not contribute much to sea level rise, loss of the ice sheet could have a dramatic impact.

IceBridge crew and researchers board the P-3 on May 12 for a flight to study glaciers and the ice sheet in southeast Greenland. Credit: NASA/Kathryn Hansen


The P-3 flew over areas of sea ice wile mapping glaciers and the flight line closets to the coast. Credit: NASA/Kathryn Hansen

Mountainous terrain along Greenland’s southeast coast led to short-lived periods of turbulence and spectacular scenery. Credit: NASA/Kathryn Hansen

Eyes for Ice: In the Field with Indrani Das

From: Kathryn Hansen, NASA’s Earth Science News Team/Cryosphere Outreach Specialist

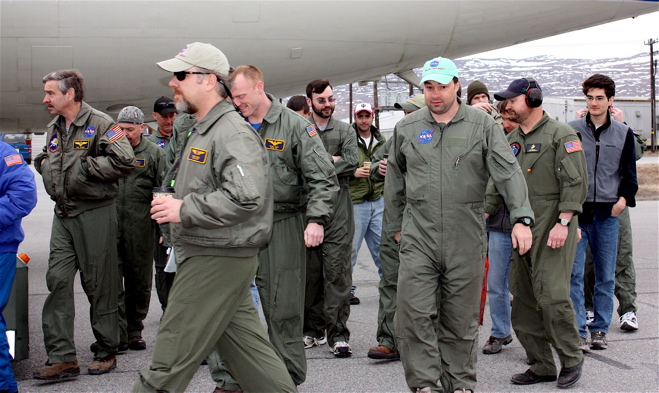
KANGERLUSSUAQ – Kangerlussuaq International Science Support is a red, boxy building that doubles as a laboratory and a hotel for polar researchers. Upon my arrival it was quiet, nearly empty. By the end of the week, however, an influx of scientists staging field expeditions quickly filled the kitchen and halls.

Space is limited, so I share a room with Indrani Das, an ice scientist from Columbia University’s Lamont-Doherty Earth Observatory — the only other woman with the IceBridge team here in Kangerlussuaq. She works with the Gravimeter instrument, which measures the shape of seawater-filled cavities at the edge of some major fast-moving major glaciers.

Das, looking out the P-3’s window on the flight to Greenland’s Helheim and Kangerdlussuaq glaciers, has expertise that reveals a world hidden from my untrained eyes — textures in the ice that disclose, generally, how a glacier is moving.

Das wrote about her experience on the flight May 8, sprinkling her narrative with some glacial facts. Read her post here, on the Lamont-Doherty Earth Observatory’s IceBridge blog.

The Big Three

From: Kathryn Hansen, NASA’s Earth Science News Team/Cryosphere Outreach Specialist

KANGERLUSSUAQ — The evening before the second science flight, IceBridge scientists Michael Studinger and John Sonntag visited Kangerlussuaq’s weather office — a small building adjacent to the town’s grocery store. Weather can make or break a mission, as clouds interfere with instruments’ ability to map the ice.

This time there was another factor to contend with. Ash from Iceland’s Eyjafjallajokull volcano had made its way over the southeast side of Greenland. Comparing the proposed flight path with the position of ash, IceBridge crew decided the flight was a “go.”

Mission managers selected the Helheim-Kangerd flight plan, which called for mapping two of three glaciers deemed “the big three.” (The third is Jacobshavn, to be surveyed in a separate mission).

Helheim and Kangerdlugssuaq glaciers are quickly accelerating, speeding up ice loss to the ocean. Steep beds and the influence of saltwater working its way under the glaciers are thought to be playing a role. Annual data collected during IceBridge will help scientists maintain a record of the ice loss and learn more about the factors driving the change.

After mapping Kangerdlugssuaq, the P-3 passed over a ground team on an expedition collecting ice cores. The overflight was intentional — multiple sources of data over a single location can prove useful for calibrating data and for research. Similarly, IceBridge flights frequently reexamine tracks previously observed by the ICESat satellite. The ice coring crew was caught on camera (below) by the Digital Mapping System — a digital camera mounted in the underbelly of the P-3.

Isolation

From: Kathryn Hansen, NASA’s Earth Science News Team/Cryosphere Outreach Specialist

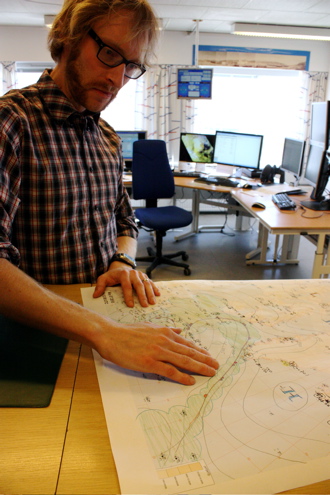
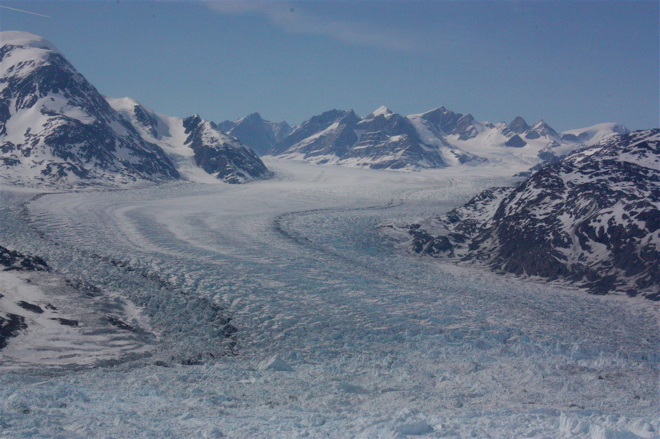
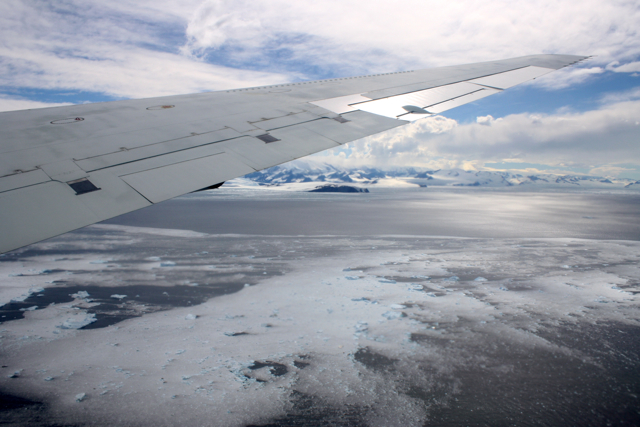
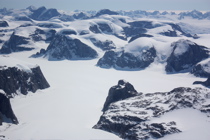
KANGERLUSSUAQ — There was a rumor that the flight on Friday, May 10, would be among the most scenic of the 2010 Arctic campaign. The high-priority flight along Greenland’s southeast coast required clear weather for pilots to maneuver along the sinuous glaciers at low altitudes. We were fortunate. The first opportunity to fly from Kangerlussuaq with the P-3 on this Arctic 2010 campaign turned up clear skies and relatively balmy temperatures, and we lifted off for Geikie Plateau shortly after 8 a.m.

Why Geikie? The plateau is “dynamically isolated” from the rest of the ice sheet. That means what happens to the main ice sheet is not necessarily also happening to Geikie. So, IceBridge scientists want to collect Geikie’s vitals — ice thickness, surface elevation, bedrock profile — and compare them with the rest of the ice sheet. “They’re potentially doing very different things, which can tell you something about climate’s impact on the region,” said John Sonntag, Senior Scientist with the ATM laser instrument and IceBridge management team member.

The survey of Geikie Plateau called for about eight hours of total flight time. Credit: NASA/John Sonntag

Observing from one of the P-3’s few windows, I was struck by the scale of the landscape. As we closed in on the southeast coast, the flat barren ice sheet soon mingled with occasional hills and then steep mountains with sharp peaks. Ice appeared to be making its escape, flowing down valleys and merging with the glacial superhighway. Some glaciers terminated in cliffs half a mile high. For others, all that remained were the brown, silty remnants.

Ice works its way down between mountains before joining a larger glacier. Credit: NASA

At the same time that I was making my visual inspection, however, IceBridge instruments were collecting a more scientific type of information. Lasers mapped the surface while radars dove down for a look below. Will scientists find that Geikie indeed acts in isolation? They’ll have a better idea after deciphering and analyzing the data. In the meantime, the IceBridge team is plotting to visit a few other isolated ice sheets throughout the mission — if time and weather permit.

The Multichannel Coherent Radar Depth Sounder instrument shows ice characteristics at depth and also the shape of the bedrock below (thin green line). Credit: NASA