Q&A: Michael Studinger

By Maria-Jose Viñas, Cryospheric Sciences Laboratory Outreach Coordinator, NASA Goddard Space Flight Center 

Michael Studinger is Operation IceBridge’s project scientist. He trained as a geophysicist in Germany, his home country, before moving to the U.S. to take a position at the Lamont-Doherty Earth Observatory and then transferring to NASA Goddard Space Flight Center in 2010. Studinger has been studying polar regions for 18 years, expanding his initial focus on the geology and tectonics of the Antarctic continent to the overall dynamic of polar ice sheets.
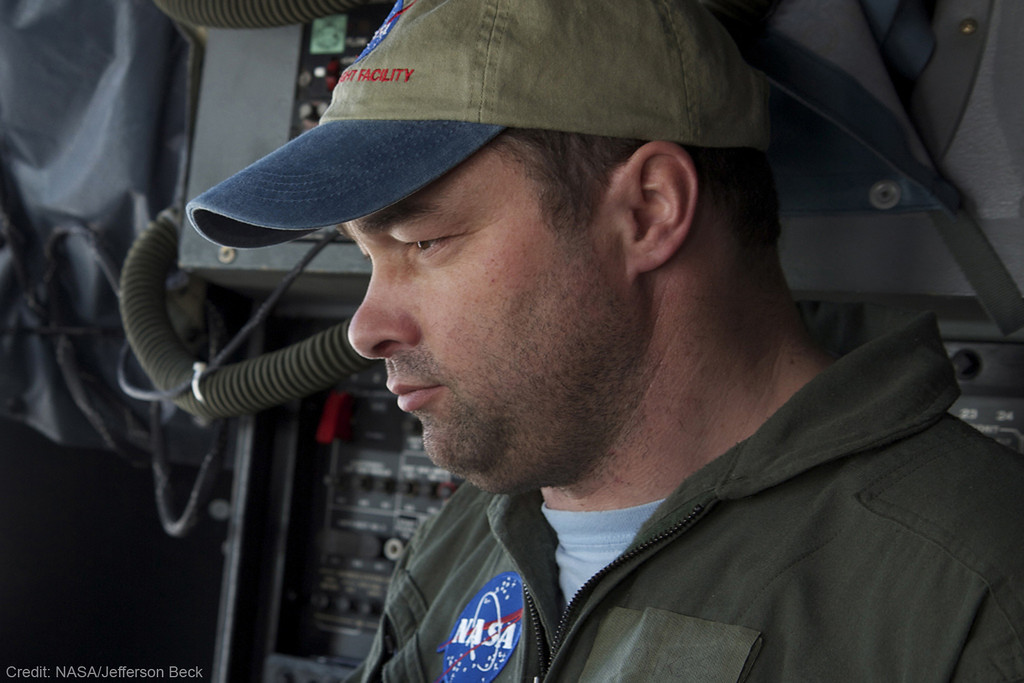
IceBridge project scientist Michael Studinger

Operation IceBridge Project Scientist Michael Studinger. Credit: Jefferson Beck / NASA

Studinger recently returned from Greenland, where he was leading Operation IceBridge’s 2012 Arctic campaign.

This was IceBridge’s fourth Arctic campaign. How different was it from previous years?

We flew more than last year: During the 75 days we were there, we only had to cancel a single flight because of weather, something I’ve never seen before. Regarding sea ice, we have expanded coverage in terms of area. For the first time we went to the Chukchi and Beaufort Seas to collect data there. But the biggest change this year is that we published a new data product that we had to deliver to the National Snow and Ice Data Center before we even returned from the field. This product is being used by modelers and other scientists to make a better prediction of the annual sea ice minimum in the summer. We can now feed ice thickness measurements from March and early April into these predictions and see how they improve them.

What are the benefits of improving Arctic sea ice minimum predictions?

There seems to be enough people who have an interest in finding out how thick or thin the sea ice will be. People who live in the Arctic and shipping companies…they want to know, they want to prepare. It’s like long-range weather forecast: People who grow crops would like to know if they’re going to get a wet season or a dry season.

Also, it’s a relatively short-term prediction, so we’ll soon find out if the models are working or not. It helps building better models because you can compare the results to the reality in a few months.

This Arctic campaign, you teamed up with CryoVEx, ESA’s calibration and validation campaign for the CryoSat-2 satellite. How did it go?

We did two coordinated flights with them. We were in Thule, Greenland, and they were in Alert, Canada. We both took off at the same time and made sure we were over the same point in the Arctic Ocean with CryoSat-2 flying overhead. It was quite a bit of a coordination effort. We measured the same spot along the satellite track within a few hours. The CryoVEx team has instruments similar to ours, but also some that we don’t have. IceBridge has unique instrument suite for sea ice that includes the world’s only airborne snow radar. By combining all the data from all the instruments, we can learn a lot about what each instrument is seeing and what CryoSat-2 is actually measuring over sea ice.

How’s your average Arctic campaign?

We start in Thule because we want to get the sea ice flights out of the way early on, as long as it’s cold over the Arctic Ocean. It’s still fairly dark there, that far north [Thule is 750 miles north of the Arctic Circle]. We have just enough light in the second half of March to fly the sea ice missions, during the first three weeks of the campaign. Then we go down to central Greenland while it’s still cold there and start doing ice sheet flights, for three or four weeks. Then we go back to Thule because it’s getting too warm in southern Greenland, and we finish the ice sheet flights in the northern half.

Can you describe your daily routine while in Greenland?

We get up at 5 a.m. In Kangerlussuaq, we try to be in the air at 8:30, and in Thule we try to be flying at 8, when the airport opens. Eight hours later, we land. After that, we have a science meeting where we talk about how the flight went and the plan for the following day. Then we eat dinner, check email, look at data… all that before we go to bed and do it all over again the next day.

How do Arctic and Antarctic campaigns differ?

We use different aircraft: a P-3B for the Arctic and a DC-8 for Antarctica. In Greenland, when we fly out of Kangerlussuaq or Thule, we start collecting data pretty much right away, except for the sea ice missions. In Antarctica, we “commute” from Punta Arenas in southern Chile, which takes a few hours. Then we can only collect data for a few hours before we go back home to Punta Arenas. Typically, in the DC-8 we fly for 11 to 11.5 hours, much longer than the about 8 hours of flight with the P-3.

We actually fly more instruments on the P-3: the accumulation radar and the magnetometer (which is much easier to install on the P-3 than on the DC-8). We don’t really have the room in the fuselage to mount the accumulation radar antennas and there’s not really much of a need to use it in Antarctica. The snow accumulation in Greenland is higher. We can actually see annual layers with the accumulation radar but it’d be far more difficult in Antarctica because less snow falls there.

Personally, do you prefer one campaign to the other?

No, they’re just different. It’s a different airplane: the DC-8 is much more comfortable, less noisy. You don’t have the vibration of the P-3, so you can actually get a lot of work done on the transit flights. But the flights are very long.

And scientifically, is one campaign more interesting than the other?

Not for me. Most of my work I’ve done in Antarctica, but I’m getting more and more interested in what Greenland has to tell us. If you look at the two biggest glaciers we study, Jakobshavn Isbrae in Greenland and Pine Island Glacier in Antarctica, the kind of mechanism through which both glaciers are losing ice is similar — warm ocean water is melting the ice from underneath. So we’re studying similar processes. Antarctica is far more challenging to get there and collect data, but from a scientific point we need to do both, otherwise we’re missing part of the picture.

What’s the 2012 Antarctic campaign going to look like?

It’s going to be shorter for a number of reasons, mostly because the aircraft has already been committed for an international multi-aircraft experiment in Thailand, and it’s also committed afterward. We’ll try to fly as much as we can, we’ll be using two aircraft: a G-V from the National Science Foundation, flying at high altitude, and NASA’s DC-8 flying low.

What will the future bring for IceBridge?

The plan is we will start using unmanned aerial vehicles and we’ll probably be doing it mostly over sea ice in the Arctic Ocean, but we don’t know the details yet. We will be doing some test flights over the Arctic Ocean later this year with the Global Hawk, either with the radar or laser altimeter onboard. I don’t think we can replace manned aircraft completely over the course of IceBridge.

After ICESat-2 launches, will IceBridge continue to some extent?

There will always be airborne campaigns to some degree, because there are some datasets that we can only collect from planes, and we will also need to calibrate and validate the satellite data. We need a variety of different scales, wavelengths, different types of measurements in order to really answer the science questions that we have, such as what is the contribution of Greenland to sea level rise in the next 20 or 30 years. For example, if we only have ICESat-2 collecting measurements of how the surface elevation is changing, we’ll know a lot, but we’ll never be able to answer with certainty what is causing these changes. It’s almost like you’re taking the pulse of a patient; you’re only looking at the symptoms of the illness without understanding what’s causing it. In order to find out why the ice sheet is changing its surface, we need to understand what’s beneath the ice sheet because that’s what’s driving a lot of the dynamic changes. And those are datasets that you can’t collect from space, you need an airplane to go in there and get the greater picture of what’s below there and other things, like snow accumulation, which can be done much better from airplane. It’s not a single satellite that will provide us the answer, not a single airborne measurement – it all has to come together.

A Spanish version of this post is available on National Public Radio’s Science Friday blog.

Witnessing the last P-3 Arctic sea ice flight for 2012

By George Hale, IceBridge Science Outreach Coordinator, NASA Goddard Space Flight Center

The transfer of IceBridge’s base of operations from Thule to Kangerlussuaq normally marks the end of sea ice surveys done by the P-3 for the campaign. At this time, scientists on the P-3 change their focus toward ice sheets and glaciers, while researchers aboard the Falcon jet using Land, Vegetation and Ice Sensor (LVIS) will continue studying sea ice. But with starting the campaign with a transit to Alaska and beginning operations in Kangerlussuaq by crunching data on the ground while the P-3 is in Wallops being repaired, this year has been anything but ordinary. I’ve been asked to give my views as a newcomer to IceBridge and first-time visitor to the Arctic and I’m happy to share.

First, I have to state that while I have a basic background and interest in science, I’m not a scientist by training. My role as a communicator is not to make scientific discoveries, but to spread the word about them. Part of my job as IceBridge’s science outreach coordinator is to help bridge the gap between what scientists find and what the public understands.

Being outside of the science of sea ice gives me a different perspective on things. I’ve been keeping up with news from the Arctic campaign, but it wasn’t until actually riding along on a sea ice flight that I felt I knew what was happening. Being with scientists as they gather data and sharing the flight experience with them will hopefully help me improve IceBridge’s educational and public outreach efforts.

New to the Program

I arrived in Kangerlussuaq on April 9, the same day as the P-3 returned from Wallops. While flying from Thule the week before, the P-3 started having issues with one of its engines, something unavoidable with the workload and conditions the P-3 is subjected to. In the interest of safety, the pilots shut the engine down and flew directly into Kangerlussuaq. After a one-day delay because of weather, the P-3 made its way back to the Wallops Flight Facility in Virginia for an engine replacement.

The P-3’s return flight to Greenland coincided with my scheduled arrival there, so I was extended an invitation to ride along. Unfortunately, this didn’t work with the arrangements for my commercial return flight, so I wasn’t able to go. I arrived in Kangerlussuaq on an Air Greenland flight Monday morning with enough time to unpack, check my email and buy some groceries before joining others at the airport to see the P-3 arrive.

Bright and early Tuesday morning, I joined 23 other people in braving the 12 degree Fahrenheit weather to board the P-3 for one last sea ice flight along the east coast of Greenland that would put us on an intersecting path with the NASA ER-2 carrying MABEL. At this point in the campaign, IceBridge normally flies glacier surveys, but weather conditions made that unfeasible.


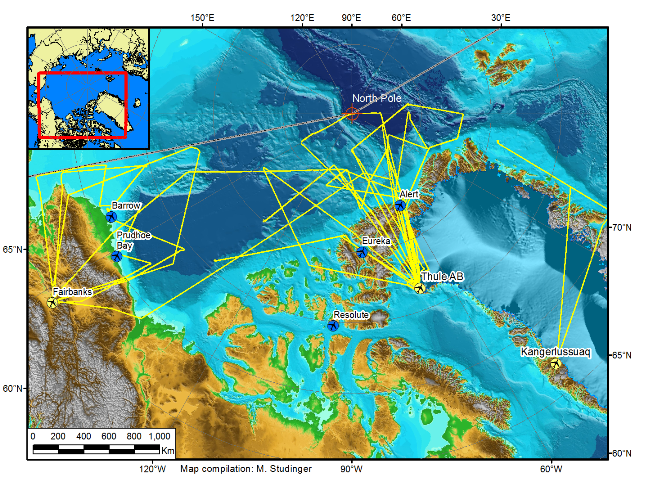
A map of the 2012 Arctic campaign’s sea ice flight. Credit: Michael Studinger/NASA

Sea Ice in Review

This flight was another in a long line of successful sea ice surveys and joint operations with other aircraft. IceBridge has flown 15 sea ice flights, including several along CryoSat orbits and two joint flights with aircraft from the European Space Agency as part of CryoVEx, their CryoSat validation campaign.

Aside from the highly successful joint ESA/NASA flights, this year’s Arctic campaign stands out as completing several more sea ice flights than previous years, covering a distance greater than the circumference of the Earth around the equator. In total, IceBridge has collected huge amounts of sea ice data from instruments like ATM, DMS and the new KT-19 temperature sensor used for sea ice lead detection.

And this data is just sitting around waiting to be processed. This year IceBridge scientists are working to build a quick sea ice product from information that’s only days old. If this proves successful, it has the potential to improve sea ice forecasts and statements for the general public. IceBridge scientist Nathan Kurtz talks about his work with sea ice and the quick sea ice product in his earlier blog post.

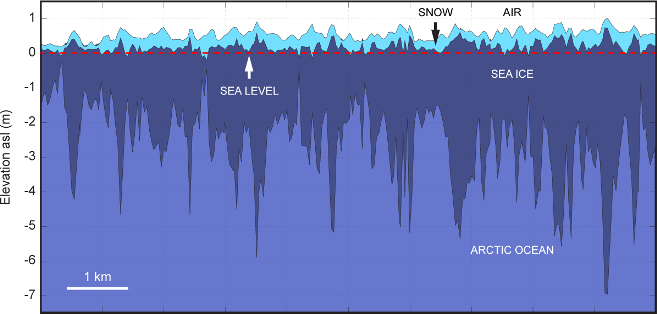
A diagram showing sea ice thickness

A diagram showing sea ice thickness and the role snow cover plays

Having successes like these early on sets the bar for the rest of the campaign, and after hearing about IceBridge’s success for several weeks, I now get the chance to witness it first-hand.

My First Sea Ice Flight

I’ve been hearing about IceBridge’s campaign successes since operations began in March. Knowing I would join the team in April and get to see these successes first-hand was very exciting. Being there as things happen promises to be a great experience, and I can only hope to avoid getting in the way. On the morning of my first survey flight, I strap into my seat. I’m not entirely sure what to expect, but I’m ready to see IceBridge at work.

I am in some ways grateful that my first flight was over sea ice. Although it may have been a letdown for those who have flown many sea ice flights this year already, I was glad to have a relatively gentle introduction. Compared to glacier surveys, sea ice flights are smooth and easy, with no crosswinds coming out of fjords and far less turbulence.

As I walked around the cabin I saw members of the IceBridge team working diligently, recording data and making necessary adjustments to their instruments. I also looked out the P-3’s side windows to watch sea ice as we passed 1,500 feet overhead. The flight wasn’t all straight and level though. The pilots put the P-3 through a series of pitching and rolling maneuvers at higher altitude for instrument calibration. The up and down parabolic arcs and resulting feeling of lessened gravity seem to be a favorite, bringing smiles to the faces of both novices such as myself and IceBridge veterans.

A Cold Ride Home

Several hours later we returned to the airport, with the bulk of the team ready to get off the plane and warm up. During the return leg a mechanical issue caused the plane’s climate control to start blowing cold air instead of warm. By the end of the flight, it was around 40 degrees Fahrenheit in the back of the cabin and some bottles of water sitting on the deck were starting to form ice on the bottom.

After landing we take a short break (to warm up) and then head off to the daily science meeting, where we discuss the day’s events and look at weather forecasts to make plans for tomorrow’s flight. The plan is to survey some of the eastern glaciers, which means a more turbulent flight for my second day on the P-3. I’m looking forward to riding along on as many flights as I can in the following days, and to working with the American, Danish and Greenlandic teachers arriving soon to participate in IceBridge.

Synchronized NASA and ESA flights across Arctic Ocean — a success!

By Malcolm Davidson/ESA and Michael Studinger/NASA


Arctic sea-ice from the NASA P-3

Arctic sea-ice from the NASA P-3 (NASA/M. Studinger)

Monday April 2 has been much anticipated bythe teams in Thule, Greenland (NASA) and Alert, Canada (ESA). While the objectivesfor the day were clear – jointly fly with all available planes beneath CryoSat’searly morning pass over the Arctic Ocean – the execution of such flights is andalways will be a challenge. 

Flying joint multi-plane missions is arather daunting task. Departure and rendezvous times and locations need to becalculated and maintained to ensure that the instruments on the differentplanes will see the same sea-ice floes below (these move after all), flightaltitudes need to be established and maintained for safety reasons, instrumentsneed to be warmed up and ready ‘in-time’, somewhat grumpy firefighters need tobe coaxed out to the airstrip ahead of working hours to support an earlydeparture and the list goes on.

With both teams committed to the flights,the first task early this morning was to check the weather forecast for theday. These proved to be good with temperatures of –29°C (–20°F) and generally clear skies; but not ideal! Some rather worryingcloud formations featured near the coast in satellite images.

NASA P-3 cockpit

NASA P-3 cockpit (NASA/M. Studinger)

Nevertheless, after a quick phone callbetween the NASA and ESA coordinators (at a time before most people have yet toreach for their mug of morning coffee) the decision was made: it’s a go.

From then on it there was a flurry ofactivity on both sides, pilots warmed up their planes, instrument teams checkedout their instruments, flight plans were programmed into the onboard computersand so on.

Twin Otter takes off

Twin Otter takes off

The NASA P-3 plane was the first to go out, leaving Thule a full hour before the two ESA planes located closer to the track. On the tarmac in Alert there was the first casualty of the day – despite heroic efforts the EM-bird ice-thickness instrument could not be coaxed into life. The die was cast – the second Twin-Otter plane would have to go it alone and meet up with the NASA P-3.

NASA's sea-ice mission plan for April 2

NASA’s sea-ice mission plan for April 2 (yellow). We teamed up with ESA at 10520 north of Alert. (NASA/M. Studinger)

Around 07:30 (local time) the CryoSat satellite – always on schedule – ripped above the Arctic Ocean taking about one minute to race along the 500-km (310 mile) transect that would later take several hours of plane time to cover.

At 08:00 both the ESA and NASA planes reached the edge of the Arctic Ocean almost simultaneously and headed across the sea ice flying exactly along the same line that CryoSat had just covered. The timing was so good that, for the first time, there was visual contact between the planes, a remarkable achievement!

The image below, which is a DMS mosaic from Eric Fraim shows one of the many leads we saw from the NASA P-3 today with a variety of different types of sea ice.

DMS mosaic of lead in the sea ice

DMS mosaic of lead in the sea ice (NASA/DMS/E. Fraim)

The rest of the day turned out very well indeed. The clouds that had worried the teams in the morning only formed only a thin band near the coast. The rest of the line out on the ocean was clear and beautifully lit by the oblique Arctic Sun. All the onboard scientific instruments on both planes worked well so that by the end of the day it was clear that the day had been a success.

By joining forces both the ESA and NASA teams collected a highly valuable dataset that will benefit the scientific achievements of ESA’s CryoSat and NASA’s future ICESat-2 mission to better monitor sea ice from space.

For more about ESA’s CryoSat mission and CryoVEx campaign, visit their Campaign Earth blog 


In the spirit of international collaboration: Honoring the Terra Nova Expedition

By Michael Studinger, IceBridge Project Scientist, NASA Goddard Space Flight Center/UMBC

Thule Air Base, Greenland – March 29, 2012 is a special day for polar researchers worldwide. It marks the centennial of Sir Robert Falcon Scott’s death on the Ross Ice Shelf. Many commemorative events have taken place around the world to remember the scientific accomplishments of the Terra Nova Expedition, particularly those of the Pole Party consisting of Robert Falcon Scott, Edward Wilson, Henry Bowers, Lawrence Oates and Edgar Evans. The most prominent event was a National Service of Commemoration for Captain Scott and the Pole Party at St. Paul’s Cathedral in London, with IceBridge’s own Seelye Martin attending as a guest of honor.

In 2008 I had the privilege to visit Captain Scott’s historic Terra Nova Hut on Cape Evans in Antarctica, and the geographic South Pole, where the National Science Foundation installed a sign bearing Scott’s famous quote said when the party realized the Norwegian expedition, led by Roald Amundsen, had been there first: “The pole. Yes, but under very different circumstances from those expected.” These are moments in my life that I will never forget. Walking through the Terra Nova Hut, which looked like it has been frozen in time, took my breath away.

Inside Captain Scott’s Terra Nova Hut on Cape Evans. The hut was built in 1911 by members of the British Antarctic Expedition (Terra Nova Expedition) and used as base for the trek to South Pole from which Scott and four of his team members never returned. The hut is remarkably well preserved but is undergoing restoration by the Antarctic Heritage Trust to protect it from further decay. The kitchen area on the left is one of the many areas inside and outside the hut that are being worked on. The hut is part of the 100 most endangered sites on the World Monuments Watch List. It is a remarkable place to be to say the least. Credit: Michael Studinger/NASA.

One hundred years later polar research has changed dramatically. On the day of the centennial, NASA’s Operation IceBridge and the European Space Agency’s CryoVEx campaign coordinated flights of two aircraft from different locations over the Arctic Ocean on a track flown shortly before by ESA’s CryoSat-2 spacecraft 600 km (370 miles) above us. We are able to do this because we have modern satellite images that are a few hours old and computer models showing the cloud cover in the survey area. We have modern means of communication that allow us to coordinate these science flights a few hours before takeoff. We know our position within a few feet and the NASA Airborne Science program flight tracker shows our position in real time. A lot has changed to say the least, but nevertheless operating in the remote polar regions remains a challenge even today. Modern navigation computers routinely get confused within a few miles of either the North or South Pole, the extreme cold still poses a challenge and weather predictions can be wrong. The safety and success of our operations is only possible because of extremely experienced and skilled members of the aircrew and instrument teams that excel in meeting the challenges of the polar environment every day.

Discovery Hut near McMurdo Station in Antarctica

McMurdo Station in Antarctica with the historic Discovery Hut in the foreground. The hut was built during Scott’s 1901-1903 expedition. The contrast between old and new is amazing. Observation Hill, the site of the Terra Nova memorial cross can be seen in the background on the right. Credit: Michael Studinger/NASA.

Today’s polar research is driven by a spirit of international collaboration and the joint NASA/ESA flight on March 29, 2012 is a fine example of what can be accomplished when many nations and organizations team up instead of competing with each other. Recognizing the enormous accomplishments of the early polar explorers, we dedicate this flight to the members of the Terra Nova Expedition, who died in Antarctica one hundred years ago.

NASA P-3 flight path

Flight path of the NASA P-3 Orion in yellow during the joint sea ice science mission with ESA’s CryoVEx airborne campaign stationed in Alert on Ellesmere Island and CryoSat-2.