In the spirit of international collaboration: Honoring the Terra Nova Expedition

By Michael Studinger, IceBridge Project Scientist, NASA Goddard Space Flight Center/UMBC

Thule Air Base, Greenland – March 29, 2012 is a special day for polar researchers worldwide. It marks the centennial of Sir Robert Falcon Scott’s death on the Ross Ice Shelf. Many commemorative events have taken place around the world to remember the scientific accomplishments of the Terra Nova Expedition, particularly those of the Pole Party consisting of Robert Falcon Scott, Edward Wilson, Henry Bowers, Lawrence Oates and Edgar Evans. The most prominent event was a National Service of Commemoration for Captain Scott and the Pole Party at St. Paul’s Cathedral in London, with IceBridge’s own Seelye Martin attending as a guest of honor.

In 2008 I had the privilege to visit Captain Scott’s historic Terra Nova Hut on Cape Evans in Antarctica, and the geographic South Pole, where the National Science Foundation installed a sign bearing Scott’s famous quote said when the party realized the Norwegian expedition, led by Roald Amundsen, had been there first: “The pole. Yes, but under very different circumstances from those expected.” These are moments in my life that I will never forget. Walking through the Terra Nova Hut, which looked like it has been frozen in time, took my breath away.

Inside Captain Scott’s Terra Nova Hut on Cape Evans. The hut was built in 1911 by members of the British Antarctic Expedition (Terra Nova Expedition) and used as base for the trek to South Pole from which Scott and four of his team members never returned. The hut is remarkably well preserved but is undergoing restoration by the Antarctic Heritage Trust to protect it from further decay. The kitchen area on the left is one of the many areas inside and outside the hut that are being worked on. The hut is part of the 100 most endangered sites on the World Monuments Watch List. It is a remarkable place to be to say the least. Credit: Michael Studinger/NASA.

One hundred years later polar research has changed dramatically. On the day of the centennial, NASA’s Operation IceBridge and the European Space Agency’s CryoVEx campaign coordinated flights of two aircraft from different locations over the Arctic Ocean on a track flown shortly before by ESA’s CryoSat-2 spacecraft 600 km (370 miles) above us. We are able to do this because we have modern satellite images that are a few hours old and computer models showing the cloud cover in the survey area. We have modern means of communication that allow us to coordinate these science flights a few hours before takeoff. We know our position within a few feet and the NASA Airborne Science program flight tracker shows our position in real time. A lot has changed to say the least, but nevertheless operating in the remote polar regions remains a challenge even today. Modern navigation computers routinely get confused within a few miles of either the North or South Pole, the extreme cold still poses a challenge and weather predictions can be wrong. The safety and success of our operations is only possible because of extremely experienced and skilled members of the aircrew and instrument teams that excel in meeting the challenges of the polar environment every day.

Discovery Hut near McMurdo Station in Antarctica

McMurdo Station in Antarctica with the historic Discovery Hut in the foreground. The hut was built during Scott’s 1901-1903 expedition. The contrast between old and new is amazing. Observation Hill, the site of the Terra Nova memorial cross can be seen in the background on the right. Credit: Michael Studinger/NASA.

Today’s polar research is driven by a spirit of international collaboration and the joint NASA/ESA flight on March 29, 2012 is a fine example of what can be accomplished when many nations and organizations team up instead of competing with each other. Recognizing the enormous accomplishments of the early polar explorers, we dedicate this flight to the members of the Terra Nova Expedition, who died in Antarctica one hundred years ago.

NASA P-3 flight path

Flight path of the NASA P-3 Orion in yellow during the joint sea ice science mission with ESA’s CryoVEx airborne campaign stationed in Alert on Ellesmere Island and CryoSat-2.

New perspectives on the IceBridge sea ice campaign

By Nathan Kurtz, IceBridge scientist, NASA Goddard Space Flight Center/Morgan State Univ.

As the IceBridge Arctic sea ice campaign continues another successful year, I’ve been given this wonderful opportunity to discuss my experiences on the mission, and more importantly, how they relate to the critical science questions that need to be answered. I realize that there are many details I find intriguing as a scientist that are inherently uninteresting to non-scientists, so I won’t wax philosophical about how impressed I was to see things like the self-similar structure of deformation patterns in sea ice (if you actually came here for that, I apologize). My aim is to communicate the importance of what we are learning to the broader public who funds and ultimately benefits from this work. I hope you learn something about why we are devoting so many resources to this scientific study, as this is perhaps the most effective type of ‘bridge’ the IceBridge mission can make: to raise awareness of the state of the climate and present the scientific facts as we have gathered them through a long and arduous field campaign.

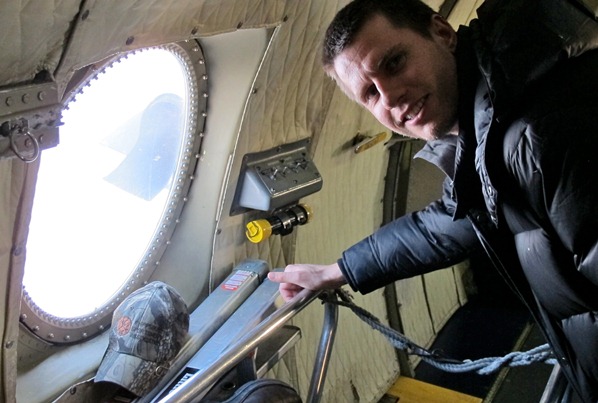
IceBridge science team member Nathan Kurtz checking out the sea ice conditions

IceBridge science team member Nathan Kurtz checking out the sea ice conditions. Credit: James Yungel/NASA.

This was my first trip to the ice-covered regions of the Arctic and I fully admit to reverting back to an excited childlike state of wonder as my initial flight to Thule, Greenland, touched down. It was quite striking to take in the sight of the vast snow-covered mountains and frozen sea, feel the bitter cold draining the heat and life from my body and realize that actual ‘monsters’ with an instinctive mindset to view humans as prey were all around. But I was shocked to see a hardened community of people standing resolute against these elements. Even more shocking, was to imagine why humans came here thousands of years ago without modern technology. What led them here? For me, the Arctic has always symbolized the unknown, but with hidden treasures awaiting anyone brave enough to explore it. But I realize my subjective symbolic interpretation is also remarkably universal in that native settlers, polar explorers and scientists must also have come to the Arctic with a desire to explore an unknown wilderness and gain some new knowledge from their experience. 

On the scientific end of this knowledge spectrum, recent studies have increasingly shown the importance of the Arctic to the climate. The once seemingly insignificant and remote Arctic region is now understood to be intimately connected to the rest of the planet. Sea ice variability affecting the severity of snow storms in Europe, melting sea ice increasing the absorption of sunlight by the Earth and melting ice sheets causing sea level rise are but a few of many such connections. We are learning that what happens in the Arctic will profoundly affect the whole of humanity all over the Earth. Viewed in this way, it is no longer a coincidence that humans have taken such a keen interest in the Arctic, and that this wild frontier is indeed a source of valuable knowledge waiting to be unearthed.

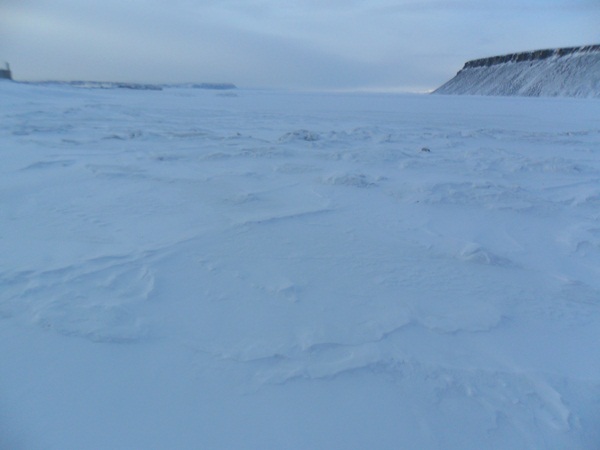
Looking out across the sea ice near Thule, Greenland

Looking out across the sea ice near Thule, Greenland. Credit: Nathan Kurtz/NASA

As a scientist, the purpose of my trip here is to learn more about the Arctic sea ice cover. My job is to use a combination of lasers, radars, cameras and infrared sensors to determine how the thickness of sea ice is changing, and whether any observed changes can be linked to the larger climate system. Flying over the sea ice with all the IceBridge instruments operating simultaneously has given me a whole new perspective on the mission. It has taken me from my normal desk job of looking at numbers on a computer screen, to the reality of what those numbers represent, and back again full-circle to connecting these concepts in a meaningful way. It has given me the opportunity to physically see that an increased laser surface elevation is actually a large sea ice pressure ridge, a widely spaced radar return is actually a snow drift. That, ultimately, all of the IceBridge results are indeed real and meaningful. It is this connection between numbers on a computer screen to the reality of the ground which will provide me and other scientists with the ability to come up with a rigorous scientific explanation of precisely what role sea ice thickness changes will have on the climate. 

In the course of my own analysis of the IceBridge data I have been constantly questioning my methods to ensure that my excursions into the abstract realm of mathematical and scientific theory do not lose sight of this connection to the things I’ve seen on the ground. Questions such as what do I do when I try to invert a matrix of IceBridge data and it explodes? How can I utilize statistics to determine just how accurate these measurements are? Are my solutions to these problems in tune with the physical environment I have witnessed? This ultimately translates into maintaining high standards and objectivity, which is critical to any scientific research area.

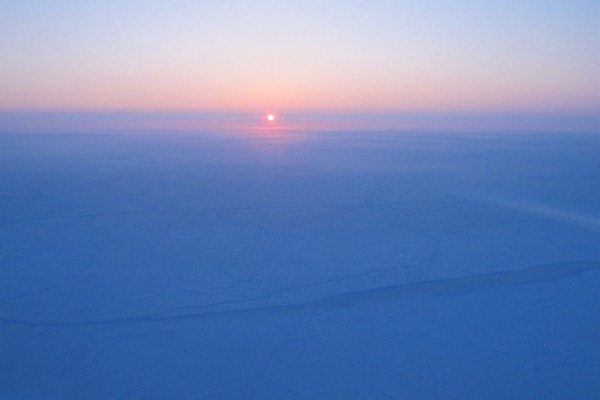
Sunrise over sea ice near the North Pole

Sunrise over sea ice near the North Pole. Credit: James Yungel/NASA

But this is, admittedly, my own subjective understanding of my role in this project. More important, is how my understanding and use of these concepts relates to the scientific results being obtained, and how these results can then be translated into a general statement for the public such as ‘the sea ice thickness decreased by x centimeters’ Towards this end, I and a large team of people have worked for the past two years on developing methods to turn the instrument data from IceBridge into clear and understandable scientific data products. We recently reached a major milestone in the project by demonstrating our ability to produce easy to understand products such as snow depth and sea ice thickness from past missions. In the interest of promoting honest and open exchange of scientific knowledge, we have given public access to these data sets (http://nsidc.org/data/idcsi2.html) in such a way that anyone can look at the latest results of the project. In doing so, we went from the realm of raw instrument data, to something that anyone can understand and interpret.

To further improve the utility of the IceBridge sea ice campaigns, we are attempting an unprecedented feat: to produce a quick version of the scientific products to support operational forecasting of sea ice. This is shaping up to be a monumental undertaking, and we are working hard to understand how to work with days-old field data. It remains to be seen what role IceBridge can play in sea ice forecasting and how we can interpret the data to come up with statements about the state of Arctic sea ice for the general public. But, so far the results from the first few flights look fantastic! We have also provided our preliminary results to support an ESA sponsored campaign conducting field missions in the area. Everything is proceeding in a positive direction, so stay tuned for more updates as the IceBridge mission continues!

Operation IceBridge surveys new areas in the Beaufort and Chukchi Seas north of Alaska

By Michael Studinger, IceBridge Project Scientist, NASA Goddard Space Flight Center/UMBC

Fairbanks, AK – The two most important sea ice flights every year are two crossings of the entire Arctic Basin, north of Greenland and Canada all the way to Alaska. This year we decided to make the flights to and from Fairbanks earlier than usual because of the weather. The forecast at Thule was predicting a major storm system for the next few days. Storm season in Thule lasts Sept. 15–May 15, and every year blizzards with wind speeds of over 100 miles per hour and white out conditions hit the base, locking us down for a few days.

There are several challenges involved with these two flights. First, the survey lines are 1600 miles long and it is very rare to have such a large area free of clouds and fog, particularly over the Arctic Ocean. Imagine flying from New York to Colorado at 1500 feet above the surface and having neither clouds nor fog the whole way. Getting good data from our optical sensors, such as laser altimeters and digital cameras, we need clear conditions between the aircraft and the ice surface.


IceBridgeflight from Thule, Greenland to Fairbanks, AK that surveyed sea ice along atransect over the entire Arctic Basin. Basemap is MODIS satellite image showingcloud cover and sea ice over the Arctic Ocean.

A second challenge comes from predicting the weather in such a remote area. We have infrared satellite images and computer models available, but these models cannot be validated because there are no weather stations in the Arctic Ocean. Also, neither the forecast models nor satellite images show the weather features that are most important to us: low clouds and ice fog that disrupt the laser and camera measurements.

The third challenge is that we have to relocate the aircraft, crew and scientists to Fairbanks on very short notice, since the frequent changes in weather allow us to make this decision only a few hours before takeoff.

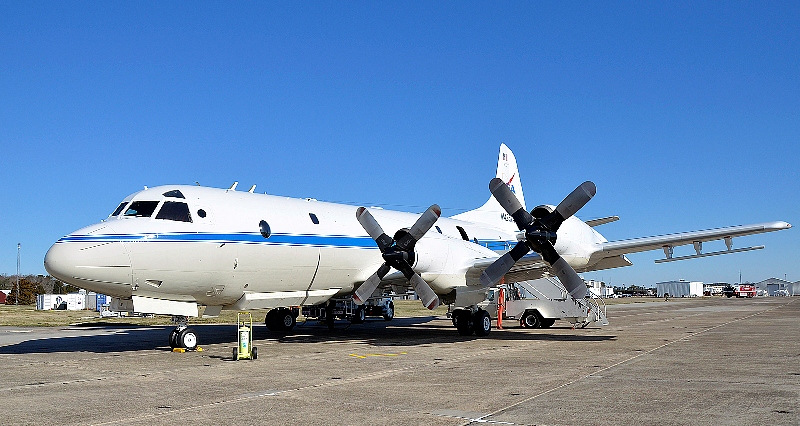
The NASA P-3 aircraft is being prepared on a chilly morning for a sea ice mission over the Beaufort and Chukchi Seas from Fairbanks, Alaska. Photo: Michael Studinger/NASA.

TheNASA P-3 aircraft is being prepared on a chilly morning for a sea ice missionover the Beaufort and Chukchi Seas from Fairbanks, Alaska. Photo: MichaelStudinger/NASA.

In order to characterize the state of the Arctic ice pack we need to survey large regions and determine the thickness of the multiyear ice that remains from the previous summer and the growth of new first year ice during the winter. We have had several successful flights over the Beaufort and Chukchi Seas from Fairbanks that surveyed primarily the newly formed first year ice in this area. This is a new area for IceBridge and an important data set to monitor changes in the Arctic environment.

We are planning to stay here in Fairbanks for a few more days before we return to Thule Air Base in Greenland to continue our campaign and survey the sea ice north of Greenland.

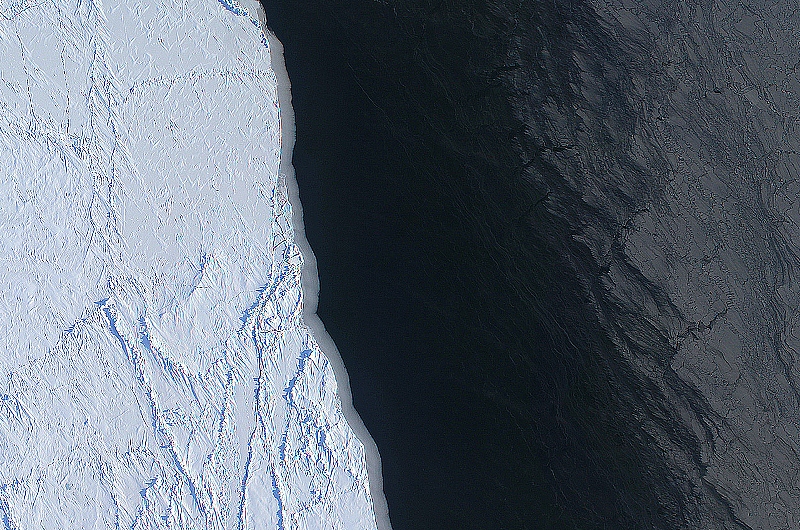
The margin of a large lead of open water (dark) and thingrease ice (gray, right) in the Chukchi Sea between Alaska and Russia. Theimage was create using several frames from the Digital Mapping System (DMS)onboard the NASA P-3. Image: NASA/DMS/Eric Fraim.


Getting Ready for the 2012 Arctic Campaign

By Michael Studinger, IceBridge Project Scientist, NASA Goddard Space Flight Center/UMBC

Wallops Flight Facility, Wallops Island, VA – Welcome to the fourth annual Arctic campaign with NASA’s Operation IceBridge. Over 75 days, we will collect data with two aircraft over the Greenland Ice Sheet, the Arctic Ocean and the Canadian ice caps. We will be based in Kangerlussuaq and Thule Airbase in Greenland, and in Fairbanks, Alaska for sea ice flights over the Beaufort Sea.

During the past several weeks, Operation IceBridge teams have worked at NASA’s Wallops Flight Facility on the eastern shore of Virginia, installing cutting-edge laser altimeters and extremely sensitive radars that will allow us to measure changes in sea ice thickness in the Arctic Ocean. We will also be monitoring changes in the thickness of ice sheets and glaciers that cover most of the subcontinent of Greenland and the Canadian Arctic Archipelago. We will start our campaign with NASA’s P-3B Orion research aircraft from Wallops at Thule Airbase in northern Greenland with sea ice missions over the Arctic Ocean. The extent and thickness of the sea ice cover in the Arctic Ocean is declining quickly and we are there to take measurements that document this change from year to year. The second plane in this year’s Artic campaign, a Falcon HU-25 jet operated by NASA’s Langley Research Center in Hampton, Va., will join the campaign later in April carrying the Land, Vegetation, and Ice Sensor (LVIS), a high-altitude laser altimeter capable of measuring a 2-km-wide (1.2-mile-wide) swath.

The P-3B aircraft inside the hangar at NASA’s Wallops Flight Facility in Virginia.

The P-3B aircraft inside the hangar at NASA’s Wallops Flight Facility in Virginia. Credit: Michael Studinger.

Before we can start collecting data over the Artic we have to make sure that all installed sensors on the P-3 work and are calibrated. In order to make extremely precise laser altimeter measurements of the ice surface elevation we calibrate the instruments using target sites at the Wallops Flight Facility that we have surveyed on the ground. A second test flight takes us out over the Atlantic Ocean, some 200 miles away from the coast, where we can switch on the radar systems from the Center for Remote Sensing of Ice Sheets (CReSIS) at the University of Kansas, without interfering with other systems. We use the radar signal that is bouncing back from the ocean surface to calibrate the radars. We also did a couple of maneuvers at high-altitude over the Atlantic to calibrate the antennas of the ice-penetrating radar systems that we will use to survey the sea ice, glaciers and ice sheets.

Research flying has little in common with everyday air travel. One of the maneuvers that we do during the test flights is to fly the aircraft at a 90° roll angle with the wings perpendicular to the horizon. Fasten your seat belts! You will (hopefully) never experience something like this on a commercial flight.

The P-3B on the ramp before a test flight. The antennas of the ice-penetrating radar system can be seen mounted under the wings.

The P-3B on the ramp before a test flight. The antennas of the ice-penetrating radar system can be seen mounted under the wings. Credit: Michael Studinger.

We are collaborating with other experiments such as CryoVEx, the CryoSat-2 calibration and validation campaign from the European Space Agency. We will also work closely together with teams that work on the ground and take measurements over sea ice in the Arctic Ocean, and do coordinated flights with an ER-2 high-altitude aircraft from NASA’s Dryden Flight Research Center in Edwards, Calif. The ER-2, a civilian research version of the Air Force’s U-2 , will carry the Multiple Altimeter Beam Experimental Lidar (MABEL). The ER-2 will fly out of Keflavik, Iceland, and climb to 60,000 feet on its way to Greenland to measure the same tracks as the P-3B Orion.

We have now completed all our test flights here at Wallops and are ready to go to Greenland where we hope to map much of the sea ice cover over the Arctic Ocean and the Greenland Ice Sheet.