Cryo Lab at Goddard’s Science Jamboree

By George Hale, IceBridge Science Outreach Coordinator, NASA Goddard Space Flight Center

On July 16, researchers from the Cryospheric Sciences Laboratory took part in this year’s Science Jamboree, part of a three-day employee engagement event at NASA’s Goddard Space Flight Center. Science Jamboree is a chance for Goddard employees to learn more about what scientists and engineers are doing in their labs and offices. The event features tables, posters and activities for the various missions and labs working at Goddard.

The lab’s table this year featured informational material from Operation IceBridge such as models of the NASA DC-8 and P-3B, hands on materials like extreme cold weather gear and a sample of an ice core from Greenland and posters showing off the lab’s research with messages in English, Danish and Greenlandic that were created through a collaboration between NASA, the U.S. Embassy in Copenhagen and the governments of Greenland and Denmark.

IMAG0126 IMAG0099 IMAG0129 IMAG0138 IMAG0118 IMAG0132

IceBridge Science Team Meets at UC Irvine

By George Hale, IceBridge Science Outreach Coordinator, NASA Goddard Space Flight Center
Twice a year the IceBridge science team meets to present their latest research, discuss the mission’s scientific aims and plan for the next campaign. On June 17 and 18 the science team met on the campus of the University of California Irvine, where researchers talked about IceBridge’s accomplishments and cooperative work with various agencies, discussed future directions for the mission and looked over proposed flight lines for the Antarctic campaign coming up this fall.

1038207

Participants of the IceBridge Science Team Meeting pose for a group photo on the campus of UC Irvine. Credit: UC Irvine / Bernd Scheuchl

1038208
Scientists in one of the sessions held during the IceBridge Science Team Meeting. Credit: UC Irvine / Bernd Scheuchl
1038209
Researchers look over proposed flight lines for the upcoming Antarctic campaign. Credit: UC Irvine / Bernd Scheuchl

Grounded in Truth

By George Hale, IceBridge Science Outreach Coordinator, NASA Goddard Space Flight Center
Measuring polar ice from the air calls for the kind of precision flying made possible by GPS, but the usefulness of those satellites doesn’t end there. GPS information like latitude, longitude and altitude make up a crucial part of IceBridge’s instrument data, showing where each data point was collected, and ground-based GPS gives researchers a benchmark useful for checking instrument accuracy. One of IceBridge’s instruments, the Airborne Topographic Mapper (ATM), uses a laser altimeter to build what is essentially a topographic map of the surface. On each flight IceBridge will pass over the airport’s ramp to make sure that the laser altimeter, or LiDAR, is properly calibrated. Because the airport ramps are large, flat and obstruction free areas of known elevation they act as a sort of Rosetta stone, giving the ATM team something to compare their elevation measurements against.

Vehicle with GPS mounted on the roof
Vehicle equipped with a GPS antenna (on roof) before a ground survey of the ramp at Thule Air Base, Greenland. Credit: NASA / Michael Studinger

Having up-to-date elevation data for the entire ramp is the key to these ramp passes. And although IceBridge is an airborne mission this data is collected on the ground by a GPS antenna-equipped car. By driving this car in a grid pattern over the entire ramp and processing the GPS data in specialized software researchers are able to build an elevation map for the entire ramp. This map gives something researchers can use to check instrument readings, and it also reveals something that many people may not expect.

Airport ramps may appear perfectly level and unchanging, but reality is different. First, the elevation of a ramp varies somewhat from one end to the other. “There is a relief of about 3 or 4 meters across the ramp,” said John Sonntag, ATM senior scientist. This relief gives an added benefit though because the slope gives more data to use for calibration. “If the survey shows a tilt of x degrees and the LiDAR shows a tilt of x plus 1, you know you need to make an adjustment,” Sonntag said.

Elevation map of Kangerlussauq airport ramp
Elevation map from a ground survey of the Kangerlussuaq airport ramp. Credit: NASA / ATM team

In addition to sloping, the ramps in Thule and Kangerlussuaq are changing slightly in elevation over time. Obviously any construction or repaving would change elevation slightly, but even the ground itself is rising. Although solid, Greenland’s bedrock has been pushed down and deformed over the years by the weight of the ice sheet. As Greenland’s ice sheet loses mass this downward force lessens and the bedrock starts rising—a process known as isostatic rebound. “In Thule, we’re seeing a rise of about two centimeters per year,” said Sonntag.

Two centimeters may not seem like much, but even that small of a change could affect instrument accuracy. To avoid this IceBridge does ground surveys of the ramps every year or two. Thanks to these regular surveys and continual checking of instrument calibration IceBridge researchers are able to provide the scientific community with accurate measurements of changing polar ice.

Rock, Ice and Fire: Volcanoes of Greenland's Past

By George Hale, IceBridge Science Outreach Coordinator, NASA Goddard Space Flight Center

During one of IceBridge’s online educational chats we had an interesting question from a fifth grade class in Hanover, N.H. “Are you flying near any volcanoes?” Nearby Iceland is famed for its geothermal activity, with hot springs and geysers, and volcanoes like the one that disrupted European air travel for weeks in 2010 (and caused minor concern for IceBridge mission planners at the same time) by spewing a large cloud of ash into the air.

Satellite image of the ash plume from Iceland's Eyjafjallajökull volcano on Apr. 17, 2010.

Satellite image of the ash plume from Iceland’s Eyjafjallajökull volcano on Apr. 17, 2010. Credit: NASA / MODIS Rapid Response Team

But unlike Antarctica, which has dozens of active and extinct volcanoes, Greenland is not known for having volcanic activity. Getting a handle on Greenland’s geology is hampered by the fact that the majority of the island is covered with hundreds or thousands of meters of ice. But geologists in the field who have studied the exposed rock along the coasts and on mountains above the ice found evidence of volcanoes in Greenland’s past.

About half of Greenland’s exposed surface is made up of rock ranging between 1.5 billion and just over 3 billion years old, making them some of the oldest on Earth. This rock is part of a large formation that spans from Greenland, through the Canadian Shield down to the Hudson Bay. The majority of Greenland’s bedrock is thought to be made up of this ancient rock, with portions of it bent and folded by motion of Earth’s tectonic plates much like how the Appalachian Mountains in the eastern United States and the Rockies out west were formed.

Flight path for Apr. 11 survey of Greenland's Geikie Peninsula

Flight path for Apr. 11 survey of Greenland’s Geikie Peninsula. Credit: NASA

Evidence of past volcanic activity can be seen in sediments carried by Greenland’s glaciers and in one of the most visually striking geologic features in Greenland, the Geikie Peninsula on Greenland’s east coast. And it turns out that this region’s characteristic geology has something in common with present-day volcanic activity in Iceland. Both come from molten rock welling up through a ridge in the middle of the North Atlantic Ocean, a boundary where the North American and Eurasian plates are moving apart.

About 60 million years ago, lava from the mid-ocean ridge flooded out over the landscape, creating a rock formation known as a flood basalt. Repeated floods of lava over the years are what give Geikie’s jagged peaks their distinctive layer cake appearance. Similar geologic structures can be seen in other parts of the world, like the Columbia River Basalt Group in the western United States.

A glacier between mountains on Greenland's Geikie Peninsula. The mountains on the Geikie Peninsula in Greenland consist mostly of flood basalts formed during the opening of the North Atlantic Ocean millions of years ago.

A glacier between mountains on Greenland’s Geikie Peninsula. The mountains on the Geikie Peninsula in Greenland consist mostly of flood basalts formed during the opening of the North Atlantic Ocean millions of years ago. Credit: NASA / Michael Studinger

The answer for those students was no, we weren’t flying near any volcanoes. But we did get to relate our previous experience with the Iceland volcano (and learn that their teacher had a flight delayed because of the same event), and tell them about volcanoes in Greenland’s past.

Seeing Data Collection Firsthand

By Donghui Yi, Remote Sensing Scientist, NASA Goddard Space Flight Center

Punta Arenas, Chile is a city with friendly people, rich history, beautiful beach, and spectacular lenticular clouds. Participating in IceBridge’s 2012 Antarctic campaign based at the Punta Arenas airport was an amazing experience for me. I study Airborne Topographic Mapper (ATM) laser waveforms and different tracking algorithms and their influence on elevation measurements. Participating in IceBridge flights let me see ATM instrument setup and operation firsthand.

The flights I was on covered the Antarctic Peninsula, Bellingshausen and Amundsen seas, West Antarctic ice sheet, Weddell Sea, Ronne and Filchner ice shelves and a portion of the East Antarctic ice sheet. The highest latitude we reached was over 86 degrees south. From NASA’s DC-8 aircraft, the beauty of Antarctica’s sea ice, coast, mountains and ice sheets is breathtaking. From a typical survey height of 500 meters above surface, you see an Antarctic you cannot see from surface or from a satellite image. It makes the over 11-hour flight an exciting and enjoyable journey each time.

Antarctic mountains seen from the DC-8
Antarctic mountains seen from the DC-8. Credit: NASA / Donghui Yi

It was also amazing to see the spatial and temporal variability of the clouds over Antarctica, which can go from the surface to several kilometers high and can be continuous or have numerous layers. Even between the surface and a typical survey altitude of 500 meters, there can be so many layers in between, low and high. The IceBridge team and airport meteorologists did an unbelievable job predicting where clear sky regions would be, a critical part for the missions’ success. Without this critical information, the management team would not be able to make the right decisions to determine survey passes.

The flight crew and instrument engineers are wonderful people to work with and their skills and dedication to the project command our utmost respect. The firsthand experience of sea ice and ice sheet data collection is invaluable to my research. This trip itself was a bridge between a scientist and engineers.

Scientific Snapshots: Using IceBridge Data in the Field

By George Hale, IceBridge Science Outreach Coordinator, NASA Goddard Space Flight Center

Every IceBridge flight adds to a growing collection of geophysical data. Gigabytes of information on surface elevation, ice thickness and sub-ice bedrock topography are collected, but collecting the data is only the beginning of the job. After each campaign, information is downloaded from the instruments and processed to be delivered to the National Snow and Ice Data Center in Colorado, who store IceBridge data and make it freely available to the public.

Preparing data to send to NSIDC is a long and painstaking process, usually taking about six months. Before even starting data processing for the Airborne Topographic Mapper, IceBridge’s laser altimeter instrument, it’s necessary to calculate aircraft position and attitude and even mounting biases on ATM’s laser itself. “Once all the calibrations take place, the processing of all the ATM lidar data can take place,” said ATM program manager Jim Yungel. After that, processing to remove returns from clouds and ice fog and quality checking takes place. And because there are two ATM lidars, one narrow-band and one medium-band, this process is done twice and the results are compared.

But sometimes researchers want a visual representation of something interesting in the field. By combining lidar data with rough GPS trajectories and information from the aircraft’s inertial navigation system, researchers like Yungel can use a custom-built graphics program to create visual representations of the ice. These snapshots of the surface aren’t meant to be precise, but to give IceBridge scientists a rough idea of what was seen, and when combined with images from the aircraft’s Digital Mapping System, it’s easy to see side-by-side, a representation of what information the instruments collect. Below are a few representations of features seen during 2012 Antarctic campaign flights.

A graphical representation of processed Airborne Topographic Mapper data.
A graphical representation of processed Airborne Topographic Mapper data from the 2011 Antarctic campaign showing the rift in Antarctica’s Pine Island Glacier. Credit: NASA / ATM Team


Animation showing ATM data representation of Pine Island Glacier rift and images from the Digital Mapping System
Animation showing a 2012 ATM data representation of Pine Island Glacier rift and images from the Digital Mapping System. Credit: NASA / ATM and DMS teams


Crevasses in a glacier seen from the DC-8 near the Ronne Ice Shelf on Nov. 1.
Crevasses in a glacier seen from the DC-8 near the Ronne Ice Shelf on Nov. 1. Credit: NASA / Jim Yungel
ATM data representation of the glacier crevasses seen on the Nov. 1, 2012 flight.
ATM data representation of the glacier crevasses seen on the Nov. 1, 2012 flight. Credit: NASA / ATM

IceBridge Guests Get Behind the Scenes View

By Maria Jose Viñas, Cryospheric Sciences Laboratory Outreach Coordinator, NASA Goddard Space Flight Center

We sure had a packed plane on today’s flight, with visitors from the U.S. Embassy in Santiago, the Nathaniel B. Palmer, a Punta Arenas newspaper and two local schools. The Chilean teachers are the first to ever accompany IceBridge on an Antarctic mission (five docents had a chance to go on Arctic flights last spring). Carmen Gallardo, who teaches biology at Punta Arenas’ Colegio Alemán (German School) to kids ages 13 to 18 and Mario Esquivel, an astronomy teacher for students ages 9 to 14 at the local Colegio Francés (French School), were selected by the American Embassy in Santiago to fly on the DC-8 based on their English skills and, more importantly, on their plans to share their IceBridge experience with their classrooms and colleagues.

Visitors prior to boarding an IceBridge survey flight
Visitors to IceBridge prior to a survey flight on Nov. 1. Credit: NASA / Maria Jose Viñas

“From the point of the U.S. Government, what we want the most is to reach the Chilean youth – and we do it through their educators,” said Dinah Arnett, public affairs representative from the U.S. Embassy in Santiago.

Arnett was impressed with the enthusiasm and commitment of both teachers: they thoroughly researched the IceBridge mission beforehand and patiently went through two last-minute flight cancellations. But, as Gallardo said after yesterday’s flight was scrubbed: “Third time’s the charm!”

At the end of the almost 12-hour flight, both teachers were in awe of the sights they had enjoyed over the Antarctic Peninsula and the Ronne Ice Shelf during the Ronne Grounding Line mission. And they both thanked the researchers for their willingness to share their science. In turn, the educators plan on spreading the IceBridge word: both will be creating multimedia exhibits and giving talks to students from and beyond their schools.

IceBridge project scientist Michael Studinger and Chilean teacher Mario Esquivel looking at a map on the NASA DC-8
IceBridge project scientist Michael Studinger and Chilean teacher Mario Esquivel looking at a map on the NASA DC-8. Credit: NASA / Jefferson Beck

Columbia University geophysicist Kirsty Tinto explains the science behind the gravimeter instrument
Columbia University geophysicist Kirsty Tinto explains the science behind the gravimeter instrument. Credit: NASA / Jefferson Beck

Port of Inquiry: IceBridge visits the Nathaniel B. Palmer

By George Hale, IceBridge Science Outreach Coordinator, NASA Goddard Space Flight Center

With its proximity to the Antarctic Peninsula, Punta Arenas, Chile, a city on the Strait of Magellan in southern South America, is a popular destination for scientists on their way to Antarctica. Not onlydoes NASA’s Operation IceBridge use the Punta Arenas airport as a home baseduring its Antarctic campaign in October and November, the city is also a base of operations for a variety of Antarctic science missions. During this year’s Antarctic campaign, the IceBridge team got to take a close up look at the United States Antarctic Program’sicebreaker Nathaniel B. Palmer, which calls Punta Arenas home.

On Oct. 24, Jamee Johnson and Chris Linden of the United StatesAntarctic Program led a group of IceBridge personnel on a guided tour of thePalmer. The research vessel is waiting in the port of Punta Arenas until lateDecember or early January, when it will carry scientists and their equipment toMcMurdo Station in Antarctica, conducting experiments along the way. Once there, passengers willoffload and a new group of people and gear will board the icebreaker for a returntrip to Punta Arenas.

IceBridge personnel standing outside the Nathaniel B. Palmer
IceBridge personnel on the dock in Punta Arenas in front of the Nathaniel B. Palmer. Credit: NASA / Christy Hanse nand USAP / Jamee Johnson

The Palmer is a 6,500 ton icebreaking research vessel thattravels to and from bases in Antarctica like United States’ McMurdo Station.The vessel sails from one of its home ports, like Punta Arenas, carrying scientists who do research along the way. During thetour, IceBridge personnel got to see some of the ship’s five labs, the galley,the infirmary and the ship’s bridge, where they met Sebastian Paoni, captain of the Palmer since2007.

Captain Sebastian Paoni talks to IceBridge people on the bridge
Palmer Captain Sebastian Paoni (right) meets visitors on the bridge. Credit: NASA / George Hale

In many ways, thePalmer is similar to other large, ocean-going research ships. There are placesfor crew and passengers to sleep, eat, relax, exercise and socialize. Withtrips to sea lasting several weeks at a time, ships like the Palmer need to beself-contained floating cities, carrying enough food, water, spare parts andother supplies needed to keep the crew and passengers safe and happy.

The big difference between the Palmer and other research vessels is that it has a reinforced hull designed to let it break through ice, opening a passage to travel through. There are limits to how thick of ice the ship can break through, so planning the ship’s route often requires satellite imagery and other data that can show where thinner ice is. Sailing through ice is a slow and often noisy process, but when your path is blocked by sea ice, slow and noisy beats not atall.

Science By Air and Sea

The Palmer and IceBridge’s aircraft both gather geophysical data, and despite the different nature of these platforms the instruments have some similarities. In the labs, Linden, a senior systems analystaboard the Palmer, showed IceBridge team members several different instruments, such as including a gravimeter and a sonar system used to map the ocean floor. Thesonar uses a technique to create swaths of data that resemble theswaths of elevation data produced by IceBridge’s Airborne Topographic Mapperinstrument. 

Probably the biggest similarities are dealing with motion and the changing array of instruments used. Scientists need to counteract motion from either a rolling ship or vibrating airplane, which is handled in both cases by referencing the instruments with data from GPS and inertial guidance systems. Also, much like on NASA’s aircraft, the instruments on the Palmer change depending on what is being studied. Changing the configuration of the ship’s equipment is something Johnson said is one of the most interesting parts of the job.

In return for graciously taking visitors on a tour of the ship, IceBridge invited some Palmer personnel to come along on a survey flight. People working on icebreakers rely on information about sea ice to plan their routes and although IceBridge data isn’t directly used, flying along will give them a chance to see how the mission measures ice from the air.

Palmer visitors stand on the helipad on the Palmer's stern
Palmer visitors stand on the helipad on the Palmer’s stern. Credit: NASA / Christy Hansen and USAP / Jamee Johnson

For more information about the Nathaniel B. Palmer, visit: http://www.usap.gov/usapgov/vesselScienceAndOperations/index.cfm?m=4

A Diplomatic Visit for IceBridge

By George Hale, IceBridge Science Outreach Coordinator, NASA Goddard Space Flight Center

On Oct. 25, IceBridge was joined by U.S. Ambassador to Chile Alejandro Wolff and his Secretary for Economic Affairs Josanda Jinnette. Ambassador Wolff and Ms. Jinnette traveled from Santiago on Oct. 24 and attended IceBridge’s evening science meeting that day. The following morning, they sat in on the morning pre-flight meeting and after a short safety briefing they boarded the DC-8 for an 11-hour-long survey of the Ferrigno and Alison ice streams that empty into the Bellingshausen Sea.

In addition to being a distinguished career diplomat, Wolff is interested in science, particularly in international scientific collaboration. “Science cooperation is an important part of the U.S. – Chile relationship,” Wolff said. Although this was his first flight with IceBridge, this wasn’t the ambassador’s first trip to Antarctica. He visited Palmer Station years ago and says that while flying over the continent isn’t the same as being on the ground, it does give a better sense of its dimensions.

U.S. Ambassador to Chile Alejandro Wolff in the IceBridge operations center at the Punta Arenas airport on the morning of Oct. 25.

U.S. Ambassador to Chile Alejandro Wolff in the IceBridge operations center at the Punta Arenas airport on themorning of Oct. 25. Credit: NASA / George Hale

Ambassador Wolff in the DC-8 cockpit shortly after takeoff on Oct. 25.

AmbassadorWolff in the NASA DC-8 cockpit shortly after takeoffon Oct. 25. Credit: NASA / George Hale

The ambassador and Ms. Jinnette exiting the DC-8 after another successful IceBridge survey flight.

Ambassador Wolff and Ms. Jinnette exiting the DC-8 after another successful IceBridgesurvey flight. Credit: NASA / Jefferson Beck

Q&A: Michael Studinger

By Maria-Jose Viñas, Cryospheric Sciences Laboratory Outreach Coordinator, NASA Goddard Space Flight Center 

Michael Studinger is Operation IceBridge’s project scientist. He trained as a geophysicist in Germany, his home country, before moving to the U.S. to take a position at the Lamont-Doherty Earth Observatory and then transferring to NASA Goddard Space Flight Center in 2010. Studinger has been studying polar regions for 18 years, expanding his initial focus on the geology and tectonics of the Antarctic continent to the overall dynamic of polar ice sheets.

IceBridge project scientist Michael Studinger

Operation IceBridge Project Scientist Michael Studinger. Credit: Jefferson Beck / NASA

Studinger recently returned from Greenland, where he was leading Operation IceBridge’s 2012 Arctic campaign.

This was IceBridge’s fourth Arctic campaign. How different was it from previous years?

We flew more than last year: During the 75 days we were there, we only had to cancel a single flight because of weather, something I’ve never seen before. Regarding sea ice, we have expanded coverage in terms of area. For the first time we went to the Chukchi and Beaufort Seas to collect data there. But the biggest change this year is that we published a new data product that we had to deliver to the National Snow and Ice Data Center before we even returned from the field. This product is being used by modelers and other scientists to make a better prediction of the annual sea ice minimum in the summer. We can now feed ice thickness measurements from March and early April into these predictions and see how they improve them.

What are the benefits of improving Arctic sea ice minimum predictions?

There seems to be enough people who have an interest in finding out how thick or thin the sea ice will be. People who live in the Arctic and shipping companies…they want to know, they want to prepare. It’s like long-range weather forecast: People who grow crops would like to know if they’re going to get a wet season or a dry season.

Also, it’s a relatively short-term prediction, so we’ll soon find out if the models are working or not. It helps building better models because you can compare the results to the reality in a few months.

This Arctic campaign, you teamed up with CryoVEx, ESA’s calibration and validation campaign for the CryoSat-2 satellite. How did it go?

We did two coordinated flights with them. We were in Thule, Greenland, and they were in Alert, Canada. We both took off at the same time and made sure we were over the same point in the Arctic Ocean with CryoSat-2 flying overhead. It was quite a bit of a coordination effort. We measured the same spot along the satellite track within a few hours. The CryoVEx team has instruments similar to ours, but also some that we don’t have. IceBridge has unique instrument suite for sea ice that includes the world’s only airborne snow radar. By combining all the data from all the instruments, we can learn a lot about what each instrument is seeing and what CryoSat-2 is actually measuring over sea ice.

How’s your average Arctic campaign?

We start in Thule because we want to get the sea ice flights out of the way early on, as long as it’s cold over the Arctic Ocean. It’s still fairly dark there, that far north [Thule is 750 miles north of the Arctic Circle]. We have just enough light in the second half of March to fly the sea ice missions, during the first three weeks of the campaign. Then we go down to central Greenland while it’s still cold there and start doing ice sheet flights, for three or four weeks. Then we go back to Thule because it’s getting too warm in southern Greenland, and we finish the ice sheet flights in the northern half.

Can you describe your daily routine while in Greenland?

We get up at 5 a.m. In Kangerlussuaq, we try to be in the air at 8:30, and in Thule we try to be flying at 8, when the airport opens. Eight hours later, we land. After that, we have a science meeting where we talk about how the flight went and the plan for the following day. Then we eat dinner, check email, look at data… all that before we go to bed and do it all over again the next day.

How do Arctic and Antarctic campaigns differ?

We use different aircraft: a P-3B for the Arctic and a DC-8 for Antarctica. In Greenland, when we fly out of Kangerlussuaq or Thule, we start collecting data pretty much right away, except for the sea ice missions. In Antarctica, we “commute” from Punta Arenas in southern Chile, which takes a few hours. Then we can only collect data for a few hours before we go back home to Punta Arenas. Typically, in the DC-8 we fly for 11 to 11.5 hours, much longer than the about 8 hours of flight with the P-3.

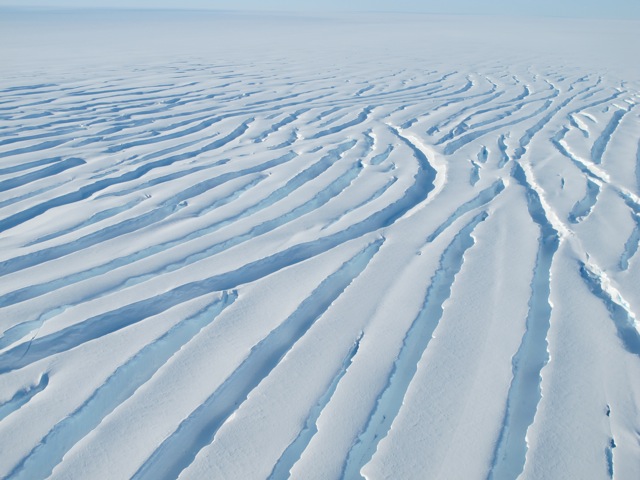
We actually fly more instruments on the P-3: the accumulation radar and the magnetometer (which is much easier to install on the P-3 than on the DC-8). We don’t really have the room in the fuselage to mount the accumulation radar antennas and there’s not really much of a need to use it in Antarctica. The snow accumulation in Greenland is higher. We can actually see annual layers with the accumulation radar but it’d be far more difficult in Antarctica because less snow falls there.

Personally, do you prefer one campaign to the other?

No, they’re just different. It’s a different airplane: the DC-8 is much more comfortable, less noisy. You don’t have the vibration of the P-3, so you can actually get a lot of work done on the transit flights. But the flights are very long.

And scientifically, is one campaign more interesting than the other?

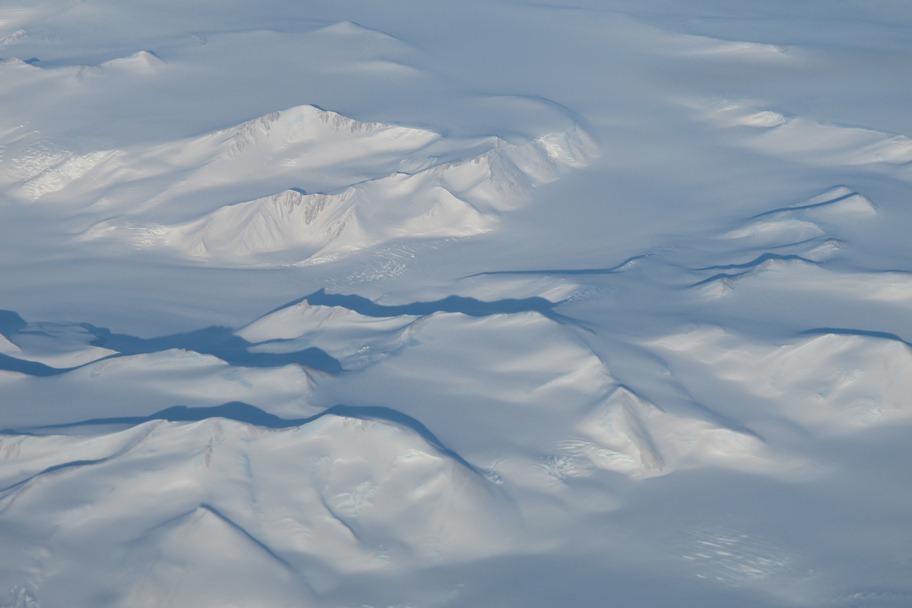
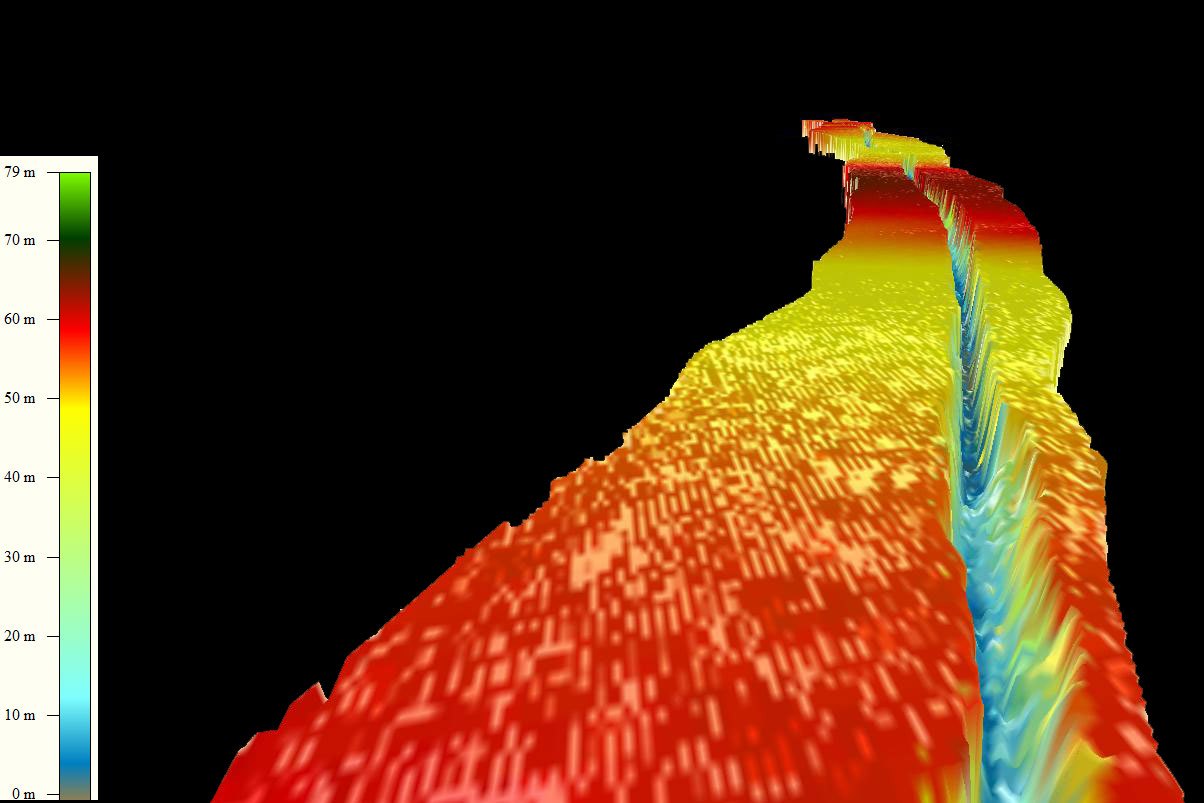
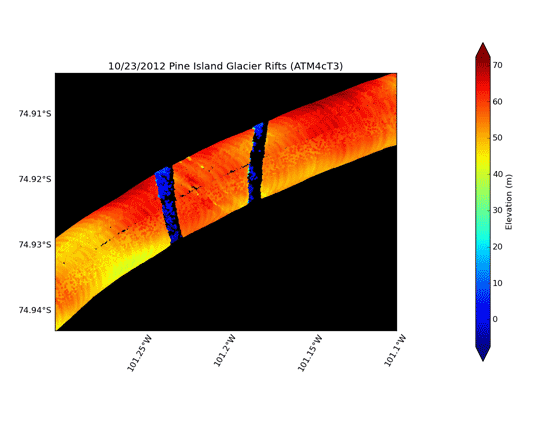
Not for me. Most of my work I’ve done in Antarctica, but I’m getting more and more interested in what Greenland has to tell us. If you look at the two biggest glaciers we study, Jakobshavn Isbrae in Greenland and Pine Island Glacier in Antarctica, the kind of mechanism through which both glaciers are losing ice is similar — warm ocean water is melting the ice from underneath. So we’re studying similar processes. Antarctica is far more challenging to get there and collect data, but from a scientific point we need to do both, otherwise we’re missing part of the picture.

What’s the 2012 Antarctic campaign going to look like?

It’s going to be shorter for a number of reasons, mostly because the aircraft has already been committed for an international multi-aircraft experiment in Thailand, and it’s also committed afterward. We’ll try to fly as much as we can, we’ll be using two aircraft: a G-V from the National Science Foundation, flying at high altitude, and NASA’s DC-8 flying low.

What will the future bring for IceBridge?

The plan is we will start using unmanned aerial vehicles and we’ll probably be doing it mostly over sea ice in the Arctic Ocean, but we don’t know the details yet. We will be doing some test flights over the Arctic Ocean later this year with the Global Hawk, either with the radar or laser altimeter onboard. I don’t think we can replace manned aircraft completely over the course of IceBridge.

After ICESat-2 launches, will IceBridge continue to some extent?

There will always be airborne campaigns to some degree, because there are some datasets that we can only collect from planes, and we will also need to calibrate and validate the satellite data. We need a variety of different scales, wavelengths, different types of measurements in order to really answer the science questions that we have, such as what is the contribution of Greenland to sea level rise in the next 20 or 30 years. For example, if we only have ICESat-2 collecting measurements of how the surface elevation is changing, we’ll know a lot, but we’ll never be able to answer with certainty what is causing these changes. It’s almost like you’re taking the pulse of a patient; you’re only looking at the symptoms of the illness without understanding what’s causing it. In order to find out why the ice sheet is changing its surface, we need to understand what’s beneath the ice sheet because that’s what’s driving a lot of the dynamic changes. And those are datasets that you can’t collect from space, you need an airplane to go in there and get the greater picture of what’s below there and other things, like snow accumulation, which can be done much better from airplane. It’s not a single satellite that will provide us the answer, not a single airborne measurement – it all has to come together.

A Spanish version of this post is available on National Public Radio’s Science Friday blog.