By George Hale, IceBridge Science Outreach Coordinator, NASA Goddard Space Flight Center
Every IceBridge flight adds to a growing collection of geophysical data. Gigabytes of information on surface elevation, ice thickness and sub-ice bedrock topography are collected, but collecting the data is only the beginning of the job. After each campaign, information is downloaded from the instruments and processed to be delivered to the National Snow and Ice Data Center in Colorado, who store IceBridge data and make it freely available to the public.
Preparing data to send to NSIDC is a long and painstaking process, usually taking about six months. Before even starting data processing for the Airborne Topographic Mapper, IceBridge’s laser altimeter instrument, it’s necessary to calculate aircraft position and attitude and even mounting biases on ATM’s laser itself. “Once all the calibrations take place, the processing of all the ATM lidar data can take place,” said ATM program manager Jim Yungel. After that, processing to remove returns from clouds and ice fog and quality checking takes place. And because there are two ATM lidars, one narrow-band and one medium-band, this process is done twice and the results are compared.
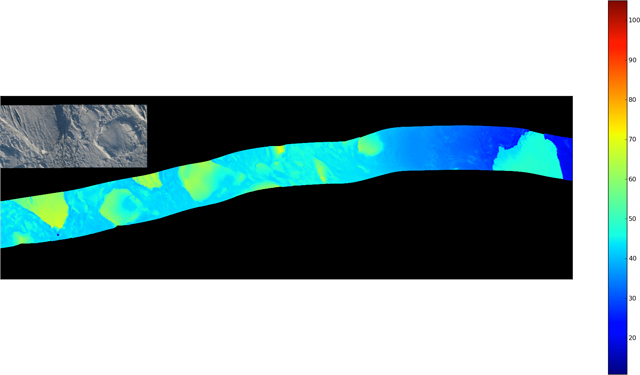
But sometimes researchers want a visual representation of something interesting in the field. By combining lidar data with rough GPS trajectories and information from the aircraft’s inertial navigation system, researchers like Yungel can use a custom-built graphics program to create visual representations of the ice. These snapshots of the surface aren’t meant to be precise, but to give IceBridge scientists a rough idea of what was seen, and when combined with images from the aircraft’s Digital Mapping System, it’s easy to see side-by-side, a representation of what information the instruments collect. Below are a few representations of features seen during 2012 Antarctic campaign flights.
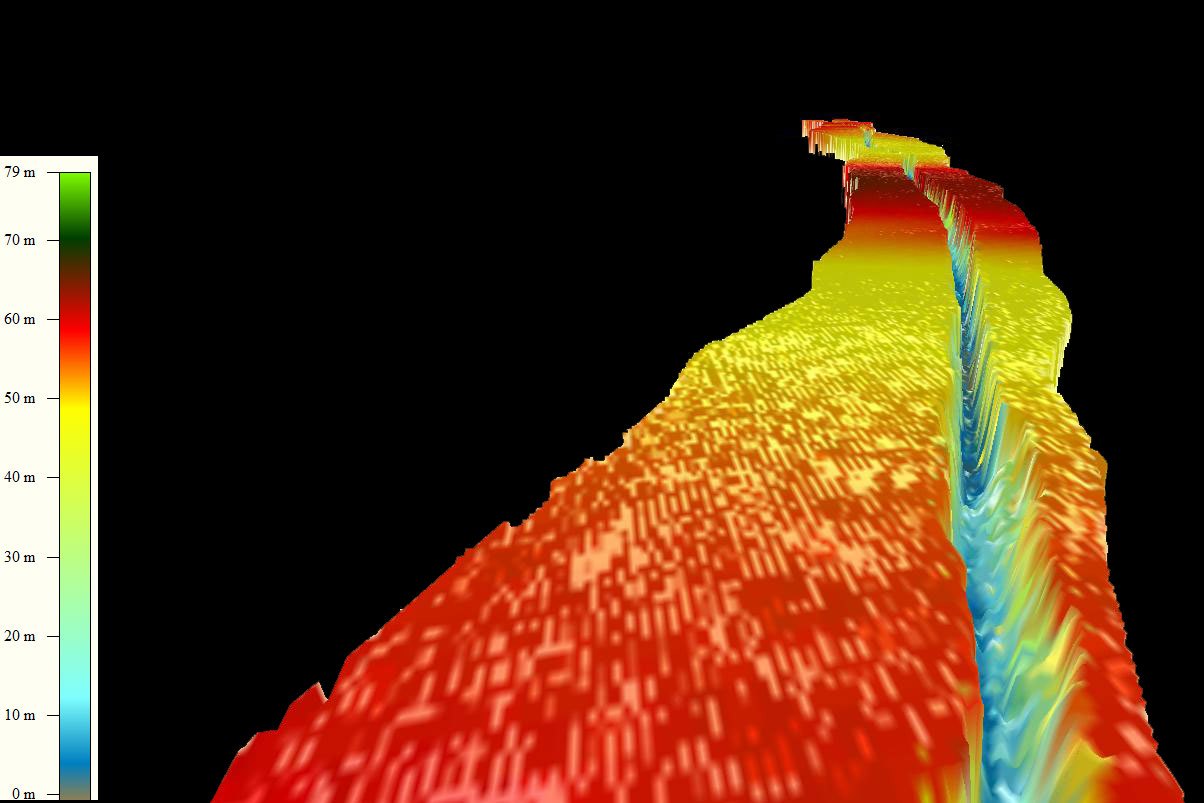
A graphical representation of processed Airborne Topographic Mapper data from the 2011 Antarctic campaign showing the rift in Antarctica’s Pine Island Glacier. Credit: NASA / ATM Team
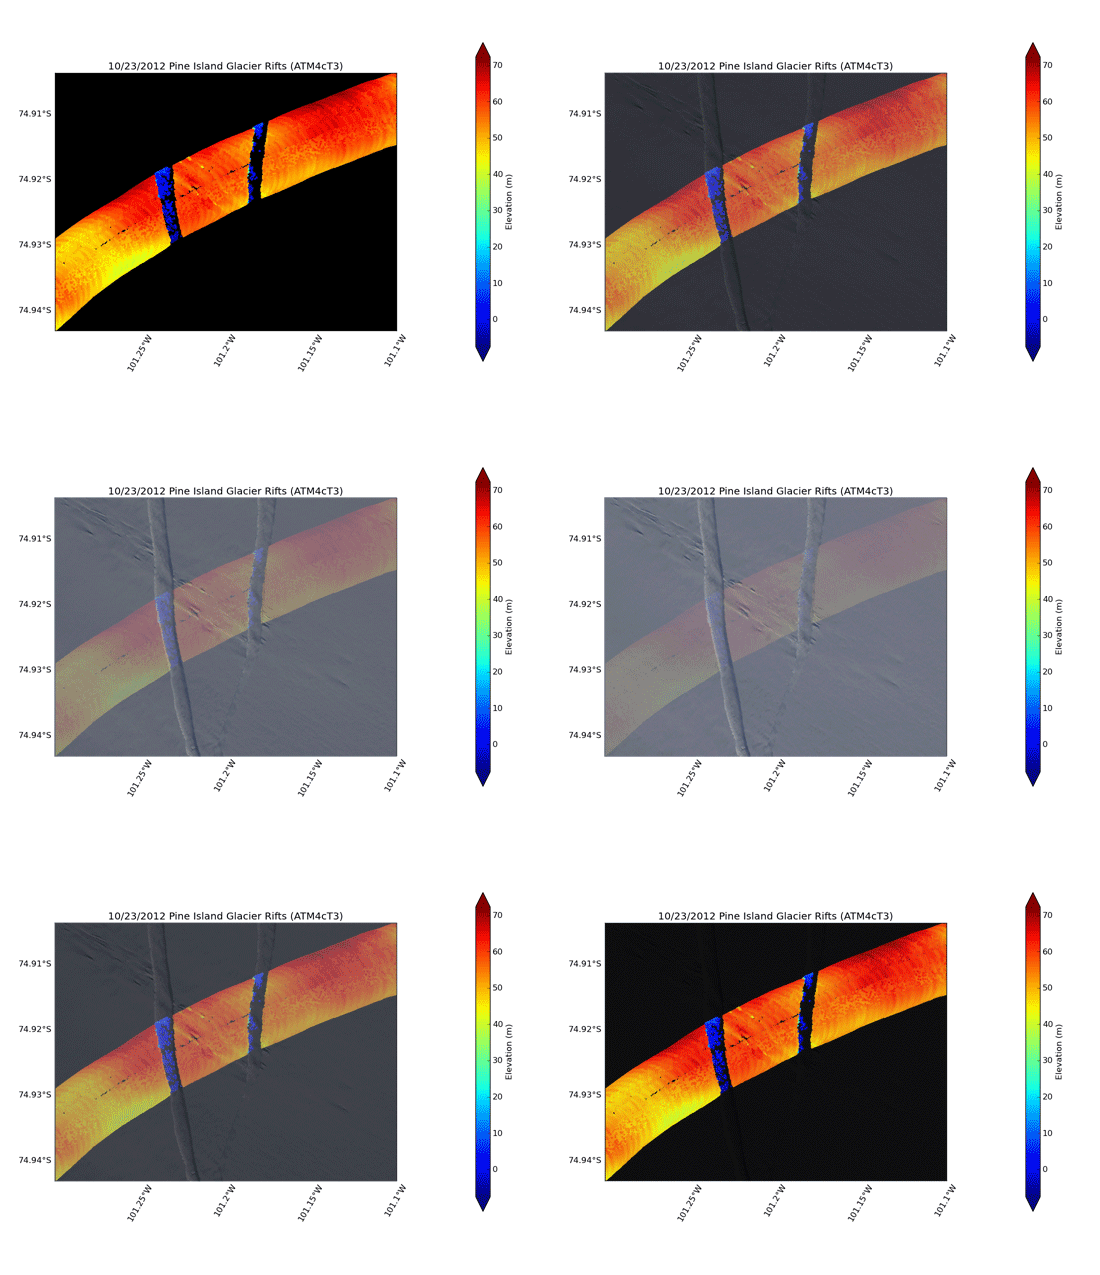
Animation showing a 2012 ATM data representation of Pine Island Glacier rift and images from the Digital Mapping System. Credit: NASA / ATM and DMS teams
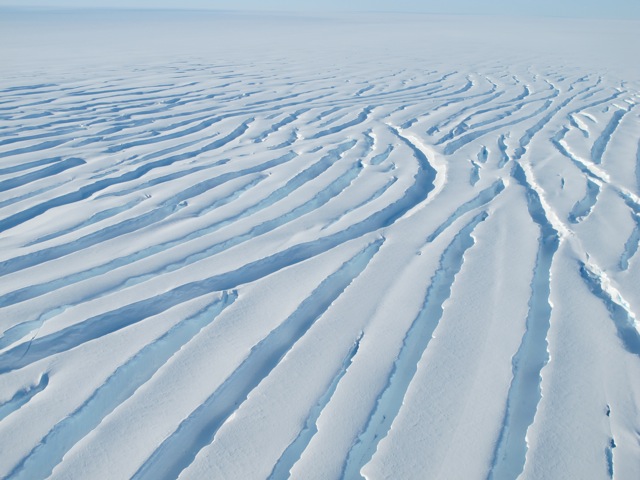
Crevasses in a glacier seen from the DC-8 near the Ronne Ice Shelf on Nov. 1. Credit: NASA / Jim Yungel
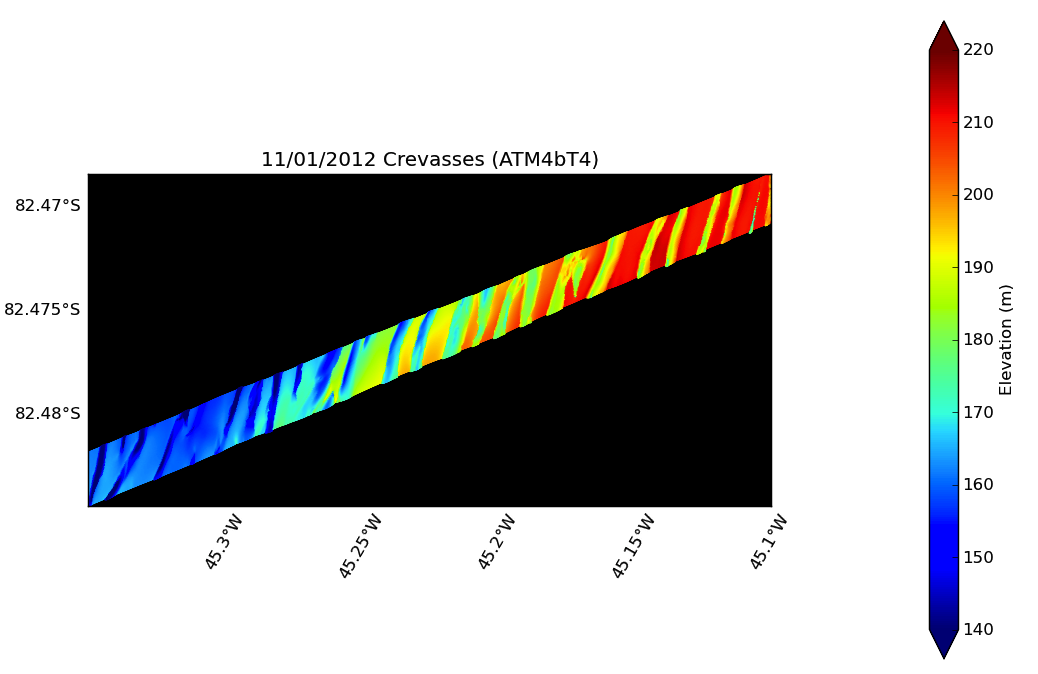
ATM data representation of the glacier crevasses seen on the Nov. 1, 2012 flight. Credit: NASA / ATM


