IceBridge Field Work – A Project Manager's Perspective

By Christy Hansen, IceBridge Project Manager, NASA Goddard Space Flight Center

Field work in the Arctic is a unique and challenging experience. It takes an experienced and tough team to complete mission objectives from start to finish despite the biting cold, long days and noisy environment. Early morning temperatures are often in the negative single digits, and the IceBridge team powers through it preparing for flight each day. A typical day’s work can range 12 to 14 hours, a schedule that is repeated daily until the airport is closed or until the flight crew reaches a required hard down day.

My project management perspective allows me to take a step back and appreciate not only the technical expertise of our instrument and flight crew teams, but the masterful choreography that unwinds each day to ensure the P-3B aircraft is prepped and ready, the instruments are powered on and in working condition, and the weather and corresponding science flight plan has been assessed and defined. Being actively involved in all phases of Operation IceBridge makes for a stronger and well-versed leader better able to assist any part of the team at any time. By doing this, I can ensure we are on track to meet our mission and science requirements, assist with troubleshooting in and out of the field, better manage project milestones, and ensure streamlined communication across all IceBridge disciplines with a common goal.

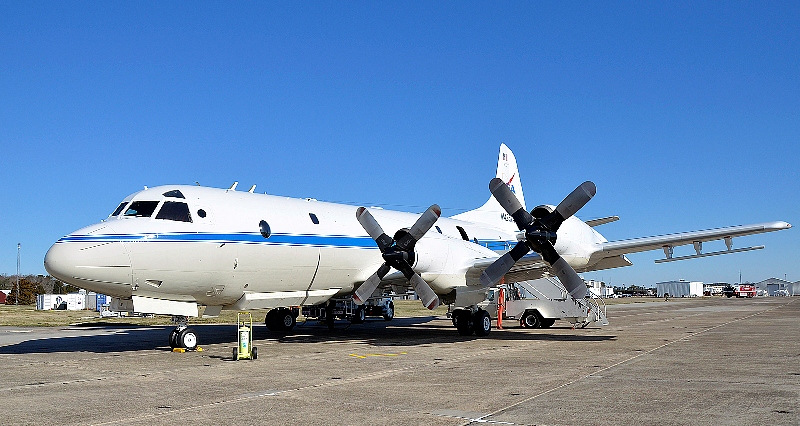
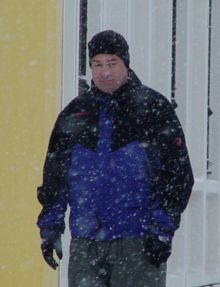
IceBridge project manager Christy Hansen on the stairway to NASA's P-3B.
IceBridge project manager Christy Hansen on the stairway to NASA’s P-3B. Credit: NASA / Christy Hansen
But why do we do this? How do we do this? 

We do all of this in the name of science, collecting polar geophysical data that will help characterize the health of the Arctic and Antarctic. The in-field data and derived data products IceBridge produces are helping to show annual changes in the ice. These data can be entered into models that can more accurately predict what might happen in the future in terms of ice sheet, glacier, and sea ice dynamics, and ultimately sea level rise; all of which have serious consequences for climate change.

But how do we reach these science goals? The steps and teamwork required are simply astounding. Each part of our team is like a puzzle piece and everyone is needed to complete the puzzle. All teams must clearly know their individual responsibilities, but also be able to work together and mesh where their job ends and another begins.

The choreography starts in the beginning, or planning phase where the science team establishes targets of interest on the ice in accordance with our level 1 science requirements. Then our flight planner designs survey flights, having a unique ability to efficiently mesh the science targets with the range and flight dynamic capabilities of the P-3B aircraft.

Next the aircraft office at NASA’s Wallop’s Flight Facility prepares the P-3B for deployment to some of the harshest environments on Earth and supplies the flight crew that executes the specific flight paths over our required science targets. The instrument teams provide the instrumentation—laser altimeters, radars, cameras and a gravimeter and magnetometer—and expertise in operating equipment and processing data during and after flights. Our logistics team deploys to the field ahead of time, establishing security clearances, local transportation and accommodations, and internet and airport utilities.

Finally, our data center ingests and stores the data that our team collects, ensuring it’s useable and available to the wider community. Our data is not only used by polar scientists and other researchers around the world, it is also used to help satellite missions like the European Space Agency’s CryoSat-2 and NASA’s ICESat-2 calibrate and validate satellite instrumentation.

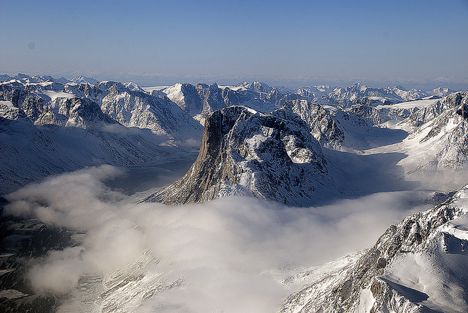
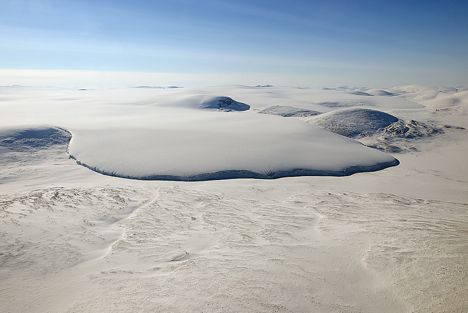
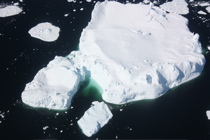
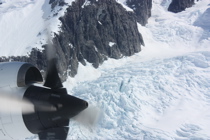
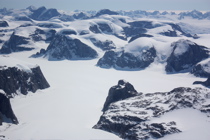
A view of ice from NASA's P-3B airborne laboratory.

A view of ice from NASA’s P-3B airborne laboratory. Credit: NASA / Christy Hansen

And finally, a day in the field …

Assuming a standard 8 a.m. local takeoff and eight hour mission duration, we generally have three major groups who follow different schedules pre-flight each morning.

The P-3 maintenance and flight engineer crew typically starts the earliest, heading to the airport about three hours before takeoff. They prep and warm up the plane, conduct some tests and fuel it, all in preparation for the instrument team arrivals and flight operations.

In parallel with aircraft prep, IceBridge’s project scientist, project manager and flight planner team head to the weather office. The team works with local meteorologists, reviewing satellite imagery and weather models to determine the optimal weather patterns that support our flight requirements—clear below 1500 feet, the altitude we typically fly—and final target selection.

In the meantime, the instrument teams arrive at the aircraft to power up and check their systems prior to takeoff. By 7:30 a.m., the aircraft doors close, and we take off by 8. Our eight-hour flights range between flying high and fast, to low and slow over our targets, which include geophysical scans of ice sheets, glaciers, and sea ice.

We typically land around 4 p.m., close out the plane, check data and meet at 5:30 for a science meeting. Many folks continue to work for a few hours afterward, processing data or writing mission reports. All of this is repeated daily, for up to 6 days in a row, which can be exhausting, but in the name of important scientific research, an amazing team, and majestic polar landscapes, I could not imagine anything else.


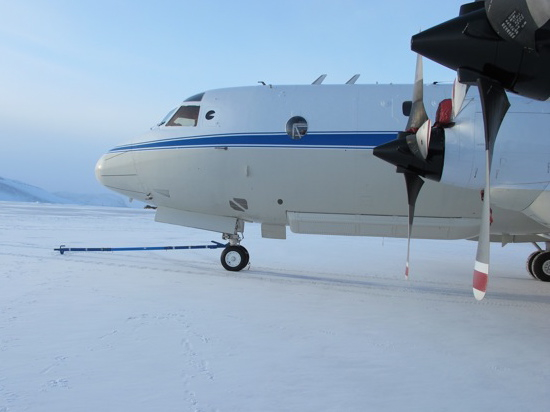
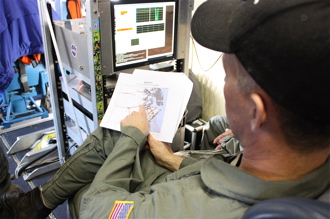
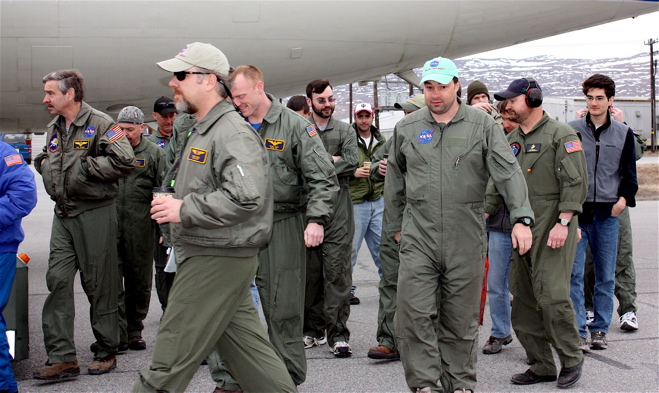
Crew members working on the P-3B. Credit: NASA / Christy Hansen

Getting Ready for the 2012 Arctic Campaign

By Michael Studinger, IceBridge Project Scientist, NASA Goddard Space Flight Center/UMBC

Wallops Flight Facility, Wallops Island, VA – Welcome to the fourth annual Arctic campaign with NASA’s Operation IceBridge. Over 75 days, we will collect data with two aircraft over the Greenland Ice Sheet, the Arctic Ocean and the Canadian ice caps. We will be based in Kangerlussuaq and Thule Airbase in Greenland, and in Fairbanks, Alaska for sea ice flights over the Beaufort Sea.

During the past several weeks, Operation IceBridge teams have worked at NASA’s Wallops Flight Facility on the eastern shore of Virginia, installing cutting-edge laser altimeters and extremely sensitive radars that will allow us to measure changes in sea ice thickness in the Arctic Ocean. We will also be monitoring changes in the thickness of ice sheets and glaciers that cover most of the subcontinent of Greenland and the Canadian Arctic Archipelago. We will start our campaign with NASA’s P-3B Orion research aircraft from Wallops at Thule Airbase in northern Greenland with sea ice missions over the Arctic Ocean. The extent and thickness of the sea ice cover in the Arctic Ocean is declining quickly and we are there to take measurements that document this change from year to year. The second plane in this year’s Artic campaign, a Falcon HU-25 jet operated by NASA’s Langley Research Center in Hampton, Va., will join the campaign later in April carrying the Land, Vegetation, and Ice Sensor (LVIS), a high-altitude laser altimeter capable of measuring a 2-km-wide (1.2-mile-wide) swath.

The P-3B aircraft inside the hangar at NASA’s Wallops Flight Facility in Virginia.

The P-3B aircraft inside the hangar at NASA’s Wallops Flight Facility in Virginia. Credit: Michael Studinger.

Before we can start collecting data over the Artic we have to make sure that all installed sensors on the P-3 work and are calibrated. In order to make extremely precise laser altimeter measurements of the ice surface elevation we calibrate the instruments using target sites at the Wallops Flight Facility that we have surveyed on the ground. A second test flight takes us out over the Atlantic Ocean, some 200 miles away from the coast, where we can switch on the radar systems from the Center for Remote Sensing of Ice Sheets (CReSIS) at the University of Kansas, without interfering with other systems. We use the radar signal that is bouncing back from the ocean surface to calibrate the radars. We also did a couple of maneuvers at high-altitude over the Atlantic to calibrate the antennas of the ice-penetrating radar systems that we will use to survey the sea ice, glaciers and ice sheets.

Research flying has little in common with everyday air travel. One of the maneuvers that we do during the test flights is to fly the aircraft at a 90° roll angle with the wings perpendicular to the horizon. Fasten your seat belts! You will (hopefully) never experience something like this on a commercial flight.

The P-3B on the ramp before a test flight. The antennas of the ice-penetrating radar system can be seen mounted under the wings.

The P-3B on the ramp before a test flight. The antennas of the ice-penetrating radar system can be seen mounted under the wings. Credit: Michael Studinger.

We are collaborating with other experiments such as CryoVEx, the CryoSat-2 calibration and validation campaign from the European Space Agency. We will also work closely together with teams that work on the ground and take measurements over sea ice in the Arctic Ocean, and do coordinated flights with an ER-2 high-altitude aircraft from NASA’s Dryden Flight Research Center in Edwards, Calif. The ER-2, a civilian research version of the Air Force’s U-2 , will carry the Multiple Altimeter Beam Experimental Lidar (MABEL). The ER-2 will fly out of Keflavik, Iceland, and climb to 60,000 feet on its way to Greenland to measure the same tracks as the P-3B Orion.

We have now completed all our test flights here at Wallops and are ready to go to Greenland where we hope to map much of the sea ice cover over the Arctic Ocean and the Greenland Ice Sheet.

Ice Cap Recap

From: Kathryn Hansen, NASA’s Earth Science News Team / Cryosphere Outreach

May 16, 2011

Last month, IceBridge surveyed Sukkertoppen Ice Cap — a mass of ice southwest of the mission’s base in Kangerlussuaq, Greenland. I didn’t know what to expect from an ice cap. Would it resemble the vast, white expanse of the Greenland Ice Sheet next door?

At the surface, Sukkertoppen looked remarkably like an ice sheet. After all, both form from the accumulation of snow compacted over thousands of years. Before long we reached the rugged mountains and blue-green fjord that separates the cap from the main ice sheet, and we turned back for another pass.

On April 8, 2011, IceBridge flew a mission to coastal areas in southwest Greenland. Mountains and an open-water fjord surround one of the mission’s targets, a small ice cap called Sukkertoppen Isflade. Credit: NASA/Michael Studinger

Ice caps are simply small versions of ice sheets, measuring in at a maximum area of 50,000 square kilometers (about 19,000 square miles). Anything larger is considered an ice sheet. They’re also thinner. It’s their small stature that makes ice caps more prone to melt in a warming Arctic.


Charles Webb of NASA’s Goddard Space Flight Center in Greenbelt, Md., explains the importance of monitoring ice caps in the Canadian Arctic. Credit: NASA/Jefferson Beck

South of Sukkertoppen lies the Canadian Arctic – home to the largest amount of ice outside of Greenland and Antarctica and contributing significantly to sea level rise.

IceBridge is adding to the long-term record of changes to the ice caps. On May 5, IceBridge surveyed the Devon Ice Cap – among the Canadian Arctic’s top ten largest caps. Then on May 10, the P-3 surveyed several glaciers and small ice caps on Ellesmere Island, Axel Heiberg Island and Meighen Island, including the Prince of Whales Ice Field and the Agassiz Ice Cap.

Finally on May 12, IceBridge surveyed the Barnes Ice Cap. Barnes is a curiosity because it is considered a significant remnant of the vast Laurentide Ice Sheet the covered most of Northeast America and Canada during the last glacial. NASA previously used the ATM laser altimeter to map the ice cap in 1995, 2000 and 2005, showing a slight acceleration in thinning of the ice cap.

“It’s our hope that by combining these data sets we’ll have a long term time series about whats happening there so we can better understand the dynamic of the ice caps as well as use them as early warning indicators of what is happening in our climate,” said Charles Webb of NASA’s Goddard Space Flight Center in Greenbelt, Md.

On May 12, IceBridge surveyed Barnes Ice Cap on Baffin Island. In addition to mapping its surface elevation, instruments also measured the bedrock topography, which will allow scientists to better model ice dynamics and estimate when the Barnes Ice Cap will be completely melted. Credit: NASA/Michael Studinger

Welcome to the 2011 Arctic Campaign

From: Kathryn Hansen, NASA’s Earth Science News Team/Cryosphere Outreach Specialist


On March 14, NASA’s P-3B landed in Thule, Greenland, for the start of the Arctic 2011 campaign of Operation IceBridge. Credit: NASA/Jim Yungel


On March 14, NASA’s P-3B aircraft landed in Thule, Greenland, where it will be based for the first leg of the Arctic 2011 campaign of Operation IceBridge. It’s our third annual campaign over the frozen north, ensuring the continuity of ice elevation measurements that scientists use to monitor change. This year, IceBridge is bigger than ever before and delving into new areas of exploration. Read more about the Arctic 2011 campaign and watch the video here.

Follow this blog throughout the 10-week campaign to read about the mission from the perspective of the scientists and crew on the ground (and in the air) who make the mission possible. They will give a behind-the-scenes account of individual flights and daily life in the field. They will share pictures and video from the sky and ground. And they will discuss the science questions being probed by the array of instruments onboard the flying laboratories. Welcome aboard!

Mission participants chat inside the P-3B during transit on March 14 from NASA’s Wallops Flight Facility in Wallops Island, Va., to the mission’s base in Thule, Greenland. Credit: NASA/Jim Yungel

IceBridge teams arrive in cold and sunny Thule, Greenland. Credit: NASA/Jim Yungel

The LVIS 86 Pole Flight

From: Scott B. Luthcke, Geophysicist, NASA’s Goddard Space Flight Center

November 4, 2010, 8:05 p.m. EDT

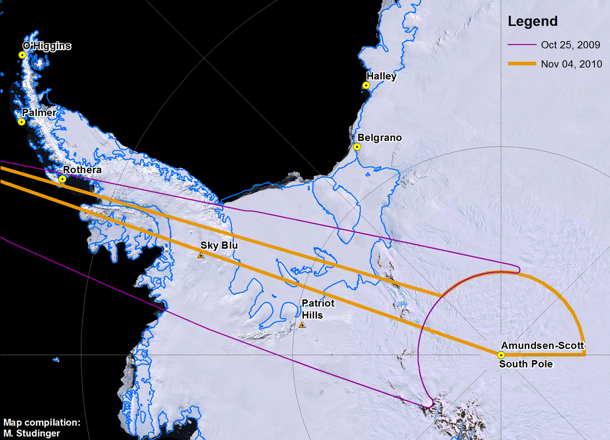
After several days without flights due to unfavorable weather over Antarctica, the Operation Ice Bridge DC-8 is in flight supporting its latest mission. The mission today is the LVIS 86 pole flight. It’s a long 12-hour mission during which the DC-8 will navigate around the South Pole following an arc of -86 deg. latitude at an altitude of 35,000 feet. The South Pole arc will enable NASA’s Land, Vegetation and Ice Sensor (LVIS) to map the surface of the interior of the ice sheet with a 2-kilometer-wide swath, and 25-meter spatial resolution within the swath. This mission will extend the coverage around the pole first collected by LVIS during a 2009 mission. In addition to LVIS, NASA’s Digital Mapping System (DMS) will also be collecting data during this flight. Two other instruments, NASA’s Airborne Topographic Mapper and Kansas University’s MCoRDS radar, typically operate only at lower altitudes, but today both are experimenting with new operational modes and equipment that may allow them to collect data from higher altitudes with LVIS.

The LVIS surface height mapping data provide an important datum to calibrate measurements of ice sheet surface elevation obtained from the Ice Cloud and land Elevation Satellite (ICESat) laser altimeter. ICESat was in a near-polar orbit with the laser altimeter surface profiles densely converging in an arc around the south pole at -86 deg. Therefore, the swath of data LVIS is collecting today, along with that collected in the 2009 pole arc flight, intersects nearly 70 percent of ICESat orbits and provides over a million LVIS and ICESat difference observations for comparison. It’s a unique set of data leveraging the converging satellite tracks around the pole. In addition, the LVIS observations will provide an important datum to monitor long-term interior ice sheet change with respect to current and future near-polar satellite mission data. The DMS and MCoRDS systems complement and enhance the LVIS data by providing high-resolution surface imagery and bedrock topography respectively.

Principal investigator Bryan Blair and scientist Michelle Hofton are running LVIS for today’s mission. Through the magic of technology, lead instrument engineer David Rabine is supporting the mission via xchat while he is on an airplane flying back to the United States after spending the previous three weeks in the field with the instrument. LVIS obtains measurements of surface height using a laser altimeter approach. A laser pulse is transmitted from the instrument, and is reflected back from the surface where the return pulse is recorded. The distance, or range from the instrument to the reflecting surface, is computed as the round trip time of flight of the pulse divided by two (to get the one-way travel time) and then divided by the speed of light. GPS receivers are used to compute the position of the instrument, while the pointing or direction of flight of the laser pulse is determined using instrument orientation data provided by a gyro attitude sensor. The surface elevation for each laser shot can then be computed from these data using the position of the instrument, the direction of the laser pulse travel and the distance or range of the laser pulse travel to the surface.

Credit: NASA/Michael Studinger

Nearly 30 minutes into the flight the excitement ramped up as the pilots prepared to perform the LVIS instrument calibration maneuver. Everyone took their seats and strapped in. A few minutes later the go was given to perform the maneuver and the airplane pitched up and down several times followed by several rolls left and right, giving us all a roller coaster ride. After a few minutes all was clear and we were back to business.

Now, over six hours into the mission we have completed the data collection for the pole arc and are heading back to Punta Arenas, Chile. On the transit back we flew directly over the South Pole! The mission was clearly a success with mostly clear skies and a full data collection from the instruments. Everyone is looking forward to getting on the ground, having a good dinner, and getting rested up for, potentially, another flight tomorrow.

The South Pole Station was easily visible during a flight there on Nov. 4. Credit: Digital Mapping System (DMS) group

Welcome to the Operation IceBridge 2010 Antarctic Campaign

From: Michael Studinger, IceBridge project scientist, Goddard Earth Science and Technology Center at the University of Maryland


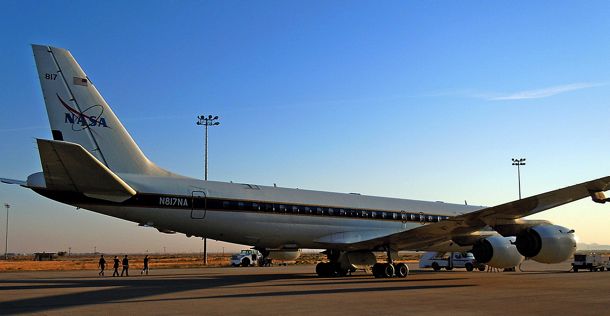
The DC-8, parked outside the hanger at NASA’s Dryden Flight Research Center, is prepared for a instrument test flight. Credit: NASA/Michael Studinger

Oct. 17, 2010

Dryden Flight Research Center, CA — Welcome to our 2010 Antarctic campaign with NASA’s DC-8 Flying Laboratory. For the past two weeks Operation IceBridge teams have been busy installing instruments and sensors onto the DC-8 aircraft here in Palmdale, Calif., at NASA’s Dryden Flight Research Center. Over the next couple of weeks we will fly with the DC-8 over Antarctica to measure changes in thickness of the sea ice surrounding Antarctica and to monitor changes in the thickness of ice sheets and glaciers that cover 98% of the Antarctic continent. 

But before we can go south we have to go through a series of test flights here in California to make sure that all the installed sensors work and to calibrate our science instruments. In order to do this we fly over target sites in the Mojave Desert that we have surveyed on the ground a few days before the test flights. The desert environment that we have selected for our test flights here is very different from the barren land of snow and ice that we will be flying over the next couple of weeks and we all enjoy the low altitude flights over the Mojave Desert, the San Gabriel Mountains and the San Andreas Fault. When the pilots ask you if it would be a problem if the belly of the aircraft is facing the sun you know that you are in the world of research flying. We did a couple of 90 roll maneuvers at high altitude over the Pacific Ocean to calibrate the antennas of the ice-penetrating radar systems that we will use to survey sea ice, glaciers, and ice sheets.
Instrument test flight over the San Gabriel Mountains in California. Credit: NASA/Michael Studinger

The IceBridge teams have enjoyed a few days of work here in warm and sunny California and we are now ready to fly to Punta Arenas in southern Chile, which will be the base of operation for our Antarctic flights. We are looking forward to another successful campaign with exciting new data and spectacular Antarctic scenery.

Back from Greenland, No Rest for the Weary

NASA and university partners returned from Greenland on May 28, concluding Operation IceBridge’s 2010 field campaign to survey Arctic ice sheets, glaciers and sea ice.

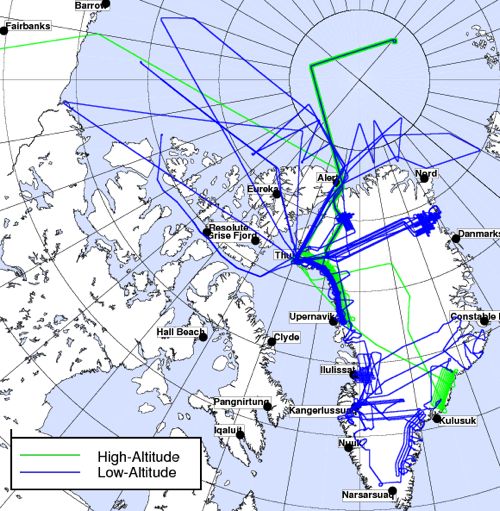
Over the span of almost 10 weeks, crew flew 28 science flights between the DC-8 and P-3 aircraft. Flight paths covered a total of 62,842 nautical miles, equivalent to about 2.5 trips around Earth at its equator. Credit: NASA

IceBridge — the largest airborne survey ever flown of Earth’s polar ice — has now completed two successive Arctic campaigns, adding a multitude of new information to the record from previous surveys.

Continue to follow the IceBridge blog and twitter feed to read updates as science results emerge. Also hear from scientists already planning the return to Antarctica this fall.

IceBridge project scientist Michael Studinger, recently back from the field, offered words of thanks to those who helped made the 2010 Arctic campaign a success.

“A project of this size with two aircraft and multiple deployment sites and a fairly complex instrument payload is only possible with the support of many people. I would like to thank everyone from NASA’s Dryden Aircraft Operations Facility, NASA’s Wallops Flight Facility and NASA’s Earth Science Project Office, who all provided excellent support for Operation IceBridge. We also had excellent support from the NASA instrument teams, the science teams from the universities, and many of our science colleagues, both, from the teams in the field and from people back home in the labs. IceBridge also would like to thank the many people in Kangerlussuag and at Thule Air Base in Greenland who provided excellent support while we were there. We could not have accomplished our goals without their terrific help.”

Michael Studinger (right) readies for a science flight from Kangerlussuaq, Greenland, during the Arctic 2010 IceBridge field campaign. Credit: NASA/Jim Yungel

Seeing Eastern Greenland for the First Time

From: Jason Reimuller, aerospace engineering student, University of Colorado, Boulder

My involvement with Operation IceBridge comes from a desire to better understand the polar climate and the climatic changes that are evident there. I have been working with NASA through the last five years as a system engineer for the Constellation project, while working to complete my doctoral dissertation in Aerospace Engineering Sciences at the University of Colorado in Boulder. I have also been recently involved with airborne remote sensing and LiDAR systems by completing a three year, NASA-funded research campaign that involved flying a small Mooney M20K aircraft to the Northwest Territories, Canada to better understand noctilucent clouds through synchronized observations with NASA’s Aeronomy of Ice in the Mesosphere (AIM) satellite.

This has been my first campaign with the project, participating in sorties based out of Kangerlussuaq, Greenland throughout the first two weeks of May 2010. To me, the project is a unique synthesis of personal interests — from polar climate observation and analysis, aircraft operations, remote sensing and instrument design, and flight research campaign planning. My role this year has been principally as a student with the intent to integrate the data that we collect with satellite and ground station data to better characterize glacial evolution, though I hope to become much more involved with the operations of future campaigns.

Seeing Eastern Greenland for the first time through the P-3’s windows, as its four engines lifting the aircraft easily over the sharp mountainous ridgelines and its strong airframe holding up to the constant moderate turbulence of the coastal winds being channeled through the fjords, was spectacular. I really got a strong sense of contrast between experiencing the stark minimalism of the ice cap and experiencing the aggressive terrain of the eastern fjordlands. The long flight trajectories we conducted there gave me a sense of the incredible diversity of the terrain and the low altitude of the flight plans gave me a connection to the environment not available at higher altitudes, even down to viewing the tracks of polar bears!

I have been very grateful to all the team members that have spent time with me to explain in detail the systems that they are responsible for, specifically the LiDAR systems, the photogrammetric systems, and the RADAR systems. Also, NASA pilot Shane Dover clearly explained to me the systems unique to the P-3 from a pilot perspective, which was of keen interest even though I may never log an hour in a P-3. In particular interest to me was the way John Sonntag was able to modulate complex flight plans onto ILS frequencies, providing the pilot a very logical, precise display to aid in navigating through both the numerous winding glaciers and the long swaths of satellite groundtrack. This has truly been an amazing personal experience, but upon hearing the excitement that many of the world’s top glaciologists have voiced about Operation IceBridge during my time in Kangerlussuaq, I’ve been proud to be a part of the team.

An Inland Connection?

From: Kathryn Hansen, NASA’s Earth Science News Team/Cryosphere Outreach Specialist

Scientists have long been tracking Greenland’s outlet glaciers, yet aspects of glacier dynamics remain a mystery. One school of thought was that glaciers react to local forces, such as the shape of the terrain below. Then, researchers noticed that glaciers in different regions were all thinning together, implying a connection beyond local influences. Scientists have posed theories about what that connection might be, but the jury is still out.
Recently, the landscape in southeast Greenland has started to change. Helheim Glacer, which was thinning at 20-40 meters per year, slowed dramatically to just 3 meters per year while thinning of the nearby Kangerdlugsuaq also slowed. Further south, two neighboring glaciers showed the opposite trend and started thickening by as much as 14 meters per year. Neighboring glaciers behaving in similar ways implies a connection, but what exactly?

The IceBridge flight on May 12 will help scientists learn how changes to outlet glaciers affect the ice sheet inland. Instruments on the P-3 surveyed in detail three southeast glaciers: Fridtjof-Nansen, Mogens North and Mogens South. Next they flew four long lines mapping changes near the ocean and up to 60 kilometers inland, capturing the extent, if any, at which thinning near coast reflects on changes to the ice inland. It’s an important connection to make; while the loss of outlet glaciers alone would not contribute much to sea level rise, loss of the ice sheet could have a dramatic impact.

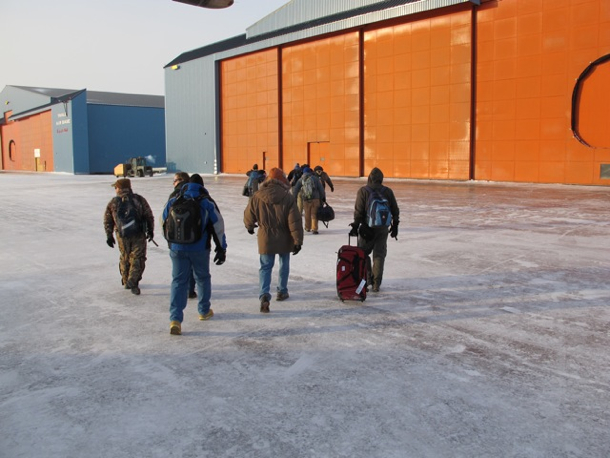
IceBridge crew and researchers board the P-3 on May 12 for a flight to study glaciers and the ice sheet in southeast Greenland. Credit: NASA/Kathryn Hansen


The P-3 flew over areas of sea ice wile mapping glaciers and the flight line closets to the coast. Credit: NASA/Kathryn Hansen

Mountainous terrain along Greenland’s southeast coast led to short-lived periods of turbulence and spectacular scenery. Credit: NASA/Kathryn Hansen

Isolation

From: Kathryn Hansen, NASA’s Earth Science News Team/Cryosphere Outreach Specialist

KANGERLUSSUAQ — There was a rumor that the flight on Friday, May 10, would be among the most scenic of the 2010 Arctic campaign. The high-priority flight along Greenland’s southeast coast required clear weather for pilots to maneuver along the sinuous glaciers at low altitudes. We were fortunate. The first opportunity to fly from Kangerlussuaq with the P-3 on this Arctic 2010 campaign turned up clear skies and relatively balmy temperatures, and we lifted off for Geikie Plateau shortly after 8 a.m.
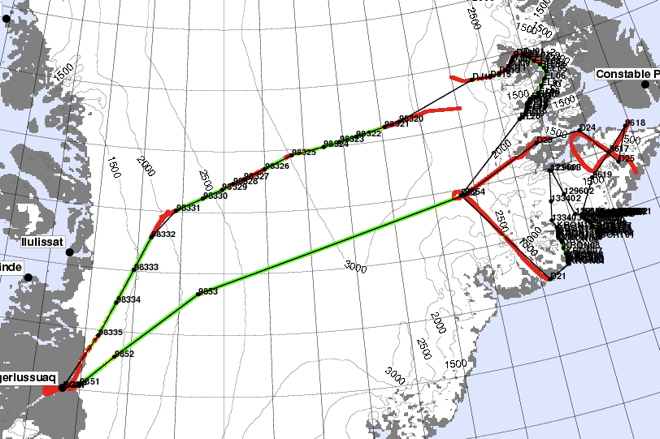
Why Geikie? The plateau is “dynamically isolated” from the rest of the ice sheet. That means what happens to the main ice sheet is not necessarily also happening to Geikie. So, IceBridge scientists want to collect Geikie’s vitals — ice thickness, surface elevation, bedrock profile — and compare them with the rest of the ice sheet. “They’re potentially doing very different things, which can tell you something about climate’s impact on the region,” said John Sonntag, Senior Scientist with the ATM laser instrument and IceBridge management team member.

The survey of Geikie Plateau called for about eight hours of total flight time. Credit: NASA/John Sonntag

Observing from one of the P-3’s few windows, I was struck by the scale of the landscape. As we closed in on the southeast coast, the flat barren ice sheet soon mingled with occasional hills and then steep mountains with sharp peaks. Ice appeared to be making its escape, flowing down valleys and merging with the glacial superhighway. Some glaciers terminated in cliffs half a mile high. For others, all that remained were the brown, silty remnants.

Ice works its way down between mountains before joining a larger glacier. Credit: NASA

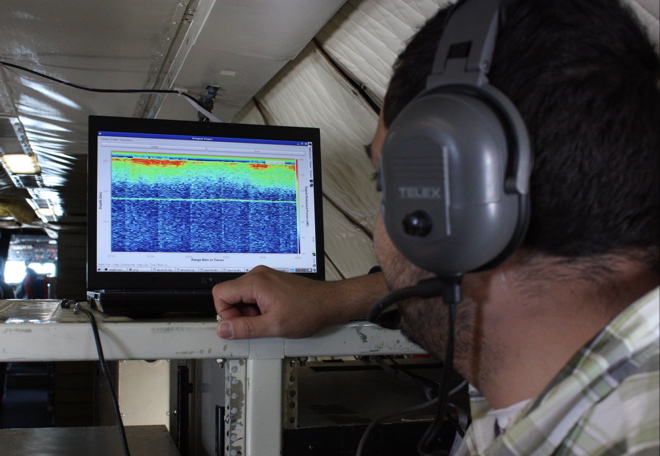
At the same time that I was making my visual inspection, however, IceBridge instruments were collecting a more scientific type of information. Lasers mapped the surface while radars dove down for a look below. Will scientists find that Geikie indeed acts in isolation? They’ll have a better idea after deciphering and analyzing the data. In the meantime, the IceBridge team is plotting to visit a few other isolated ice sheets throughout the mission — if time and weather permit.

The Multichannel Coherent Radar Depth Sounder instrument shows ice characteristics at depth and also the shape of the bedrock below (thin green line). Credit: NASA