IceBridge Field Work – A Project Manager's Perspective

By Christy Hansen, IceBridge Project Manager, NASA Goddard Space Flight Center

Field work in the Arctic is a unique and challenging experience. It takes an experienced and tough team to complete mission objectives from start to finish despite the biting cold, long days and noisy environment. Early morning temperatures are often in the negative single digits, and the IceBridge team powers through it preparing for flight each day. A typical day’s work can range 12 to 14 hours, a schedule that is repeated daily until the airport is closed or until the flight crew reaches a required hard down day.

My project management perspective allows me to take a step back and appreciate not only the technical expertise of our instrument and flight crew teams, but the masterful choreography that unwinds each day to ensure the P-3B aircraft is prepped and ready, the instruments are powered on and in working condition, and the weather and corresponding science flight plan has been assessed and defined. Being actively involved in all phases of Operation IceBridge makes for a stronger and well-versed leader better able to assist any part of the team at any time. By doing this, I can ensure we are on track to meet our mission and science requirements, assist with troubleshooting in and out of the field, better manage project milestones, and ensure streamlined communication across all IceBridge disciplines with a common goal.

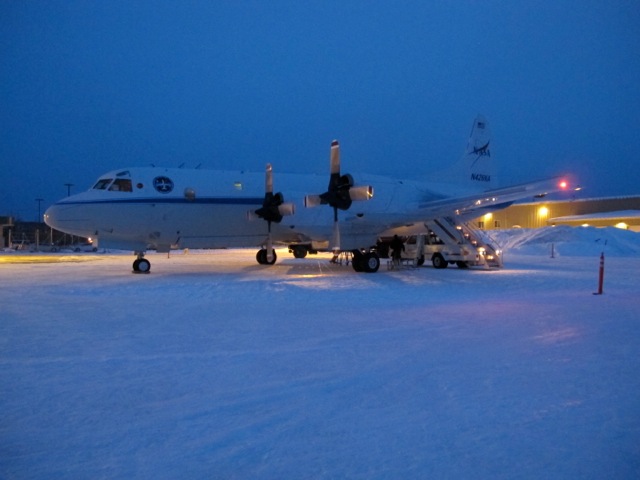
IceBridge project manager Christy Hansen on the stairway to NASA's P-3B.
IceBridge project manager Christy Hansen on the stairway to NASA’s P-3B. Credit: NASA / Christy Hansen
But why do we do this? How do we do this? 

We do all of this in the name of science, collecting polar geophysical data that will help characterize the health of the Arctic and Antarctic. The in-field data and derived data products IceBridge produces are helping to show annual changes in the ice. These data can be entered into models that can more accurately predict what might happen in the future in terms of ice sheet, glacier, and sea ice dynamics, and ultimately sea level rise; all of which have serious consequences for climate change.

But how do we reach these science goals? The steps and teamwork required are simply astounding. Each part of our team is like a puzzle piece and everyone is needed to complete the puzzle. All teams must clearly know their individual responsibilities, but also be able to work together and mesh where their job ends and another begins.

The choreography starts in the beginning, or planning phase where the science team establishes targets of interest on the ice in accordance with our level 1 science requirements. Then our flight planner designs survey flights, having a unique ability to efficiently mesh the science targets with the range and flight dynamic capabilities of the P-3B aircraft.

Next the aircraft office at NASA’s Wallop’s Flight Facility prepares the P-3B for deployment to some of the harshest environments on Earth and supplies the flight crew that executes the specific flight paths over our required science targets. The instrument teams provide the instrumentation—laser altimeters, radars, cameras and a gravimeter and magnetometer—and expertise in operating equipment and processing data during and after flights. Our logistics team deploys to the field ahead of time, establishing security clearances, local transportation and accommodations, and internet and airport utilities.

Finally, our data center ingests and stores the data that our team collects, ensuring it’s useable and available to the wider community. Our data is not only used by polar scientists and other researchers around the world, it is also used to help satellite missions like the European Space Agency’s CryoSat-2 and NASA’s ICESat-2 calibrate and validate satellite instrumentation.

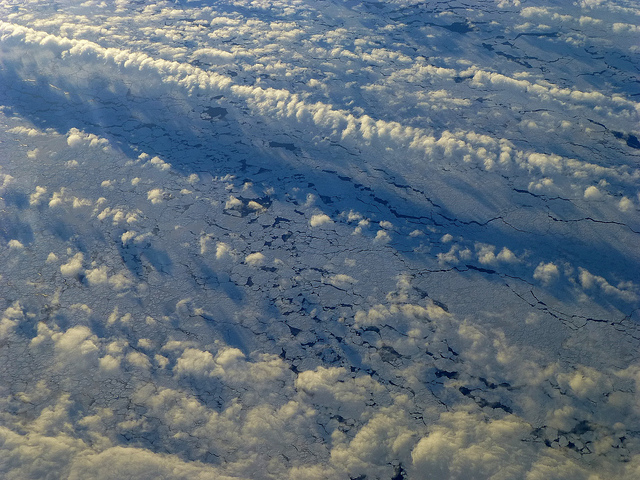
A view of ice from NASA's P-3B airborne laboratory.

A view of ice from NASA’s P-3B airborne laboratory. Credit: NASA / Christy Hansen

And finally, a day in the field …

Assuming a standard 8 a.m. local takeoff and eight hour mission duration, we generally have three major groups who follow different schedules pre-flight each morning.

The P-3 maintenance and flight engineer crew typically starts the earliest, heading to the airport about three hours before takeoff. They prep and warm up the plane, conduct some tests and fuel it, all in preparation for the instrument team arrivals and flight operations.

In parallel with aircraft prep, IceBridge’s project scientist, project manager and flight planner team head to the weather office. The team works with local meteorologists, reviewing satellite imagery and weather models to determine the optimal weather patterns that support our flight requirements—clear below 1500 feet, the altitude we typically fly—and final target selection.

In the meantime, the instrument teams arrive at the aircraft to power up and check their systems prior to takeoff. By 7:30 a.m., the aircraft doors close, and we take off by 8. Our eight-hour flights range between flying high and fast, to low and slow over our targets, which include geophysical scans of ice sheets, glaciers, and sea ice.

We typically land around 4 p.m., close out the plane, check data and meet at 5:30 for a science meeting. Many folks continue to work for a few hours afterward, processing data or writing mission reports. All of this is repeated daily, for up to 6 days in a row, which can be exhausting, but in the name of important scientific research, an amazing team, and majestic polar landscapes, I could not imagine anything else.


Crew members working on the P-3B. Credit: NASA / Christy Hansen

Crossing the Basin: IceBridge in Alaska

By George Hale, IceBridge Science Outreach Coordinator, NASA Goddard Space Flight Center

Why does IceBridge fly all the way to Alaska when the rest of the campaign is in Greenland? It’s an understandable question considering how far away these two locations are. But when you consider the economic importance of the regions north of Alaska and how dynamic and varying sea ice in the Arctic is, the picture becomes clearer. Much like last year, the IceBridge team made the 8 hour transit flight from Thule to Fairbanks early in the campaign.

Flight path from Thule to Fairbanks.
Flight path taken from Thule, Greenland, to Fairbanks, Alaska on Mar. 21, 2013. This route and the more southerly return leg have been flown in every IceBridge Arctic campaign. The flightplan was renamed this year as a tribute to sea ice scientist Seymour Laxon. Credit: NASA

Ice on the Move

At first glance it might be easy to assume that Arctic sea ice is uniform, but the region’s geography, ocean and wind currents and the ever-changing nature of ice itself mean that conditions can vary significantly across the Arctic Basin. “There are lots of different thickness gradients across the basin,” said Jackie Richter-Menge, sea ice scientist with the U.S. Army Corps of Engineers and co-lead of the IceBridge science team.

Ocean currents like the Beaufort Gyre continuously spin in the Arctic Ocean, driving ice cover along the coast of North America toward Greenland where it is compressed into thicker multi-year ice. The presence of multi-year ice is one of the biggest differences between the ice cover off the coast of Greenland and in the region of the Arctic Basin north of Alaska, which is recently dominated by ice that forms in the winter and disappears in the summer.

DMS mosaic of ice in the Beaufort Sea.
Digital Mapping System (DMS) image mosaic of ice in the Beaufort Sea. The lighter colored portion at the bottom right is thick sea ice, the darker blue-gray areas are thinner ice and the dark segment in the middle is open water. Credit: NASA / DMS

This seasonal ice cover is becoming more prevalent in areas north of Alaska as the thicker multi-year ice gradually melts. On the Mar. 22 IceBridge flight Richter-Menge saw firsthand how things have changed since she flew over the region earlier in her career in the 1980s. “It was notable how deep we went in the basin without seeing multi-year ice,” Richter-Menge said. IceBridge didn’t see multi-year ice until they were about 1000 kilometers from shore. In the early 1980s it could be found between 150 and 200 kilometers out.

Getting Better Data

These sorts of changes, along with environmental and economic concerns, contributed to the science communities increased desire for data on sea ice this part of the Arctic Basin. IceBridge had conducted transits of the entire basin from Thule to Fairbanks in previous campaigns, but starting in 2012, the mission started doing a temporary deployment in Fairbanks to get more data on areas north of Alaska.

IceBridge’s increased coverage is adding to the body of knowledge on ice in this region adding a new level of detail. “It gives us a more complete view of what’s going on in the basin,” said Richter-Menge. The data collected on these flights give more geographic coverage to IceBridge’s sea ice data products, especially the quick look product that debuted during last year’s Arctic campaign. This dataset came about in response to a need for near real-time sea ice conditions for use in seasonal sea ice forecasts.

Graph of Arctic sea ice volume from the Pan-Arctic Ice Ocean Modeling and Assimilation System (PIOMAS)
Graph of Arctic sea ice volume from the Pan-Arctic Ice Ocean Modeling and Assimilation System (PIOMAS). Credit: Polar Science Center / University of Washington

Along with data on sea ice freeboard, the amount of ice floating above the ocean’s surface, many in the scientific community have taken an interest in IceBridge’s snow depth measurements. Snow depth gives a way to measure changes in precipitation rate and differences in accumulation affect how much snow is available for melt ponds. As conditions warm in the summer, snow melts and accumulates in ponds. These ponds are darker than the surrounding snow, trapping more of the sun’s heat and further accelerating melting.

Richter-Menge (left) and the IceBridge team before a flight over the Beaufort Sea on Mar. 22, 2013.
Jackie Richter-Menge (left) and the IceBridge team before a flight over the Beaufort Sea on Mar. 22, 2013. Credit: NASA / Jim Yungel

Learning and Teaching

As a guest on the flights out of Fairbanks Richter-Menge got a chance to see firsthand how IceBridge collects sea ice data. Being able to witness this complicated and involved process helps give a better-rounded picture of the mission, Richter-Menge said. In addition to the data-collection that takes up each flight, Richter-Menge got to see the work it takes to choose which mission to fly each morning. “It was impressive to watch the whole decision-making process for choosing flight lines,” said Richter-Menge.

And as is often the case, the flow of information goes both ways. Richter-Menge and fellow sea ice scientist Sinead Farrell spent plenty of time on their flights sitting at a window aboard the P-3 and explaining what everyone was seeing. “We are learning a lot about sea ice with them here,” said Christy Hansen, IceBridge’s project manager.

NASA Operation IceBridge: Notes from the Field (Arctic 2013)

By Sinead Farrell, Sea Ice Scientist, NASA Goddard Space Flight Center / University of Maryland

Editor’s note: This entry was originally posted on the Scientist’s Soapbox, a blog published by the Earth Science System Interdisciplinary Center at the University of Maryland in College Park, Md. 

Introduction:

The NASA Operation IceBridge mission began the Arctic 2013 research campaign on Monday 20th March. The mission will survey the Greenland Ice Sheet and sea ice pack of the Arctic Ocean. The NASA IceBridge mission is now in its fifth year and continues to measure Arctic sea ice thickness and snow depth. These data continue the time series of ice thickness measurements begun with NASA’s ICESat in 2003, and will provide a link to the NASA ICESat-2 mission, due for launch in mid-2016.

Surveys are conducted using a specially-equipped P-3B research aircraft (see photo below) that flies above the ice carrying a number of science instruments including radar and laser altimeters, and high-resolution cameras. This year the first flight took place from Thule, Greenland over Arctic sea ice north of the Lincoln Sea, on Wednesday 20th March. IceBridge flew beneath the European Space Agency’s CryoSat-2 satellite, that carries a special radar altimeter known as SIRAL. The mission was designed to fly a gridded-survey beneath the satellite to help validate CryoSat’s measurements over sea ice. The aircraft then transited from Thule across the Arctic Ocean to Alaska on Thursday 21st March. Over the coming days IceBridge will attempt a number of sea ice flights over the Beaufort and Chukchi Seas from a base at Fairbanks International Airport, Alaska. ESSIC’s Sinead Farrell hopes to participate in the first Alaska mission on Friday 22nd March, pending good weather. Dr. Farrell is a sea ice scientist and member of the NASA IceBridge science team.

View of a sea ice lead from the NASA P-3B.
View of a sea ice lead from the NASA P-3B. Credit: NASA / Christy Hansen

Daily Blog Posts:

Tuesday 19th March: Arrived in Fairbanks, Alaska on Tuesday to slightly warmer spring temperatures than I had expected. After organizing a rental car, figuring out how to use the engine heating block and the all-wheel drive, I headed for the hotel to unpack and (re)familiarize myself with the locale. The last time I enjoyed an extended visit to Fairbanks was exactly ten years ago, while I was conducting my graduate studies at University College London. Back then I also participated in a NASA airborne campaign over the Chukchi, Beaufort and Bering Seas aimed at validating the NASA AMSR-E radiometer. Things have not changed much in Fairbanks over the years!

Wednesday 20th March: The first in a series of IceBridge science flights was successfully completed on Wednesday. Although the mission was conducted far away over Arctic sea ice northwest of Greenland it was nonetheless a very exciting mission to follow. I was involved in designing a set of gridded flight-lines over the ice such that our airborne survey would provide temporally and spatially coincident measurements with CryoSat-2, while it passed high over-head. This is a technically challenging flight to conduct but things worked out well. The sea ice appeared more dynamic than we had expected, but the number of cracks in the ice, known as “leads”, will actually help in the data analysis aimed at inferring sea ice thickness. While waiting for the IceBridge mission to transit from Greenland to Alaska, I will spend time visiting the International Arctic Research Center (IARC), at the University of Alaska – Fairbanks (UAF). On Wednesday I had the opportunity to meet with some of my colleagues at IARC to discuss on-going and future projects to better understand the diminishing Arctic sea ice pack. I was also able to attend a lecture by Dr. Ron Kwok of NASA’s Jet Propulsion Laboratory on the topic of “Recent Changes in the Arctic Sea Ice Cover: A remote sensing perspective”. Fortuitously there are many national and international sea ice scientists visiting UAF right now to participate in meetings and workshops. Some are even en route to conduct field-work on the sea ice near Barrow, Alaska. Although it’s very cold (-19 degrees Celsius this morning!) and snowing, this is a great time of the year to be in Fairbanks!

Thursday 21st March: Thursday began with the exciting news that the NASA P-3 was en route to Fairbanks. Today’s mission from Greenland to Alaska was flown along what is called the “Laxon Line”. The flight is named in honor of University College London Professor Seymour Laxon. Seymour, my graduate advisor, died tragically 3 months ago. Seymour was a pioneer in the use of satellite altimeters to study sea ice and was the lead sea ice scientist on the CryoSat-2 mission. Today we measured ice thickness and snow depth along a flight line that crosses most of the Arctic Ocean. Thanks to a good tail-wind the P-3 landed one hour early in Fairbanks, right around lunch time. I was really lucky to watch the plane land with my colleagues Jackie Richter-Menge from the Cold Regions Research and Engineering Laboratory (CRREL) and Pam Posey from the Naval Research Laboratory (NRL). Once through customs we met our colleagues off the plane and welcomed them to snowy Alaska!

Friday 22nd March: On Friday we hope to conduct a third sea ice mission over the Arctic, weather permitting. We always need good weather to fly our surveys since clouds can potentially interrupt the measurements we make from the aircraft. We’re particularly interested to see what is happening to the sea ice in the Southern Beaufort Sea this year after the ice pack suffered a wide-spread “break out” event in mid-February. This event caused the ice pack to fragment into smaller floes and become more dynamic. Although these break-out events are not unusual in this region, they do not normally happen in February, the dead of winter. We will provide more updates as the day progresses.

The NASA P-3B on the ramp at Fairbanks, Alaska.
The NASA P-3B on the ramp at Fairbanks, Alaska. Credit: NASA / Jim Yungel

Operation IceBridge Featured in EOS

By George Hale, IceBridge Science Outreach Coordinator, NASA Goddard Space Flight Center

The new quick look sea ice data product released by NASA’s Operation IceBridge was the subject of a cover story in the Jan. 22 issue of the American Geophysical Union publication EOS. The article discusses the sea ice data product created by IceBridge scientists during the 2012 Arctic campaign last April and how these datasets provide new ways for researchers to measure Arctic sea ice.

Maps of survey of Arctic sea ice

Map showing quick look sea ice data from Arctic 2012 campaign


EOS article:

http://onlinelibrary.wiley.com/doi/10.1002/2013EO040001/abstract

For more about IceBridge’s quick-look sea ice product and its use in seasonal forecasts, visit:

https://www.nasa.gov/mission_pages/icebridge/news/spr12/arctic-seaice.html

https://www.nasa.gov/topics/earth/features/seaice-forecasting.html

A Balance Between Two Extremes

By Nathan Kurtz, IceBridge scientist, NASA Goddard Space Flight Center/Morgan State Univ. 

Something quite unexpected happened to me during this IceBridge campaign. In fact, something was missing: much of the sense of awe and wonder which I had on my previous three missions was gone. Once there was excitement to see new and inspiring sights, but now there was routine and a sense that I had seen this all before. Despite spectacular views of the polar landscape outside the window of the DC-8 aircraft, I was more often concerned with analyzing data from past IceBridge campaigns than taking time out to look outside.

Bothered by my inability to be moved by my chosen subject of study I forced myself to stare out the aircraft window in hopes that renewed interest would strike. As the silent scenes of the ice scrolled by below me a quote by horror writer H.P. Lovecraft kept running through my head like the background score of a movie: “The oldest and strongest emotion of mankind is fear, and the oldest and strongest kind of fear is fear of the unknown.” After a long bout of reflection I finally realized what the connection was: my sense of awe and wonder wasn’t actually missing, it had simply been hidden away. Only by finding this missing aspect again could I finally experience the renewed interest I was looking for and incorporate this into a deeper respect for the significance of my role as a scientist in the IceBridge mission.

Low-lying clouds over sea ice on the Bellingshausen Sea.
Low-lying clouds over sea ice on the Bellingshausen Sea. Credit: NASA / Maria-Jose Vinas

Wrapped in the relative safety of the airplane and content with my knowledge of the physical processes which formed the massive ice sheets around me I had only a vague feeling of missing something. This missing aspect was fear. My familiarity with everything around me caused me to be complacent and lose a healthy sense of fear for the world outside my window. I had become the consummate scientist who fashions the world into nothing more than a series of numbers, equations, and rules. Once the unknown was made known my sense of fear was gone as everything seemed to be explainable according to well-described laws. Such is the dilemma of the scientist: one may be criticized as being arrogant for making sweeping claims of knowledge of unbelievably complex phenomenon, yet possessing a high confidence is also necessary to know that it is indeed possible and correct to make such claims with sufficient data.

This is in stark contrast to my previous experiences flying with the IceBridge mission. In my first flight over the Antarctic sea ice two years ago I felt an indescribable rush of fear and excitement as a vast and remote new world opened up before my eyes. I had never seen anything like it before and felt terrified viewing the harshness of the region. I knew that I’d have little chance to survive if I left the safety of the airplane. I also felt that all of the scientific facts I had read about the polar regions had done little to capture the complexity of everything around me. That I had much to learn before I could properly do my job as a scientist and make broad claims about the state of the polar regions based on the data we were collecting.

Somewhere between these two extremes of fear lies a balance that needs to be attained. Some fear is healthy, it allows one to have humility and respect for forces of nature which are beyond the powers of people to control, but that it is also possible to understand these forces in order to live in harmony with them. Too much fear is unhealthy and can lead to a paralysis of thought and action and distortion of the truth to protect one from an uncomfortable reality. These two extremes of fear seem to define an ongoing conflict between science and society, particularly with regards to the polar regions. In recognizing this, it also gives the potential for scientists to form a bridge between these two conflicting groups.

Sunlight reflecting off refrozen leads in sea ice in the Bellingshausen Sea.
Sunlight reflecting off refrozen leads in sea ice in the Bellingshausen Sea. Credit: NASA / Jefferson Beck

In my experience, most people see the polar regions in a generally negative light, one that is based on fear. Nowhere is this more prevalent than in the arts which are a good barometer (and influential aspect) of the prevailing view of society. Classic writers such as Lovecraft and Edgar Allan Poe wrote stories about the polar regions and portrayed them as places filled with supernatural terrors. This attitude can be seen in contemporary literature as well. For example, popular author George R.R. Martin uses a cold region beyond a great wall of ice as a place where unseen evils lie in wait to tear down a society excessively focused on politics and power games. The artist Edwin Landseer, mostly known for his pleasing pictures of animals, chose to use the polar regions as the backdrop for his controversial painting ‘Man Proposes, God Disposes’ which gruesomely depicts the end of an ill-fated polar expedition. A plethora of horror movies such as The Thing and 30 Days of Night use the polar regions as a setting for tales of terror. These are but a few examples of the negative fear-based depiction of the polar regions in our culture. But is the prevailing view of the polar regions only this and nothing more, a bleak place for us to project our fears?

Aside from only one happy movie (Happy Feet), I can think of positive portrayals of the polar regions mainly in science texts and documentaries. Science is providing (to paraphrase Carl Sagan) a candle in the dark to make a feared unknown into something known. One of these feared aspects is the big question of what changes are happening in the polar regions and to what extent are these changes influencing the global climate. From my own studies of sea ice I have seen large decreases in both the extent and thickness of Arctic sea ice, while the Antarctic sea ice cover has shown a small increase in extent over the last three decades and no statistically significant trends in thickness. Models show that the Antarctic sea ice extent may counter-intuitively increase over the next few decades under a warming climate, but if the warming continues it will begin to decrease again. A decrease in the global coverage of sea ice is expected to cause changes to the global deep ocean circulation as well as increase the amount of absorbed solar radiation which will lead to increased global temperatures. These are simple facts obtained from scientific observations and model physics. Facts such as these are not scary, and if utilized properly they should serve as vital sources of information. Not to paralyze our thoughts in fear, or to give a false illusion of control. But if used with a sense of humility they can be used to promote and guide positive and constructive action.

This is where the IceBridge mission can play a role, and something I realize this trip has inspired me to work towards. Confronting the unknown through exploration and gathering of scientific facts. Presenting the facts as accurately possible is the only way to make the unknown known and unite the world of science with the human element. That is, to allow scientific knowledge to be used as a tool to improve the lives of people. Having spent several weeks with the unique and interesting people that make up the IceBridge mission I am sure that we can do things to the best of our ability. To shine some truth and light on the unknown and work towards getting rid of a climate of fear.

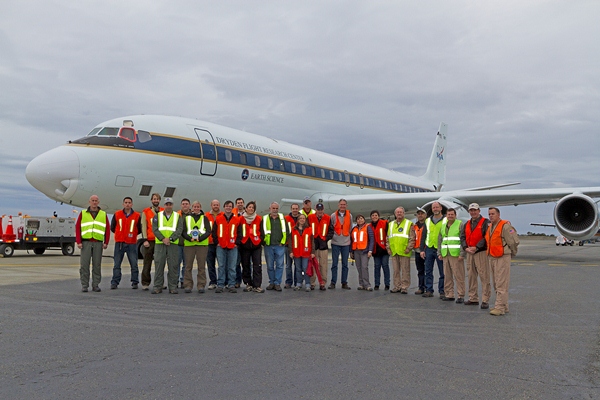
Group photo of IceBridge team in front of the NASA DC-8.
Group photo of IceBridge team in front of the NASA DC-8. Credit: NASA

Seeing Data Collection Firsthand

By Donghui Yi, Remote Sensing Scientist, NASA Goddard Space Flight Center

Punta Arenas, Chile is a city with friendly people, rich history, beautiful beach, and spectacular lenticular clouds. Participating in IceBridge’s 2012 Antarctic campaign based at the Punta Arenas airport was an amazing experience for me. I study Airborne Topographic Mapper (ATM) laser waveforms and different tracking algorithms and their influence on elevation measurements. Participating in IceBridge flights let me see ATM instrument setup and operation firsthand.

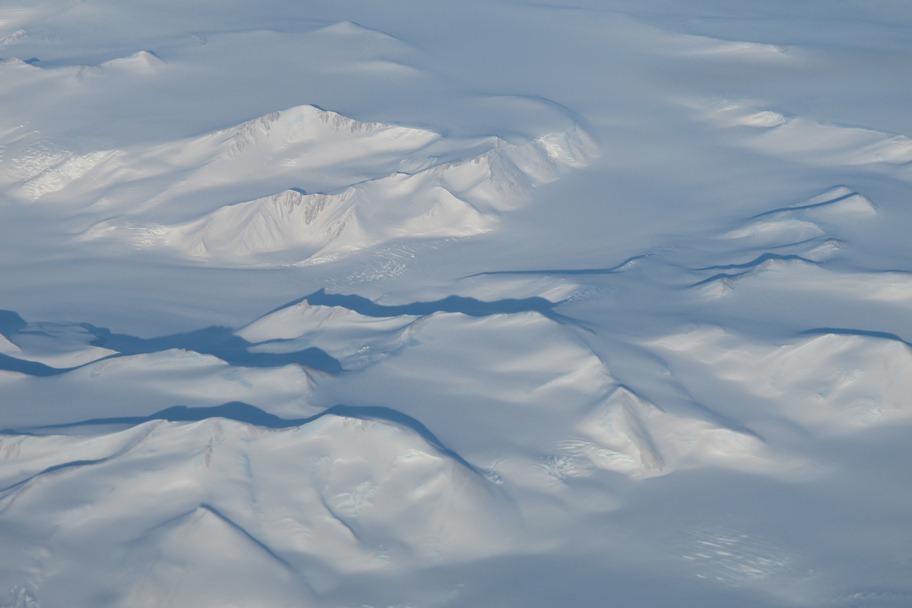
The flights I was on covered the Antarctic Peninsula, Bellingshausen and Amundsen seas, West Antarctic ice sheet, Weddell Sea, Ronne and Filchner ice shelves and a portion of the East Antarctic ice sheet. The highest latitude we reached was over 86 degrees south. From NASA’s DC-8 aircraft, the beauty of Antarctica’s sea ice, coast, mountains and ice sheets is breathtaking. From a typical survey height of 500 meters above surface, you see an Antarctic you cannot see from surface or from a satellite image. It makes the over 11-hour flight an exciting and enjoyable journey each time.

Antarctic mountains seen from the DC-8
Antarctic mountains seen from the DC-8. Credit: NASA / Donghui Yi

It was also amazing to see the spatial and temporal variability of the clouds over Antarctica, which can go from the surface to several kilometers high and can be continuous or have numerous layers. Even between the surface and a typical survey altitude of 500 meters, there can be so many layers in between, low and high. The IceBridge team and airport meteorologists did an unbelievable job predicting where clear sky regions would be, a critical part for the missions’ success. Without this critical information, the management team would not be able to make the right decisions to determine survey passes.

The flight crew and instrument engineers are wonderful people to work with and their skills and dedication to the project command our utmost respect. The firsthand experience of sea ice and ice sheet data collection is invaluable to my research. This trip itself was a bridge between a scientist and engineers.

Port of Inquiry: IceBridge visits the Nathaniel B. Palmer

By George Hale, IceBridge Science Outreach Coordinator, NASA Goddard Space Flight Center

With its proximity to the Antarctic Peninsula, Punta Arenas, Chile, a city on the Strait of Magellan in southern South America, is a popular destination for scientists on their way to Antarctica. Not onlydoes NASA’s Operation IceBridge use the Punta Arenas airport as a home baseduring its Antarctic campaign in October and November, the city is also a base of operations for a variety of Antarctic science missions. During this year’s Antarctic campaign, the IceBridge team got to take a close up look at the United States Antarctic Program’sicebreaker Nathaniel B. Palmer, which calls Punta Arenas home.

On Oct. 24, Jamee Johnson and Chris Linden of the United StatesAntarctic Program led a group of IceBridge personnel on a guided tour of thePalmer. The research vessel is waiting in the port of Punta Arenas until lateDecember or early January, when it will carry scientists and their equipment toMcMurdo Station in Antarctica, conducting experiments along the way. Once there, passengers willoffload and a new group of people and gear will board the icebreaker for a returntrip to Punta Arenas.

IceBridge personnel standing outside the Nathaniel B. Palmer
IceBridge personnel on the dock in Punta Arenas in front of the Nathaniel B. Palmer. Credit: NASA / Christy Hanse nand USAP / Jamee Johnson

The Palmer is a 6,500 ton icebreaking research vessel thattravels to and from bases in Antarctica like United States’ McMurdo Station.The vessel sails from one of its home ports, like Punta Arenas, carrying scientists who do research along the way. During thetour, IceBridge personnel got to see some of the ship’s five labs, the galley,the infirmary and the ship’s bridge, where they met Sebastian Paoni, captain of the Palmer since2007.

Captain Sebastian Paoni talks to IceBridge people on the bridge
Palmer Captain Sebastian Paoni (right) meets visitors on the bridge. Credit: NASA / George Hale

In many ways, thePalmer is similar to other large, ocean-going research ships. There are placesfor crew and passengers to sleep, eat, relax, exercise and socialize. Withtrips to sea lasting several weeks at a time, ships like the Palmer need to beself-contained floating cities, carrying enough food, water, spare parts andother supplies needed to keep the crew and passengers safe and happy.

The big difference between the Palmer and other research vessels is that it has a reinforced hull designed to let it break through ice, opening a passage to travel through. There are limits to how thick of ice the ship can break through, so planning the ship’s route often requires satellite imagery and other data that can show where thinner ice is. Sailing through ice is a slow and often noisy process, but when your path is blocked by sea ice, slow and noisy beats not atall.

Science By Air and Sea

The Palmer and IceBridge’s aircraft both gather geophysical data, and despite the different nature of these platforms the instruments have some similarities. In the labs, Linden, a senior systems analystaboard the Palmer, showed IceBridge team members several different instruments, such as including a gravimeter and a sonar system used to map the ocean floor. Thesonar uses a technique to create swaths of data that resemble theswaths of elevation data produced by IceBridge’s Airborne Topographic Mapperinstrument. 

Probably the biggest similarities are dealing with motion and the changing array of instruments used. Scientists need to counteract motion from either a rolling ship or vibrating airplane, which is handled in both cases by referencing the instruments with data from GPS and inertial guidance systems. Also, much like on NASA’s aircraft, the instruments on the Palmer change depending on what is being studied. Changing the configuration of the ship’s equipment is something Johnson said is one of the most interesting parts of the job.

In return for graciously taking visitors on a tour of the ship, IceBridge invited some Palmer personnel to come along on a survey flight. People working on icebreakers rely on information about sea ice to plan their routes and although IceBridge data isn’t directly used, flying along will give them a chance to see how the mission measures ice from the air.

Palmer visitors stand on the helipad on the Palmer's stern
Palmer visitors stand on the helipad on the Palmer’s stern. Credit: NASA / Christy Hansen and USAP / Jamee Johnson
For more information about the Nathaniel B. Palmer, visit: http://www.usap.gov/usapgov/vesselScienceAndOperations/index.cfm?m=4

Witnessing the last P-3 Arctic sea ice flight for 2012

By George Hale, IceBridge Science Outreach Coordinator, NASA Goddard Space Flight Center

The transfer of IceBridge’s base of operations from Thule to Kangerlussuaq normally marks the end of sea ice surveys done by the P-3 for the campaign. At this time, scientists on the P-3 change their focus toward ice sheets and glaciers, while researchers aboard the Falcon jet using Land, Vegetation and Ice Sensor (LVIS) will continue studying sea ice. But with starting the campaign with a transit to Alaska and beginning operations in Kangerlussuaq by crunching data on the ground while the P-3 is in Wallops being repaired, this year has been anything but ordinary. I’ve been asked to give my views as a newcomer to IceBridge and first-time visitor to the Arctic and I’m happy to share.

First, I have to state that while I have a basic background and interest in science, I’m not a scientist by training. My role as a communicator is not to make scientific discoveries, but to spread the word about them. Part of my job as IceBridge’s science outreach coordinator is to help bridge the gap between what scientists find and what the public understands.

Being outside of the science of sea ice gives me a different perspective on things. I’ve been keeping up with news from the Arctic campaign, but it wasn’t until actually riding along on a sea ice flight that I felt I knew what was happening. Being with scientists as they gather data and sharing the flight experience with them will hopefully help me improve IceBridge’s educational and public outreach efforts.

New to the Program

I arrived in Kangerlussuaq on April 9, the same day as the P-3 returned from Wallops. While flying from Thule the week before, the P-3 started having issues with one of its engines, something unavoidable with the workload and conditions the P-3 is subjected to. In the interest of safety, the pilots shut the engine down and flew directly into Kangerlussuaq. After a one-day delay because of weather, the P-3 made its way back to the Wallops Flight Facility in Virginia for an engine replacement.

The P-3’s return flight to Greenland coincided with my scheduled arrival there, so I was extended an invitation to ride along. Unfortunately, this didn’t work with the arrangements for my commercial return flight, so I wasn’t able to go. I arrived in Kangerlussuaq on an Air Greenland flight Monday morning with enough time to unpack, check my email and buy some groceries before joining others at the airport to see the P-3 arrive.

Bright and early Tuesday morning, I joined 23 other people in braving the 12 degree Fahrenheit weather to board the P-3 for one last sea ice flight along the east coast of Greenland that would put us on an intersecting path with the NASA ER-2 carrying MABEL. At this point in the campaign, IceBridge normally flies glacier surveys, but weather conditions made that unfeasible.


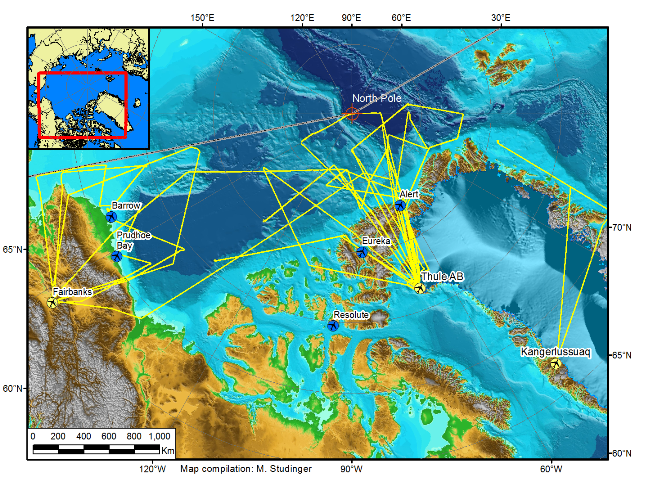
A map of the 2012 Arctic campaign’s sea ice flight. Credit: Michael Studinger/NASA

Sea Ice in Review

This flight was another in a long line of successful sea ice surveys and joint operations with other aircraft. IceBridge has flown 15 sea ice flights, including several along CryoSat orbits and two joint flights with aircraft from the European Space Agency as part of CryoVEx, their CryoSat validation campaign.

Aside from the highly successful joint ESA/NASA flights, this year’s Arctic campaign stands out as completing several more sea ice flights than previous years, covering a distance greater than the circumference of the Earth around the equator. In total, IceBridge has collected huge amounts of sea ice data from instruments like ATM, DMS and the new KT-19 temperature sensor used for sea ice lead detection.

And this data is just sitting around waiting to be processed. This year IceBridge scientists are working to build a quick sea ice product from information that’s only days old. If this proves successful, it has the potential to improve sea ice forecasts and statements for the general public. IceBridge scientist Nathan Kurtz talks about his work with sea ice and the quick sea ice product in his earlier blog post.

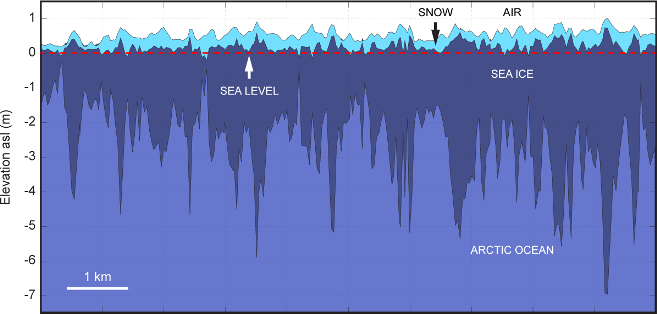
A diagram showing sea ice thickness

A diagram showing sea ice thickness and the role snow cover plays

Having successes like these early on sets the bar for the rest of the campaign, and after hearing about IceBridge’s success for several weeks, I now get the chance to witness it first-hand.

My First Sea Ice Flight

I’ve been hearing about IceBridge’s campaign successes since operations began in March. Knowing I would join the team in April and get to see these successes first-hand was very exciting. Being there as things happen promises to be a great experience, and I can only hope to avoid getting in the way. On the morning of my first survey flight, I strap into my seat. I’m not entirely sure what to expect, but I’m ready to see IceBridge at work.

I am in some ways grateful that my first flight was over sea ice. Although it may have been a letdown for those who have flown many sea ice flights this year already, I was glad to have a relatively gentle introduction. Compared to glacier surveys, sea ice flights are smooth and easy, with no crosswinds coming out of fjords and far less turbulence.

As I walked around the cabin I saw members of the IceBridge team working diligently, recording data and making necessary adjustments to their instruments. I also looked out the P-3’s side windows to watch sea ice as we passed 1,500 feet overhead. The flight wasn’t all straight and level though. The pilots put the P-3 through a series of pitching and rolling maneuvers at higher altitude for instrument calibration. The up and down parabolic arcs and resulting feeling of lessened gravity seem to be a favorite, bringing smiles to the faces of both novices such as myself and IceBridge veterans.

A Cold Ride Home

Several hours later we returned to the airport, with the bulk of the team ready to get off the plane and warm up. During the return leg a mechanical issue caused the plane’s climate control to start blowing cold air instead of warm. By the end of the flight, it was around 40 degrees Fahrenheit in the back of the cabin and some bottles of water sitting on the deck were starting to form ice on the bottom.

After landing we take a short break (to warm up) and then head off to the daily science meeting, where we discuss the day’s events and look at weather forecasts to make plans for tomorrow’s flight. The plan is to survey some of the eastern glaciers, which means a more turbulent flight for my second day on the P-3. I’m looking forward to riding along on as many flights as I can in the following days, and to working with the American, Danish and Greenlandic teachers arriving soon to participate in IceBridge.

Synchronized NASA and ESA flights across Arctic Ocean — a success!

By Malcolm Davidson/ESA and Michael Studinger/NASA


Arctic sea-ice from the NASA P-3

Arctic sea-ice from the NASA P-3 (NASA/M. Studinger)

Monday April 2 has been much anticipated bythe teams in Thule, Greenland (NASA) and Alert, Canada (ESA). While the objectivesfor the day were clear – jointly fly with all available planes beneath CryoSat’searly morning pass over the Arctic Ocean – the execution of such flights is andalways will be a challenge. 

Flying joint multi-plane missions is arather daunting task. Departure and rendezvous times and locations need to becalculated and maintained to ensure that the instruments on the differentplanes will see the same sea-ice floes below (these move after all), flightaltitudes need to be established and maintained for safety reasons, instrumentsneed to be warmed up and ready ‘in-time’, somewhat grumpy firefighters need tobe coaxed out to the airstrip ahead of working hours to support an earlydeparture and the list goes on.

With both teams committed to the flights,the first task early this morning was to check the weather forecast for theday. These proved to be good with temperatures of –29°C (–20°F) and generally clear skies; but not ideal! Some rather worryingcloud formations featured near the coast in satellite images.

NASA P-3 cockpit

NASA P-3 cockpit (NASA/M. Studinger)

Nevertheless, after a quick phone callbetween the NASA and ESA coordinators (at a time before most people have yet toreach for their mug of morning coffee) the decision was made: it’s a go.

From then on it there was a flurry ofactivity on both sides, pilots warmed up their planes, instrument teams checkedout their instruments, flight plans were programmed into the onboard computersand so on.

Twin Otter takes off

Twin Otter takes off

The NASA P-3 plane was the first to go out, leaving Thule a full hour before the two ESA planes located closer to the track. On the tarmac in Alert there was the first casualty of the day – despite heroic efforts the EM-bird ice-thickness instrument could not be coaxed into life. The die was cast – the second Twin-Otter plane would have to go it alone and meet up with the NASA P-3.

NASA's sea-ice mission plan for April 2

NASA’s sea-ice mission plan for April 2 (yellow). We teamed up with ESA at 10520 north of Alert. (NASA/M. Studinger)

Around 07:30 (local time) the CryoSat satellite – always on schedule – ripped above the Arctic Ocean taking about one minute to race along the 500-km (310 mile) transect that would later take several hours of plane time to cover.

At 08:00 both the ESA and NASA planes reached the edge of the Arctic Ocean almost simultaneously and headed across the sea ice flying exactly along the same line that CryoSat had just covered. The timing was so good that, for the first time, there was visual contact between the planes, a remarkable achievement!

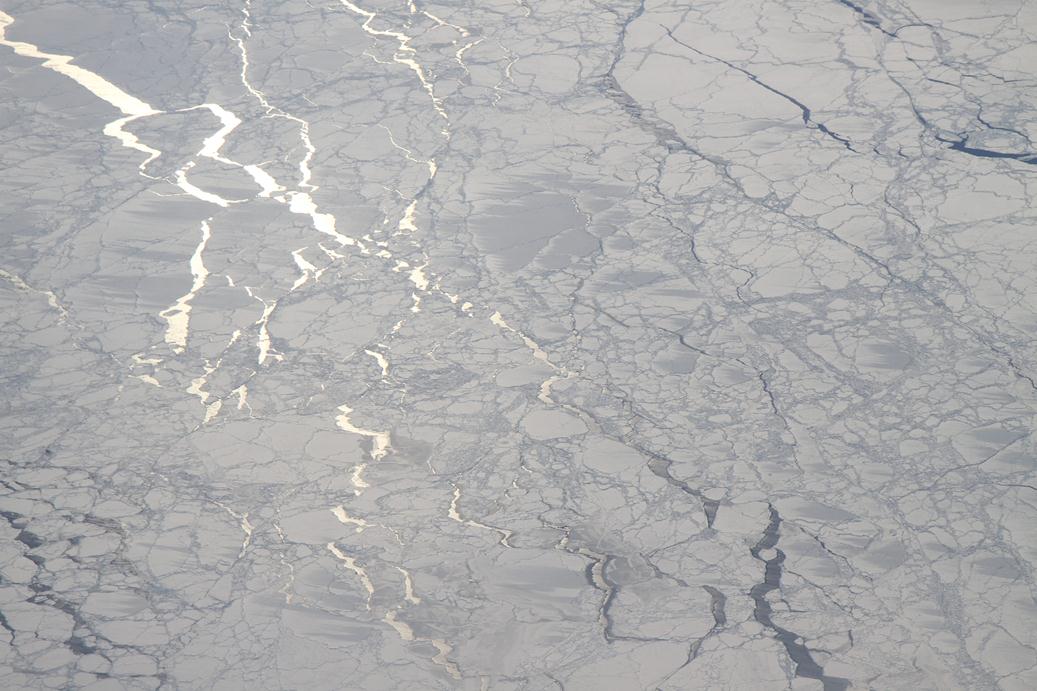
The image below, which is a DMS mosaic from Eric Fraim shows one of the many leads we saw from the NASA P-3 today with a variety of different types of sea ice.

DMS mosaic of lead in the sea ice

DMS mosaic of lead in the sea ice (NASA/DMS/E. Fraim)

The rest of the day turned out very well indeed. The clouds that had worried the teams in the morning only formed only a thin band near the coast. The rest of the line out on the ocean was clear and beautifully lit by the oblique Arctic Sun. All the onboard scientific instruments on both planes worked well so that by the end of the day it was clear that the day had been a success.

By joining forces both the ESA and NASA teams collected a highly valuable dataset that will benefit the scientific achievements of ESA’s CryoSat and NASA’s future ICESat-2 mission to better monitor sea ice from space.

For more about ESA’s CryoSat mission and CryoVEx campaign, visit their Campaign Earth blog 


In the spirit of international collaboration: Honoring the Terra Nova Expedition

By Michael Studinger, IceBridge Project Scientist, NASA Goddard Space Flight Center/UMBC

Thule Air Base, Greenland – March 29, 2012 is a special day for polar researchers worldwide. It marks the centennial of Sir Robert Falcon Scott’s death on the Ross Ice Shelf. Many commemorative events have taken place around the world to remember the scientific accomplishments of the Terra Nova Expedition, particularly those of the Pole Party consisting of Robert Falcon Scott, Edward Wilson, Henry Bowers, Lawrence Oates and Edgar Evans. The most prominent event was a National Service of Commemoration for Captain Scott and the Pole Party at St. Paul’s Cathedral in London, with IceBridge’s own Seelye Martin attending as a guest of honor.

In 2008 I had the privilege to visit Captain Scott’s historic Terra Nova Hut on Cape Evans in Antarctica, and the geographic South Pole, where the National Science Foundation installed a sign bearing Scott’s famous quote said when the party realized the Norwegian expedition, led by Roald Amundsen, had been there first: “The pole. Yes, but under very different circumstances from those expected.” These are moments in my life that I will never forget. Walking through the Terra Nova Hut, which looked like it has been frozen in time, took my breath away.

Inside Captain Scott’s Terra Nova Hut on Cape Evans. The hut was built in 1911 by members of the British Antarctic Expedition (Terra Nova Expedition) and used as base for the trek to South Pole from which Scott and four of his team members never returned. The hut is remarkably well preserved but is undergoing restoration by the Antarctic Heritage Trust to protect it from further decay. The kitchen area on the left is one of the many areas inside and outside the hut that are being worked on. The hut is part of the 100 most endangered sites on the World Monuments Watch List. It is a remarkable place to be to say the least. Credit: Michael Studinger/NASA.

One hundred years later polar research has changed dramatically. On the day of the centennial, NASA’s Operation IceBridge and the European Space Agency’s CryoVEx campaign coordinated flights of two aircraft from different locations over the Arctic Ocean on a track flown shortly before by ESA’s CryoSat-2 spacecraft 600 km (370 miles) above us. We are able to do this because we have modern satellite images that are a few hours old and computer models showing the cloud cover in the survey area. We have modern means of communication that allow us to coordinate these science flights a few hours before takeoff. We know our position within a few feet and the NASA Airborne Science program flight tracker shows our position in real time. A lot has changed to say the least, but nevertheless operating in the remote polar regions remains a challenge even today. Modern navigation computers routinely get confused within a few miles of either the North or South Pole, the extreme cold still poses a challenge and weather predictions can be wrong. The safety and success of our operations is only possible because of extremely experienced and skilled members of the aircrew and instrument teams that excel in meeting the challenges of the polar environment every day.

Discovery Hut near McMurdo Station in Antarctica

McMurdo Station in Antarctica with the historic Discovery Hut in the foreground. The hut was built during Scott’s 1901-1903 expedition. The contrast between old and new is amazing. Observation Hill, the site of the Terra Nova memorial cross can be seen in the background on the right. Credit: Michael Studinger/NASA.

Today’s polar research is driven by a spirit of international collaboration and the joint NASA/ESA flight on March 29, 2012 is a fine example of what can be accomplished when many nations and organizations team up instead of competing with each other. Recognizing the enormous accomplishments of the early polar explorers, we dedicate this flight to the members of the Terra Nova Expedition, who died in Antarctica one hundred years ago.

NASA P-3 flight path

Flight path of the NASA P-3 Orion in yellow during the joint sea ice science mission with ESA’s CryoVEx airborne campaign stationed in Alert on Ellesmere Island and CryoSat-2.