By Nathan Kurtz, IceBridge scientist, NASA Goddard Space Flight Center/Morgan State Univ.
As the IceBridge Arctic sea ice campaign continues another successful year, I’ve been given this wonderful opportunity to discuss my experiences on the mission, and more importantly, how they relate to the critical science questions that need to be answered. I realize that there are many details I find intriguing as a scientist that are inherently uninteresting to non-scientists, so I won’t wax philosophical about how impressed I was to see things like the self-similar structure of deformation patterns in sea ice (if you actually came here for that, I apologize). My aim is to communicate the importance of what we are learning to the broader public who funds and ultimately benefits from this work. I hope you learn something about why we are devoting so many resources to this scientific study, as this is perhaps the most effective type of ‘bridge’ the IceBridge mission can make: to raise awareness of the state of the climate and present the scientific facts as we have gathered them through a long and arduous field campaign.

IceBridge science team member Nathan Kurtz checking out the sea ice conditions. Credit: James Yungel/NASA.
This was my first trip to the ice-covered regions of the Arctic and I fully admit to reverting back to an excited childlike state of wonder as my initial flight to Thule, Greenland, touched down. It was quite striking to take in the sight of the vast snow-covered mountains and frozen sea, feel the bitter cold draining the heat and life from my body and realize that actual ‘monsters’ with an instinctive mindset to view humans as prey were all around. But I was shocked to see a hardened community of people standing resolute against these elements. Even more shocking, was to imagine why humans came here thousands of years ago without modern technology. What led them here? For me, the Arctic has always symbolized the unknown, but with hidden treasures awaiting anyone brave enough to explore it. But I realize my subjective symbolic interpretation is also remarkably universal in that native settlers, polar explorers and scientists must also have come to the Arctic with a desire to explore an unknown wilderness and gain some new knowledge from their experience.
On the scientific end of this knowledge spectrum, recent studies have increasingly shown the importance of the Arctic to the climate. The once seemingly insignificant and remote Arctic region is now understood to be intimately connected to the rest of the planet. Sea ice variability affecting the severity of snow storms in Europe, melting sea ice increasing the absorption of sunlight by the Earth and melting ice sheets causing sea level rise are but a few of many such connections. We are learning that what happens in the Arctic will profoundly affect the whole of humanity all over the Earth. Viewed in this way, it is no longer a coincidence that humans have taken such a keen interest in the Arctic, and that this wild frontier is indeed a source of valuable knowledge waiting to be unearthed.

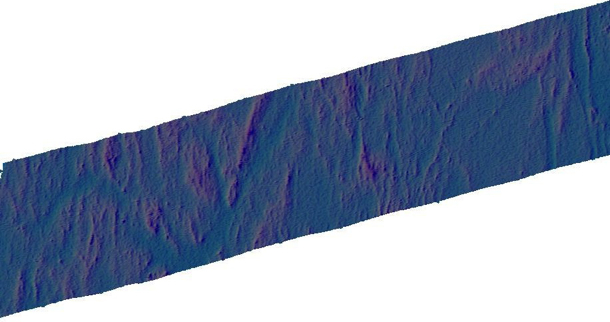
Looking out across the sea ice near Thule, Greenland. Credit: Nathan Kurtz/NASA
As a scientist, the purpose of my trip here is to learn more about the Arctic sea ice cover. My job is to use a combination of lasers, radars, cameras and infrared sensors to determine how the thickness of sea ice is changing, and whether any observed changes can be linked to the larger climate system. Flying over the sea ice with all the IceBridge instruments operating simultaneously has given me a whole new perspective on the mission. It has taken me from my normal desk job of looking at numbers on a computer screen, to the reality of what those numbers represent, and back again full-circle to connecting these concepts in a meaningful way. It has given me the opportunity to physically see that an increased laser surface elevation is actually a large sea ice pressure ridge, a widely spaced radar return is actually a snow drift. That, ultimately, all of the IceBridge results are indeed real and meaningful. It is this connection between numbers on a computer screen to the reality of the ground which will provide me and other scientists with the ability to come up with a rigorous scientific explanation of precisely what role sea ice thickness changes will have on the climate.
In the course of my own analysis of the IceBridge data I have been constantly questioning my methods to ensure that my excursions into the abstract realm of mathematical and scientific theory do not lose sight of this connection to the things I’ve seen on the ground. Questions such as what do I do when I try to invert a matrix of IceBridge data and it explodes? How can I utilize statistics to determine just how accurate these measurements are? Are my solutions to these problems in tune with the physical environment I have witnessed? This ultimately translates into maintaining high standards and objectivity, which is critical to any scientific research area.

Sunrise over sea ice near the North Pole. Credit: James Yungel/NASA
But this is, admittedly, my own subjective understanding of my role in this project. More important, is how my understanding and use of these concepts relates to the scientific results being obtained, and how these results can then be translated into a general statement for the public such as ‘the sea ice thickness decreased by x centimeters’ Towards this end, I and a large team of people have worked for the past two years on developing methods to turn the instrument data from IceBridge into clear and understandable scientific data products. We recently reached a major milestone in the project by demonstrating our ability to produce easy to understand products such as snow depth and sea ice thickness from past missions. In the interest of promoting honest and open exchange of scientific knowledge, we have given public access to these data sets (http://nsidc.org/data/idcsi2.html) in such a way that anyone can look at the latest results of the project. In doing so, we went from the realm of raw instrument data, to something that anyone can understand and interpret.
To further improve the utility of the IceBridge sea ice campaigns, we are attempting an unprecedented feat: to produce a quick version of the scientific products to support operational forecasting of sea ice. This is shaping up to be a monumental undertaking, and we are working hard to understand how to work with days-old field data. It remains to be seen what role IceBridge can play in sea ice forecasting and how we can interpret the data to come up with statements about the state of Arctic sea ice for the general public. But, so far the results from the first few flights look fantastic! We have also provided our preliminary results to support an ESA sponsored campaign conducting field missions in the area. Everything is proceeding in a positive direction, so stay tuned for more updates as the IceBridge mission continues!