Grounded in Truth

By George Hale, IceBridge Science Outreach Coordinator, NASA Goddard Space Flight Center
Measuring polar ice from the air calls for the kind of precision flying made possible by GPS, but the usefulness of those satellites doesn’t end there. GPS information like latitude, longitude and altitude make up a crucial part of IceBridge’s instrument data, showing where each data point was collected, and ground-based GPS gives researchers a benchmark useful for checking instrument accuracy. One of IceBridge’s instruments, the Airborne Topographic Mapper (ATM), uses a laser altimeter to build what is essentially a topographic map of the surface. On each flight IceBridge will pass over the airport’s ramp to make sure that the laser altimeter, or LiDAR, is properly calibrated. Because the airport ramps are large, flat and obstruction free areas of known elevation they act as a sort of Rosetta stone, giving the ATM team something to compare their elevation measurements against.
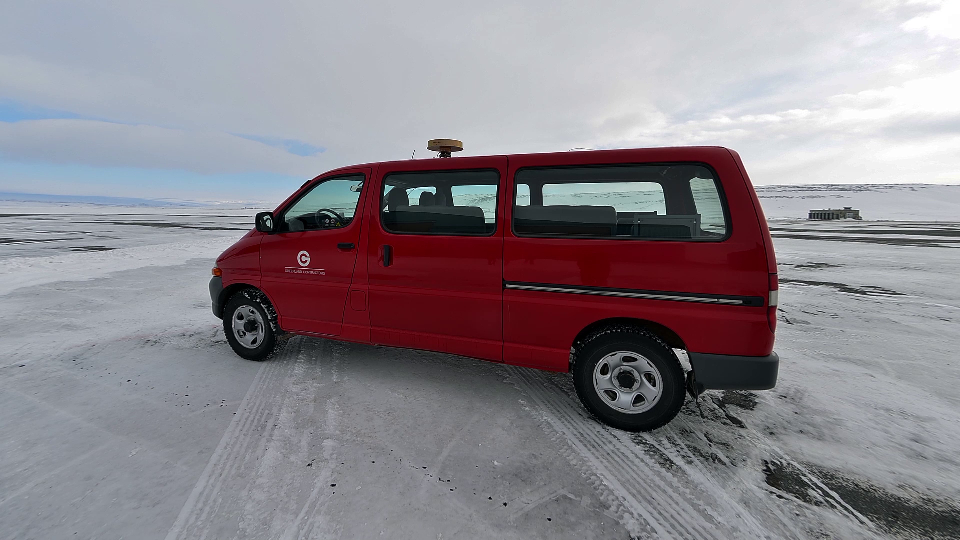
Vehicle with GPS mounted on the roof
Vehicle equipped with a GPS antenna (on roof) before a ground survey of the ramp at Thule Air Base, Greenland. Credit: NASA / Michael Studinger

Having up-to-date elevation data for the entire ramp is the key to these ramp passes. And although IceBridge is an airborne mission this data is collected on the ground by a GPS antenna-equipped car. By driving this car in a grid pattern over the entire ramp and processing the GPS data in specialized software researchers are able to build an elevation map for the entire ramp. This map gives something researchers can use to check instrument readings, and it also reveals something that many people may not expect.

Airport ramps may appear perfectly level and unchanging, but reality is different. First, the elevation of a ramp varies somewhat from one end to the other. “There is a relief of about 3 or 4 meters across the ramp,” said John Sonntag, ATM senior scientist. This relief gives an added benefit though because the slope gives more data to use for calibration. “If the survey shows a tilt of x degrees and the LiDAR shows a tilt of x plus 1, you know you need to make an adjustment,” Sonntag said.
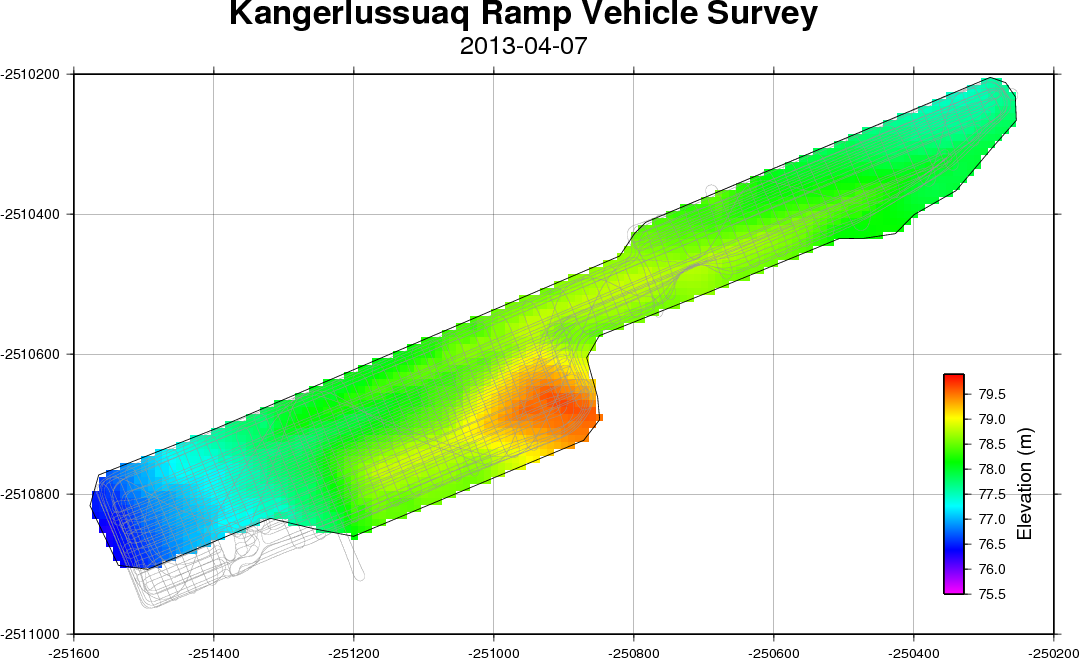
Elevation map of Kangerlussauq airport ramp
Elevation map from a ground survey of the Kangerlussuaq airport ramp. Credit: NASA / ATM team

In addition to sloping, the ramps in Thule and Kangerlussuaq are changing slightly in elevation over time. Obviously any construction or repaving would change elevation slightly, but even the ground itself is rising. Although solid, Greenland’s bedrock has been pushed down and deformed over the years by the weight of the ice sheet. As Greenland’s ice sheet loses mass this downward force lessens and the bedrock starts rising—a process known as isostatic rebound. “In Thule, we’re seeing a rise of about two centimeters per year,” said Sonntag.

Two centimeters may not seem like much, but even that small of a change could affect instrument accuracy. To avoid this IceBridge does ground surveys of the ramps every year or two. Thanks to these regular surveys and continual checking of instrument calibration IceBridge researchers are able to provide the scientific community with accurate measurements of changing polar ice.

Crossing the Basin: IceBridge in Alaska

By George Hale, IceBridge Science Outreach Coordinator, NASA Goddard Space Flight Center

Why does IceBridge fly all the way to Alaska when the rest of the campaign is in Greenland? It’s an understandable question considering how far away these two locations are. But when you consider the economic importance of the regions north of Alaska and how dynamic and varying sea ice in the Arctic is, the picture becomes clearer. Much like last year, the IceBridge team made the 8 hour transit flight from Thule to Fairbanks early in the campaign.

Flight path from Thule to Fairbanks.
Flight path taken from Thule, Greenland, to Fairbanks, Alaska on Mar. 21, 2013. This route and the more southerly return leg have been flown in every IceBridge Arctic campaign. The flightplan was renamed this year as a tribute to sea ice scientist Seymour Laxon. Credit: NASA

Ice on the Move

At first glance it might be easy to assume that Arctic sea ice is uniform, but the region’s geography, ocean and wind currents and the ever-changing nature of ice itself mean that conditions can vary significantly across the Arctic Basin. “There are lots of different thickness gradients across the basin,” said Jackie Richter-Menge, sea ice scientist with the U.S. Army Corps of Engineers and co-lead of the IceBridge science team.

Ocean currents like the Beaufort Gyre continuously spin in the Arctic Ocean, driving ice cover along the coast of North America toward Greenland where it is compressed into thicker multi-year ice. The presence of multi-year ice is one of the biggest differences between the ice cover off the coast of Greenland and in the region of the Arctic Basin north of Alaska, which is recently dominated by ice that forms in the winter and disappears in the summer.

DMS mosaic of ice in the Beaufort Sea.
Digital Mapping System (DMS) image mosaic of ice in the Beaufort Sea. The lighter colored portion at the bottom right is thick sea ice, the darker blue-gray areas are thinner ice and the dark segment in the middle is open water. Credit: NASA / DMS

This seasonal ice cover is becoming more prevalent in areas north of Alaska as the thicker multi-year ice gradually melts. On the Mar. 22 IceBridge flight Richter-Menge saw firsthand how things have changed since she flew over the region earlier in her career in the 1980s. “It was notable how deep we went in the basin without seeing multi-year ice,” Richter-Menge said. IceBridge didn’t see multi-year ice until they were about 1000 kilometers from shore. In the early 1980s it could be found between 150 and 200 kilometers out.

Getting Better Data

These sorts of changes, along with environmental and economic concerns, contributed to the science communities increased desire for data on sea ice this part of the Arctic Basin. IceBridge had conducted transits of the entire basin from Thule to Fairbanks in previous campaigns, but starting in 2012, the mission started doing a temporary deployment in Fairbanks to get more data on areas north of Alaska.

IceBridge’s increased coverage is adding to the body of knowledge on ice in this region adding a new level of detail. “It gives us a more complete view of what’s going on in the basin,” said Richter-Menge. The data collected on these flights give more geographic coverage to IceBridge’s sea ice data products, especially the quick look product that debuted during last year’s Arctic campaign. This dataset came about in response to a need for near real-time sea ice conditions for use in seasonal sea ice forecasts.

Graph of Arctic sea ice volume from the Pan-Arctic Ice Ocean Modeling and Assimilation System (PIOMAS)
Graph of Arctic sea ice volume from the Pan-Arctic Ice Ocean Modeling and Assimilation System (PIOMAS). Credit: Polar Science Center / University of Washington

Along with data on sea ice freeboard, the amount of ice floating above the ocean’s surface, many in the scientific community have taken an interest in IceBridge’s snow depth measurements. Snow depth gives a way to measure changes in precipitation rate and differences in accumulation affect how much snow is available for melt ponds. As conditions warm in the summer, snow melts and accumulates in ponds. These ponds are darker than the surrounding snow, trapping more of the sun’s heat and further accelerating melting.

Richter-Menge (left) and the IceBridge team before a flight over the Beaufort Sea on Mar. 22, 2013.
Jackie Richter-Menge (left) and the IceBridge team before a flight over the Beaufort Sea on Mar. 22, 2013. Credit: NASA / Jim Yungel

Learning and Teaching

As a guest on the flights out of Fairbanks Richter-Menge got a chance to see firsthand how IceBridge collects sea ice data. Being able to witness this complicated and involved process helps give a better-rounded picture of the mission, Richter-Menge said. In addition to the data-collection that takes up each flight, Richter-Menge got to see the work it takes to choose which mission to fly each morning. “It was impressive to watch the whole decision-making process for choosing flight lines,” said Richter-Menge.

And as is often the case, the flow of information goes both ways. Richter-Menge and fellow sea ice scientist Sinead Farrell spent plenty of time on their flights sitting at a window aboard the P-3 and explaining what everyone was seeing. “We are learning a lot about sea ice with them here,” said Christy Hansen, IceBridge’s project manager.

IceBridge Arctic 2013 Check Flights Complete

By George Hale, IceBridge Science Outreach Coordinator, NASA Goddard Space Flight Center

On Mar. 14 and 15, the IceBridge team carried out project check flights in preparation for the Arctic campaign. After an engineering check flight earlier in the week to make sure everything is properly secured inside the aircraft, scientists and a small number of instrument operators board the P-3 to begin flights over the Wallops Flight Facility airfield and beaches near Wallops Island, Va., to test the Airborne Topographic Mapper (ATM) and Digital Mapping System (DMS) and over the Atlantic Ocean to test the Multichannel Coherent Radar Depth Sounder (MCoRDS), the snow and accumulation radars, and Ku-band radar altimeter.

These check flights have two main purposes. The first is to test the equipment to make sure it’s all in working order and the second is to collect data that is used to calibrate the instruments. Every time an instrument is installed in a research aircraft it’s important to make sure that nothing has changed since the last time it was flown.

Flight paths for both IceBridge check flights.

Flight paths for IceBridge check flights on Mar. 14 (blue) and Mar. 15 (red). Credit: NASA

Ground tests can catch many alignment and installation problems, but the real moment of truth comes in flight tests. On the afternoon of Mar. 14, the IceBridge team took off for flights near Wallops to test the ATM and DMS systems and check other electronics. By flying a level flight at varying altitudes, the teams can collect data that ensures their instruments are properly calibrated.

Different materials reflect light to varying degrees, which can make a difference with a laser-based instrument like ATM. Because IceBridge is measuring snow and ice, highly reflective materials, the ATM team will often test over sandy areas the beaches near Wallops. This is because sand reflects light in a similar way to ice. Another test is to check areas near each other with widely different albedos, for example, the white numbers and surrounding dark pavement on the runway. If light and dark targets next to each other show the same elevation then the instrument is calibrated properly.

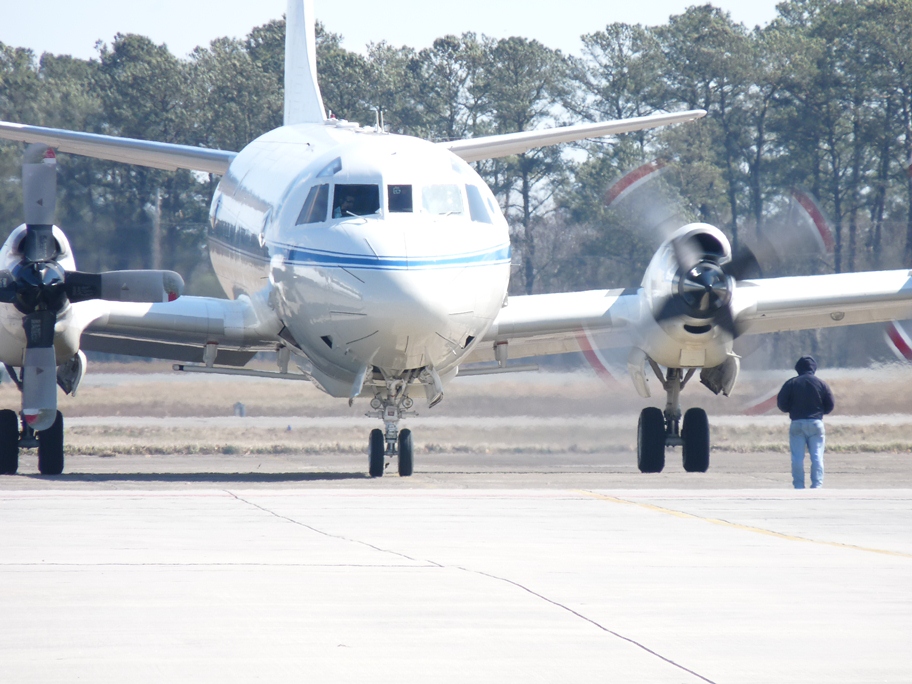
The NASA P-3B at Wallops Flight Facility before the IceBridge check flight on Mar. 14, 2013. Credit: NASA / Kyle Krabill

Similarly, the team tests the DMS instruments to make sure the camera is aligned properly and that focus and frame rate are set appropriately. The rate at which the DMS camera captures photos depends on the aircraft’s speed and altitude, with lower altitude and higher speeds needing a faster rate to ensure proper coverage.

On Mar. 15, the team took off in the morning to do final checks of the P-3B’s radar instruments. Instead of flying along the beaches near Wallops, the P-3 headed out 200 nautical miles over open water in the Atlantic Ocean. The reason for doing this test over the ocean is twofold. First, U.S. law prevents IceBridge from operating its radars inside the country, and second, the ocean surface acts almost like a mirror for the radar, making it ideal for testing. By comparing transmit and return signal strengths at different altitudes, the team can make sure the radar is working properly.

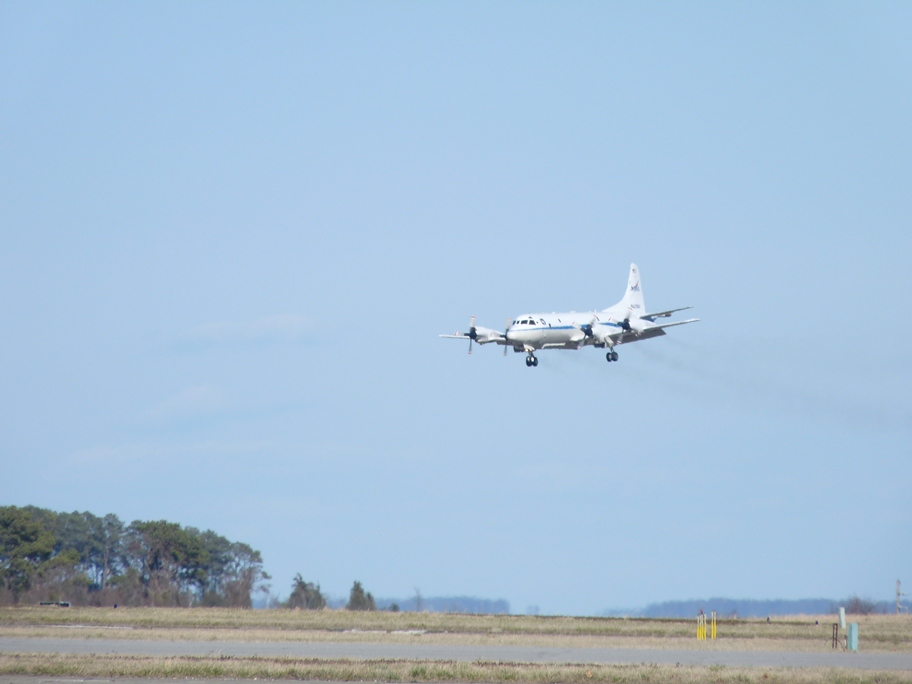
The P-3B returns to Wallops after the first of two IceBridge check flights. Credit: NASA / Kyle Krabill

Signal strength, however, is only part of the picture. MCoRDS is made up of several antennas in an array, with each antenna’s signal recorded separately. To make sure that each element is aligned correctly, the P-3B climbs to a high altitude and banks left and right while researchers measure how the return signals change during the maneuver. These maneuvers are also the reason why the radars are tested on a separate day from ATM and DMS. Once the plane banks more than 15 degrees, its wing blocks these instruments from seeing GPS satellites in orbit and both ATM and DMS need accurate GPS data to work properly.

With the check flights complete it is nearly time for IceBridge scientists, instrument team members and flight crew to make the trip to Thule, Greenland, to start the 2013 Arctic campaign. The P-3B is scheduled to make the transit flight from Wallops early on the morning of Mar. 18, and the first science flight is scheduled for Mar. 20.

Preparations for Arctic Campaign Under Way

By George Hale, IceBridge Science Outreach Coordinator, NASA Goddard Space Flight Center

An IceBridge field campaign is the culmination of months of planning and preparation. At January’s science team meeting, scientists focused the campaign’s goals and provided mission planners the details needed to finalize flight plans. With these final details ironed out the next step was to start preparing the tools of the trade, IceBridge’s aircraft and instruments. For the past several days, instrument teams and aircraft technicians at NASA’s Wallops Flight Facility in Wallops Island, Va., have been getting the P-3B ready for the 2013 Arctic campaign, which is scheduled to have its first science flight on Mar. 20.

Operation IceBridge is but one of several missions to use NASA’s P-3B airborne laboratory. After each mission, this aircraft returns to its home base at Wallops where it undergoes repairs and routine scheduled maintenance needed to keep it flying at peak efficiency and where science instruments are swapped out. This rotation of airborne science missions keeps the Wallops aircraft team busy, preparing between three and five missions per year. “Sometimes it’s more and sometimes it’s less,” said P-3B flight engineer Brian Yates. “We’re working on some relatively large projects, so we have five this year.”

NASA's P-3B airborne laboratory in a hangar at Wallops Flight Facility as it is being prepared for the upcoming Arctic campaign.

NASA’s P-3B airborne laboratory in a hangar at Wallops Flight Facility as it is being prepared for the upcoming Arctic campaign. Credit: NASA / George Hale

After the aircraft’s maintenance is complete and the previous mission’s equipment has been removed, the IceBridge team starts installing the mission’s suite of science instruments. This process can be generally divided into a few portions: installing the instrument and the equipment needed to control it and collect data, testing the individual instruments and checking to make sure the aircraft and instrument suite work together as they should.

The first step is installing the components that gather the data, such as cameras, radar arrays and laser transceivers. The Airborne Topographic Mapper (ATM) laser and Digital Mapping System (DMS) cameras are installed in bays on the underside of the aircraft. Each of these instruments looks down through windows in the plane’s belly. The Multichannel Coherent Radar Depth Sounder (MCoRDS) antenna is attached to the underside of the aircraft. Previously this has included antennas under the wings, but IceBridge is flying with a trimmed down MCoRDS instrument with an array beneath the P-3B’s fuselage.Additional radar instruments like the accumulation and snow radars and Ku-band radar altimeter are also installed at this time.

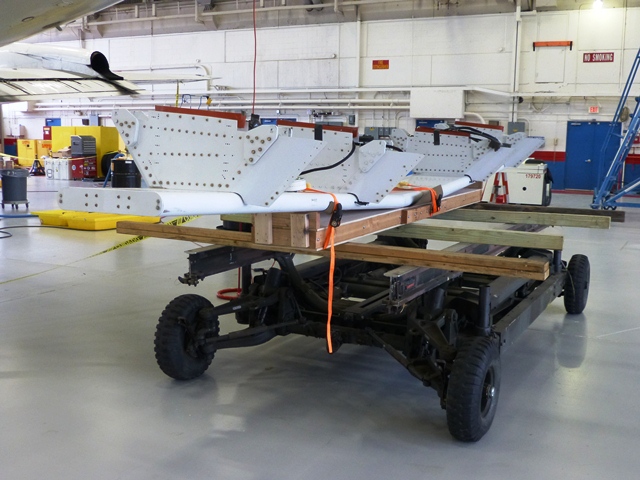
The MCoRDS radar antenna on a cart prior to being attached to the underside of the P-3B.

The MCoRDS radar antenna on a cart prior to being attached to the underside of the P-3B. Credit: NASA / George Hale

While this hardware was being installed on the plane, other members of the instrument team put together all of the hardware needed to operate the instruments in metal racks that are then securely bolted to the floor of the plane. Making sure everything is securely fastened is crucial because of the often turbulent nature of low-altitude polar survey flights.

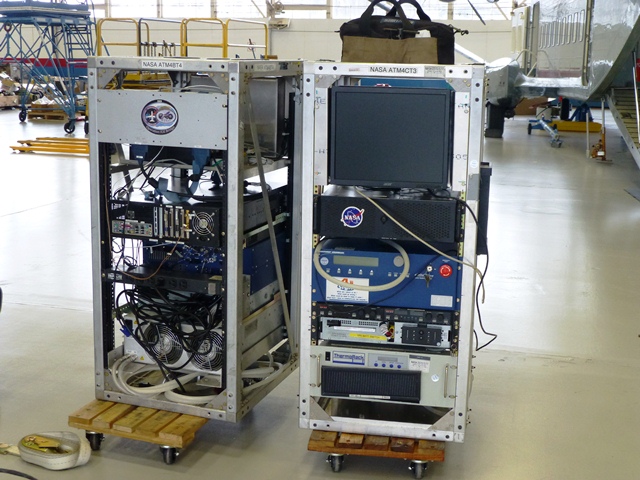
ATM equipment racks waiting to be installed in the P-3B.
ATM equipment racks waiting to be installed in the P-3B. Credit: NASA / George Hale

Once everything is in place and secured the next step is to make sure the instruments work properly. This means rounds of testing both on the ground and in the air. Ground testing involves checking instrument connections and alignment. “We’ll check on the camera to make sure it’s seeing through the window ok and not catching the edge,” said DMS field engineer Dennis Gearhart.

Everything being used in this IceBridge campaign has flown before, but it’s important to make sure the instruments are working properly.”We want to make sure things work as well as they did when they were put into storage,” said ATM program manager James Yungel. To do this, the ATM team will bounce the laser off a ground target 500 feet away.

The MCoRDS antenna secured to the underside of the P-3B.

The MCoRDS antenna secured to the underside of the P-3B. Credit: NASA / George Hale

The real test of all this work comes with the mission’s check flights on Mar. 13 and 14. The first flight, known as an engineering check flight is carried out with flight crew only and is to ensure that everything is properly installed and secured. Scientists and instrument operators participate in the second flight, where instruments are powered on and tested. “The check flights are a final arbiter,” said Yungel.

This year’s IceBridge Arctic campaign will run from Mar. 18 through May 3. The P-3B will operate out of airfields in Thule and Kangerlussuaq, Greenland, and Fairbanks, Alaska.

NASA Goddard Hosts IceBridge Science Team Meeting

By George Hale, Science Outreach Coordinator, NASA Goddard Space Flight Center

Large scientific missions like IceBridge take continual planning to keep running. In addition to regular telephone and email collaboration, IceBridge researchers meet in person twice a year to discuss the mission’s science aims, results and plans for future campaigns. The first of 2013’s IceBridge science team meetings and the annual meeting of the Program for Arctic Regional Climate Assessment (PARCA) took place at NASA’s Goddard Space Flight Center in Greenbelt, Md., Jan. 29–31.

The IceBridge science team is a group of polar scientists from a variety of institutions and serves multiple functions. The largest of these functions is guiding the mission toward meeting its science requirements.”The team provides general guidance and advice,” said IceBridge project scientist Michael Studinger. “They look at how far down the road we are to meeting our level one science requirements.”

The science team meeting was joined by the annual meeting of PARCA, a NASA initiated program started in 1995 to understand changes to the Greenland Ice Sheet. This was to be accomplished through periodic airborne surveys, satellite remote sensing and surface-based research. Starting in 2009, PARCA’s annual meeting has been scheduled to coincide with IceBridge’s science team meeting. “Originally PARCA was a Greenland field campaign planning meeting,” said NASA scientist Charles Webb. “Having the meetings together logically makes sense.”

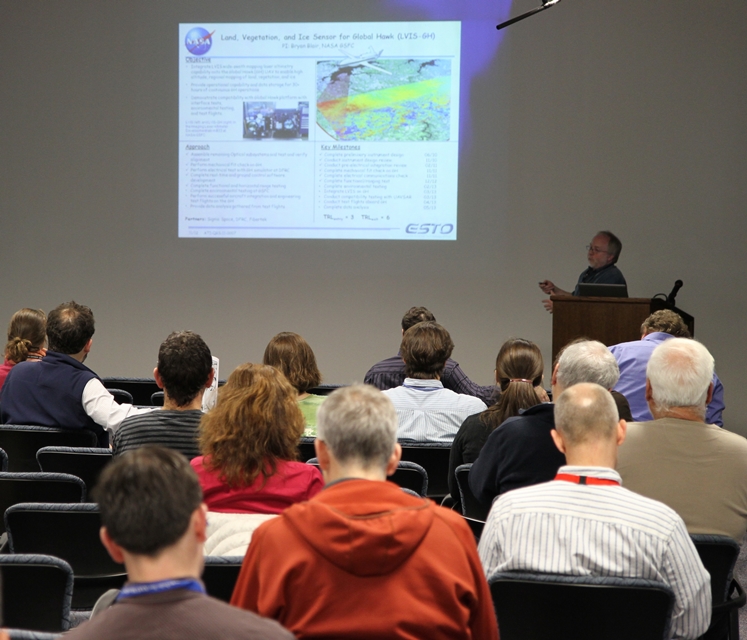
NASA scientist Bryan Blair gives a presentation on the future of the Land Vegetation and Ice Sensor (LVIS)
NASA scientist Bryan Blair gives a presentation on the future of the Land Vegetation and Ice Sensor (LVIS). Credit: NASA / Jefferson Beck

Presentation topics at both meetings ranged from the use of IceBridge data in seasonal sea ice forecasts to the use of radar to image layers in ice sheets to new algorithms for mapping bedrock beneath the ice.Other presentations included status updates for instruments like the Airborne Topographic Mapper (ATM) and Land, Vegetation and Ice Sensor (LVIS) and a look ahead at NASA’s next-generation polar monitoring satellite, ICESat-2.

The PARCA meeting started on Jan. 29 with sessions on newresearch and novel ways to work with IceBridge and other cryospheric data. Participantsclosed out a busy day with a remembrance of cryospheric scientist SeymourLaxon, whose unexpected death earlier in the month shocked the polar sciencecommunity, and a poster session and dinner at Goddard’s recreation center.

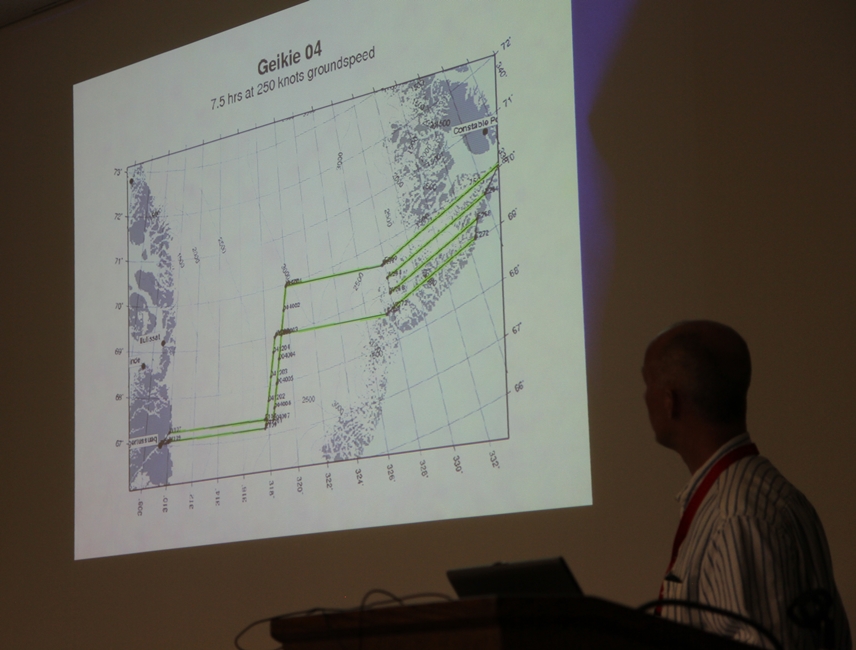
PARCA sessions finished up on the morning of Jan. 30, covering integrating IceBridge data, radar mapping of ice sheets and next steps in ice sheet physics. After lunch, the IceBridge science team meeting started, with breakout sessions by the sea ice and land ice science teams. In these sessions,science team members discussed research and plans for the upcoming IceBridge Arctic campaign and beyond, including collaborations with various other groups outside of NASA. Later in the day, ATM senior scientist John Sonntag presented planned flight lines for the 2013 Arctic campaign and invited comments on suggestions for ways the lines can better meet IceBridge’s science goals.

ATM senior scientist John Sonntag shows proposed flight plans for 2013 Arctic campaign.
ATM senior scientist John Sonntag shows proposed flight plans for 2013 Arctic campaign. Credit: NASA / Jefferson Beck

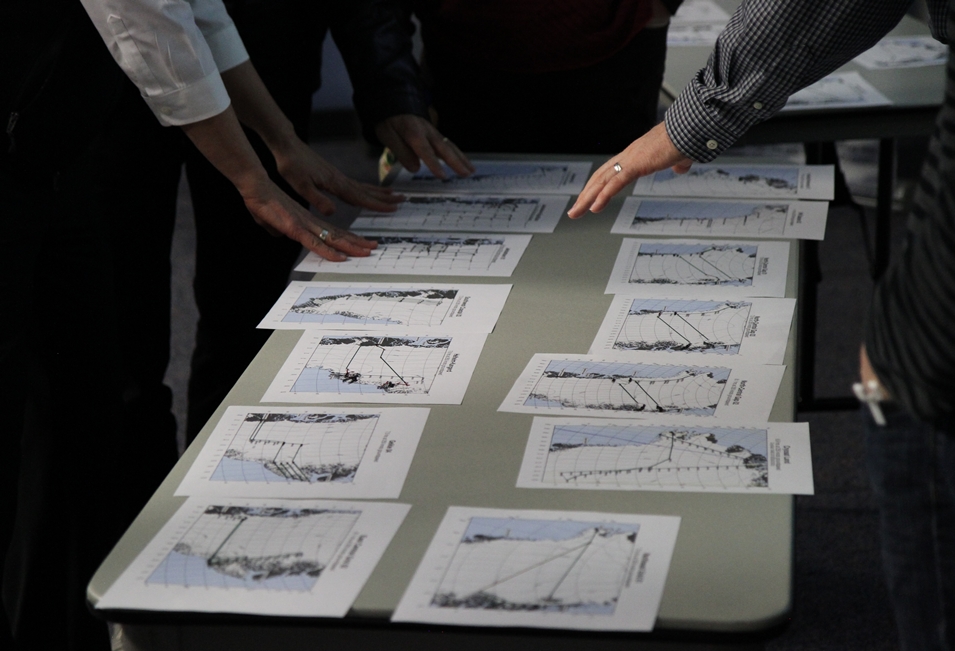
The last day of the IceBridge science team meeting saw more sessions on IceBridge science, data and future plans. Included in the sesessions were talks about new instruments like a version of LVIS soon to be tested on NASA’s Global Hawk, status updates on ICESat-2 and a final discussion of proposed flight lines for the IceBridge Arctic campaign, where flight plans were assigned priorities and finalized. This year, IceBridge science team member Robin Bell from Lamont-Doherty Earth Observatory of Columbia University came up with a new and hands-on way to improve this process. Bell set up three tables representing high, medium and low priorities, onto which printed copies of flight plans were sorted. “This gave us a more visual and intuitive feel for how the flight lines fit together,” said Sonntag. “It was a good way to get flight priorities straightened out.”

This sort of discussion, where scientists hash out details on research goals, priorities and methodologies is at the heart of not only IceBridge, but scientific work in general. “The research landscape is constantly evolving, so you have to rethink how you approach problems and organize the community once in a while,” said Studinger. “You need constant evaluation and discussion of ideas and results.”

Science team members sort through printed copies of proposed flight lines.
Science team members sort through printed copies of proposed flight lines. Credit: NASA / Jefferson Beck

Operation IceBridge surveys new areas in the Beaufort and Chukchi Seas north of Alaska

By Michael Studinger, IceBridge Project Scientist, NASA Goddard Space Flight Center/UMBC

Fairbanks, AK – The two most important sea ice flights every year are two crossings of the entire Arctic Basin, north of Greenland and Canada all the way to Alaska. This year we decided to make the flights to and from Fairbanks earlier than usual because of the weather. The forecast at Thule was predicting a major storm system for the next few days. Storm season in Thule lasts Sept. 15–May 15, and every year blizzards with wind speeds of over 100 miles per hour and white out conditions hit the base, locking us down for a few days.

There are several challenges involved with these two flights. First, the survey lines are 1600 miles long and it is very rare to have such a large area free of clouds and fog, particularly over the Arctic Ocean. Imagine flying from New York to Colorado at 1500 feet above the surface and having neither clouds nor fog the whole way. Getting good data from our optical sensors, such as laser altimeters and digital cameras, we need clear conditions between the aircraft and the ice surface.


IceBridgeflight from Thule, Greenland to Fairbanks, AK that surveyed sea ice along atransect over the entire Arctic Basin. Basemap is MODIS satellite image showingcloud cover and sea ice over the Arctic Ocean.

A second challenge comes from predicting the weather in such a remote area. We have infrared satellite images and computer models available, but these models cannot be validated because there are no weather stations in the Arctic Ocean. Also, neither the forecast models nor satellite images show the weather features that are most important to us: low clouds and ice fog that disrupt the laser and camera measurements.

The third challenge is that we have to relocate the aircraft, crew and scientists to Fairbanks on very short notice, since the frequent changes in weather allow us to make this decision only a few hours before takeoff.

The NASA P-3 aircraft is being prepared on a chilly morning for a sea ice mission over the Beaufort and Chukchi Seas from Fairbanks, Alaska. Photo: Michael Studinger/NASA.

TheNASA P-3 aircraft is being prepared on a chilly morning for a sea ice missionover the Beaufort and Chukchi Seas from Fairbanks, Alaska. Photo: MichaelStudinger/NASA.

In order to characterize the state of the Arctic ice pack we need to survey large regions and determine the thickness of the multiyear ice that remains from the previous summer and the growth of new first year ice during the winter. We have had several successful flights over the Beaufort and Chukchi Seas from Fairbanks that surveyed primarily the newly formed first year ice in this area. This is a new area for IceBridge and an important data set to monitor changes in the Arctic environment.

We are planning to stay here in Fairbanks for a few more days before we return to Thule Air Base in Greenland to continue our campaign and survey the sea ice north of Greenland.

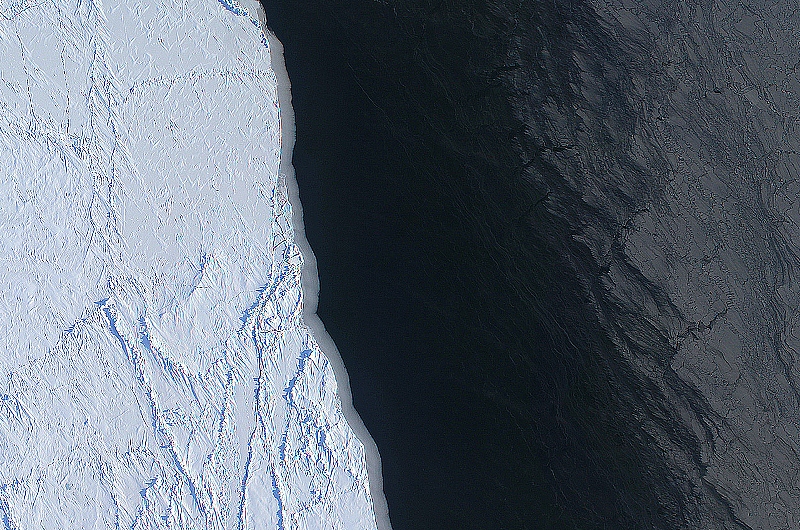
The margin of a large lead of open water (dark) and thingrease ice (gray, right) in the Chukchi Sea between Alaska and Russia. Theimage was create using several frames from the Digital Mapping System (DMS)onboard the NASA P-3. Image: NASA/DMS/Eric Fraim.


Getting Ready for the 2012 Arctic Campaign

By Michael Studinger, IceBridge Project Scientist, NASA Goddard Space Flight Center/UMBC

Wallops Flight Facility, Wallops Island, VA – Welcome to the fourth annual Arctic campaign with NASA’s Operation IceBridge. Over 75 days, we will collect data with two aircraft over the Greenland Ice Sheet, the Arctic Ocean and the Canadian ice caps. We will be based in Kangerlussuaq and Thule Airbase in Greenland, and in Fairbanks, Alaska for sea ice flights over the Beaufort Sea.

During the past several weeks, Operation IceBridge teams have worked at NASA’s Wallops Flight Facility on the eastern shore of Virginia, installing cutting-edge laser altimeters and extremely sensitive radars that will allow us to measure changes in sea ice thickness in the Arctic Ocean. We will also be monitoring changes in the thickness of ice sheets and glaciers that cover most of the subcontinent of Greenland and the Canadian Arctic Archipelago. We will start our campaign with NASA’s P-3B Orion research aircraft from Wallops at Thule Airbase in northern Greenland with sea ice missions over the Arctic Ocean. The extent and thickness of the sea ice cover in the Arctic Ocean is declining quickly and we are there to take measurements that document this change from year to year. The second plane in this year’s Artic campaign, a Falcon HU-25 jet operated by NASA’s Langley Research Center in Hampton, Va., will join the campaign later in April carrying the Land, Vegetation, and Ice Sensor (LVIS), a high-altitude laser altimeter capable of measuring a 2-km-wide (1.2-mile-wide) swath.

The P-3B aircraft inside the hangar at NASA’s Wallops Flight Facility in Virginia.

The P-3B aircraft inside the hangar at NASA’s Wallops Flight Facility in Virginia. Credit: Michael Studinger.

Before we can start collecting data over the Artic we have to make sure that all installed sensors on the P-3 work and are calibrated. In order to make extremely precise laser altimeter measurements of the ice surface elevation we calibrate the instruments using target sites at the Wallops Flight Facility that we have surveyed on the ground. A second test flight takes us out over the Atlantic Ocean, some 200 miles away from the coast, where we can switch on the radar systems from the Center for Remote Sensing of Ice Sheets (CReSIS) at the University of Kansas, without interfering with other systems. We use the radar signal that is bouncing back from the ocean surface to calibrate the radars. We also did a couple of maneuvers at high-altitude over the Atlantic to calibrate the antennas of the ice-penetrating radar systems that we will use to survey the sea ice, glaciers and ice sheets.

Research flying has little in common with everyday air travel. One of the maneuvers that we do during the test flights is to fly the aircraft at a 90° roll angle with the wings perpendicular to the horizon. Fasten your seat belts! You will (hopefully) never experience something like this on a commercial flight.

The P-3B on the ramp before a test flight. The antennas of the ice-penetrating radar system can be seen mounted under the wings.

The P-3B on the ramp before a test flight. The antennas of the ice-penetrating radar system can be seen mounted under the wings. Credit: Michael Studinger.

We are collaborating with other experiments such as CryoVEx, the CryoSat-2 calibration and validation campaign from the European Space Agency. We will also work closely together with teams that work on the ground and take measurements over sea ice in the Arctic Ocean, and do coordinated flights with an ER-2 high-altitude aircraft from NASA’s Dryden Flight Research Center in Edwards, Calif. The ER-2, a civilian research version of the Air Force’s U-2 , will carry the Multiple Altimeter Beam Experimental Lidar (MABEL). The ER-2 will fly out of Keflavik, Iceland, and climb to 60,000 feet on its way to Greenland to measure the same tracks as the P-3B Orion.

We have now completed all our test flights here at Wallops and are ready to go to Greenland where we hope to map much of the sea ice cover over the Arctic Ocean and the Greenland Ice Sheet.