By George Hale, IceBridge Science Outreach Coordinator, NASA Goddard Space Flight Center
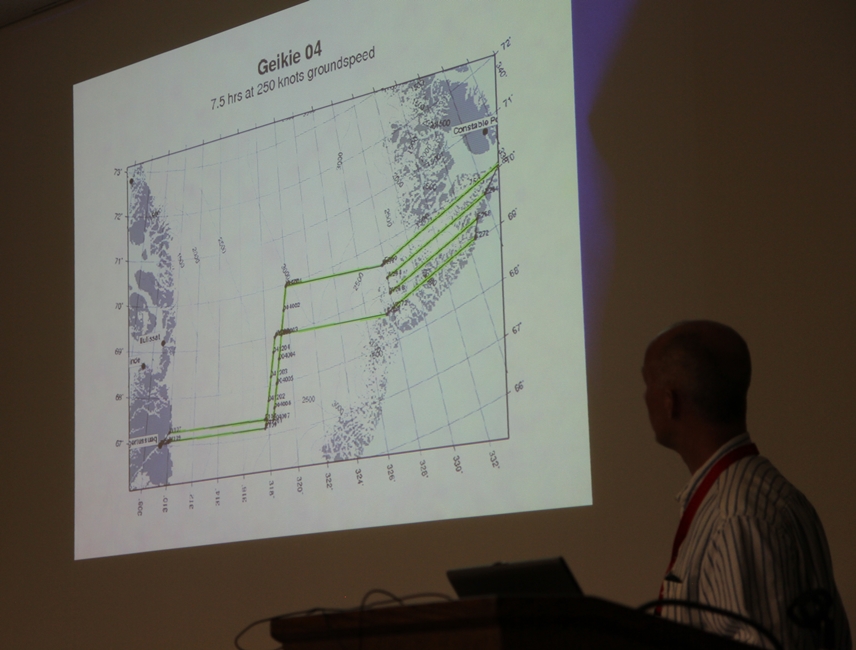
Why does IceBridge fly all the way to Alaska when the rest of the campaign is in Greenland? It’s an understandable question considering how far away these two locations are. But when you consider the economic importance of the regions north of Alaska and how dynamic and varying sea ice in the Arctic is, the picture becomes clearer. Much like last year, the IceBridge team made the 8 hour transit flight from Thule to Fairbanks early in the campaign.

Flight path taken from Thule, Greenland, to Fairbanks, Alaska on Mar. 21, 2013. This route and the more southerly return leg have been flown in every IceBridge Arctic campaign. The flightplan was renamed this year as a tribute to sea ice scientist Seymour Laxon. Credit: NASA
Ice on the Move
At first glance it might be easy to assume that Arctic sea ice is uniform, but the region’s geography, ocean and wind currents and the ever-changing nature of ice itself mean that conditions can vary significantly across the Arctic Basin. “There are lots of different thickness gradients across the basin,” said Jackie Richter-Menge, sea ice scientist with the U.S. Army Corps of Engineers and co-lead of the IceBridge science team.
Ocean currents like the Beaufort Gyre continuously spin in the Arctic Ocean, driving ice cover along the coast of North America toward Greenland where it is compressed into thicker multi-year ice. The presence of multi-year ice is one of the biggest differences between the ice cover off the coast of Greenland and in the region of the Arctic Basin north of Alaska, which is recently dominated by ice that forms in the winter and disappears in the summer.

Digital Mapping System (DMS) image mosaic of ice in the Beaufort Sea. The lighter colored portion at the bottom right is thick sea ice, the darker blue-gray areas are thinner ice and the dark segment in the middle is open water. Credit: NASA / DMS
This seasonal ice cover is becoming more prevalent in areas north of Alaska as the thicker multi-year ice gradually melts. On the Mar. 22 IceBridge flight Richter-Menge saw firsthand how things have changed since she flew over the region earlier in her career in the 1980s. “It was notable how deep we went in the basin without seeing multi-year ice,” Richter-Menge said. IceBridge didn’t see multi-year ice until they were about 1000 kilometers from shore. In the early 1980s it could be found between 150 and 200 kilometers out.
Getting Better Data
These sorts of changes, along with environmental and economic concerns, contributed to the science communities increased desire for data on sea ice this part of the Arctic Basin. IceBridge had conducted transits of the entire basin from Thule to Fairbanks in previous campaigns, but starting in 2012, the mission started doing a temporary deployment in Fairbanks to get more data on areas north of Alaska.
IceBridge’s increased coverage is adding to the body of knowledge on ice in this region adding a new level of detail. “It gives us a more complete view of what’s going on in the basin,” said Richter-Menge. The data collected on these flights give more geographic coverage to IceBridge’s sea ice data products, especially the quick look product that debuted during last year’s Arctic campaign. This dataset came about in response to a need for near real-time sea ice conditions for use in seasonal sea ice forecasts.

Graph of Arctic sea ice volume from the Pan-Arctic Ice Ocean Modeling and Assimilation System (PIOMAS). Credit: Polar Science Center / University of Washington
Along with data on sea ice freeboard, the amount of ice floating above the ocean’s surface, many in the scientific community have taken an interest in IceBridge’s snow depth measurements. Snow depth gives a way to measure changes in precipitation rate and differences in accumulation affect how much snow is available for melt ponds. As conditions warm in the summer, snow melts and accumulates in ponds. These ponds are darker than the surrounding snow, trapping more of the sun’s heat and further accelerating melting.

Jackie Richter-Menge (left) and the IceBridge team before a flight over the Beaufort Sea on Mar. 22, 2013. Credit: NASA / Jim Yungel
Learning and Teaching
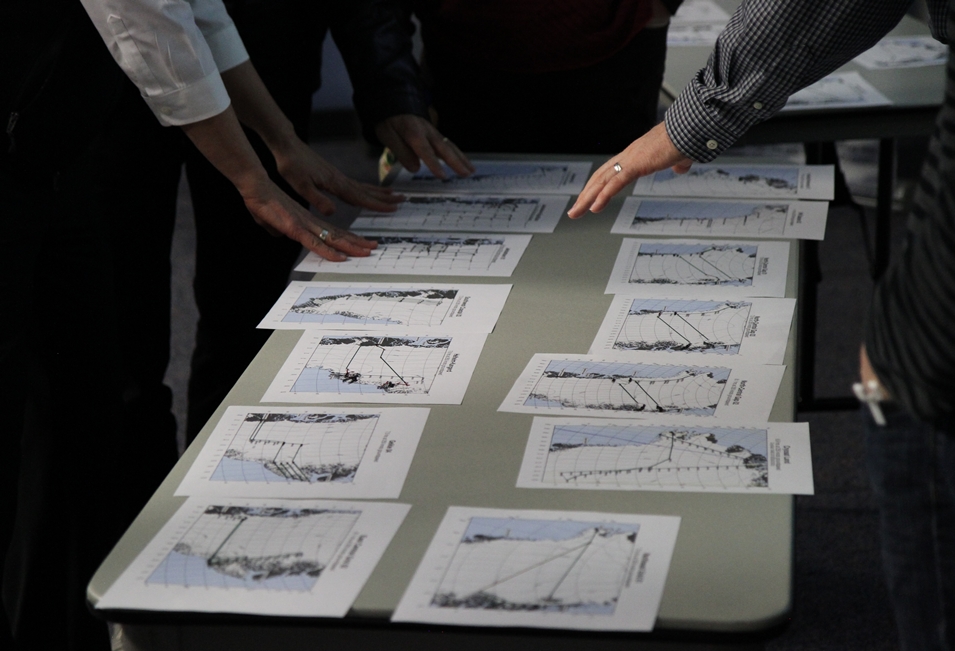
As a guest on the flights out of Fairbanks Richter-Menge got a chance to see firsthand how IceBridge collects sea ice data. Being able to witness this complicated and involved process helps give a better-rounded picture of the mission, Richter-Menge said. In addition to the data-collection that takes up each flight, Richter-Menge got to see the work it takes to choose which mission to fly each morning. “It was impressive to watch the whole decision-making process for choosing flight lines,” said Richter-Menge.
And as is often the case, the flow of information goes both ways. Richter-Menge and fellow sea ice scientist Sinead Farrell spent plenty of time on their flights sitting at a window aboard the P-3 and explaining what everyone was seeing. “We are learning a lot about sea ice with them here,” said Christy Hansen, IceBridge’s project manager.




.jpg)


