Yes,It's Cold in Thule

On April 6, the IceBridge blog received a comment from a first-grade class in response to a March 30 post,”Notes from the Shack.” The class asked a series of questions based on Colleen McIntosh’s words and photos from Thule, Greenland, where she is working as a data analyst and programmer in a GPS Shack during NASA’s IceBridge mission. Answers to the class’ questions, below, were compiled by McIntosh.

Students: How cold is it there?

IceBridge: During the time we have been up here the temperatures have ranged from -12 to 35 F. Typically, like just about everywhere, it is colder in the morning and night, and as the sun rises higher in the sky it warms up. However, on average for the last week or so, it has been around 11 F throughout the day.

Students: Does it ever snow?

IceBridge: Yes it does snow here. However, it is extremely cold and dry up here. When the air is very cold there is a lack of water vapor. Snow is of course made of water, so if it is too dry — even though it may be very cold — it is less likely to snow. And if it does snow it doesn’t snow a whole lot. But since it is so cold up here, when it does snow, it takes a very long time for the snow to melt. So there is snow up here that may be from snowfalls months ago, it just hasn’t melted yet!


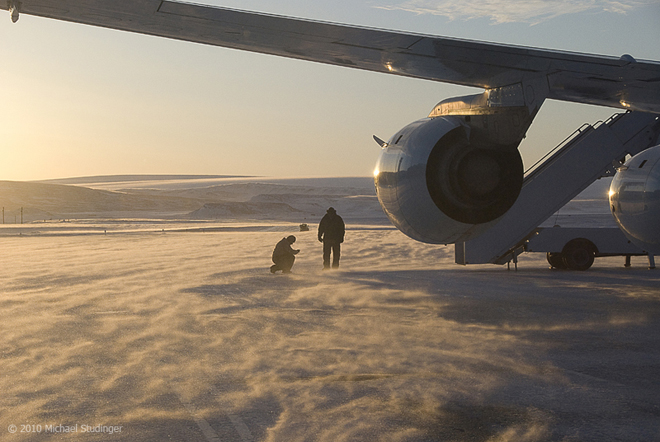
DC-8 crew members Leo Salazar and Scott Silver in blowing snow on the ramp shortly before takeoff from Thule Air Base to the fifth science flight of Operation IceBridge. Credit: Michael Studinger

Students:
How many people are working with you?

IceBridge: It depends on what you mean by working with me … working on the LVIS instrument, there are five of us (including me). On the IceBridge mission, there are about 70 people, however, they are not all up here at once. On average there about 30 people in the IceBridge group in Greenland at one time during this mission. And out of all of those 70 people, only SIX are women!! Also on the entire Air Base in Thule, including contractors, natives, and Air Force people, there are only about 400 to 500 people, only about 75 are women! Oh and there are also children up here as well, most are the native Greenlandic children, but there are a few children who are visiting their mother or father who are stationed up here in the Air Force.

Students: Is it ever springtime there?

IceBridge: They do have all four seasons up here, however spring and fall are very very short compared to winter and summer. During the summer and winter there are about three months where they have either “24 daylight” or “24 nighttime.” And then for about a month before and after winter and summer, it is either quickly getting dark or quickly getting light. And then for around a month or so in fall and spring there is “normal sunlight time.”

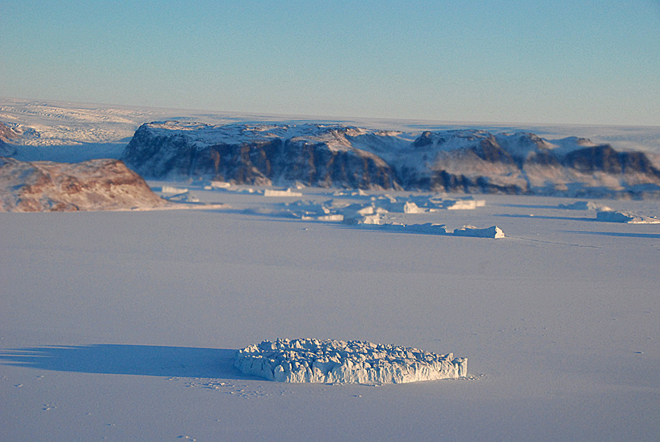
Students: Is that mountain made of ice?

IceBridge: No, Dundas Mountain is made out of rock and dirt, just like mountains we have in the United States. It is just surrounded by and topped with a lot of snow and ice this time of year. You can climb the mountain when it is warm enough, but it is a very hard climb. Toward the top there is even a rope to help you pull yourself up the rest of the way up the mountain because it becomes very steep!

Students: How tall is that mountain?

IceBridge: The mountain is about 700 feet high

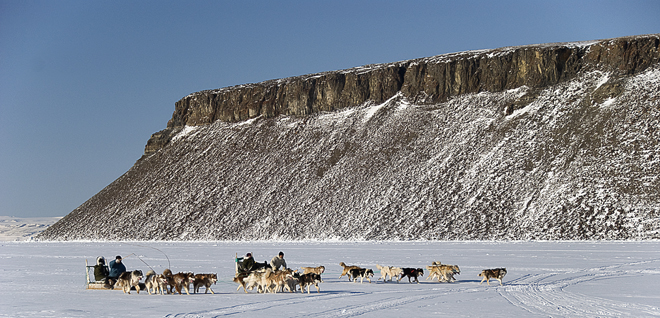
Sled dog race in Thule, Greenland, with Dundas Mountian in the background. Credit: Michael Studinger

Students: How far away from where you are standing is the mountain?

IceBridge: It is about 1.5 miles to Dundas Mountain from the GPS shack.

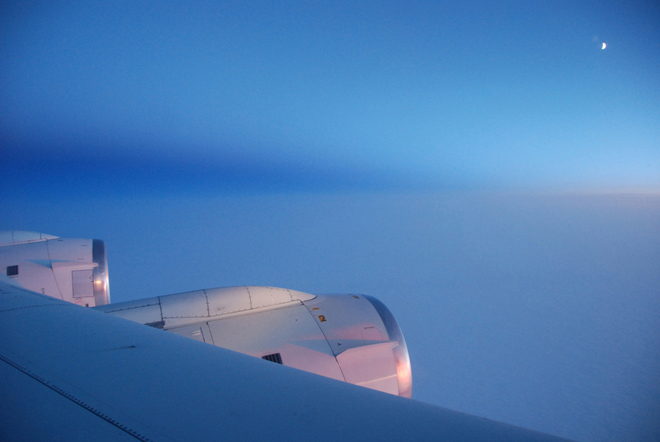
Students: Why does the sun look so big and so close to the Earth?

IceBridge: When celestial objects, like the sun and the moon, they get closer to the horizon and they “appear” bigger. However, this is just an optical illusion. The fact is that the illusion is dependent entirely on the visual cues provided by the terrain when the moon is near the horizon, and the lack of such cues when it’s at the zenith (directly above our heads). To prove this, try viewing the moon through a cardboard tube or a hole punched in a sheet of paper to mask out the landscape — the illusion disappears.

This time of year time of year the sun stays in the sky for almost 24 hours. Come April 17, the sun will not set here for the next three months. This is because of the way the Earth is tilted. Right now the Earth is tilting toward the sun, and because Greenland is just about at the top of the world, the Earth’s top always sees the sun. But something to note is that although the sun does not set for three months, the temperature still only reaches 60 degrees at its hottest!

Students: How do you make electricity?

IceBridge: There are several diesel generators that power the entire base. Also on the base are several cylindrical containers that hold the fuel for the airplanes that land and take off from this base. There used to be a lot more containers, but now that the base isn’t used as much as it was in the 1950s and 1960s, they have taken out these containers.


The IceBridge Routine

From: John Sonntag / ATM Senior Scientist and IceBridge Management Team

Working in the field with Operation IceBridge, we think that every day we fly is exciting. We’re soaring above the stupendous Greenland Ice Sheet, spectacular outlet glaciers, or ever-changing, always mesmerizing polar sea ice, after all. These are not the kinds of settings most people get to call their “office” every day. On top of that we’re making important contributions to knowledge about a part of our world which is important to the future of all mankind, with every mile we fly. It’s good stuff, a dream job for many of us.

But there is no denying that even the unique can become routine after a while. We are now more than three weeks into our deployment in Greenland. As I write this we are conducting our 11th flight of the campaign, part of a four-mission effort to survey the lower Northeast Greenland Ice Stream in unprecedented detail. And things are going smoothly and well. They are going so well, in fact, that many of the scientists and engineers are battling drowsiness as they monitor their instruments, and those who are off-duty are often napping.

University of Kansas snow radar engineer Ben “Blitzkrieg” Panzer monitors his instrument (well, we think). He’s not nearly as intimidating as he looks. Note the first-class airline-style seats, too. Every experimenter has one, and they’re comfy. Image is courtesy of John Sonntag.

We sometimes fly visitors on these flights, and occasionally they’ll express surprise to see so little apparently going on. There’s no chatter on the intercom system and not much movement aft of the flight deck (where I can assure you our flight crew is wide awake and probably chatting merrily). But some of us on board have years of experience with research flying, many hundreds of flights in my case, and we know and appreciate days like this. The lack of apparent activity indicates that nothing is going wrong! On board these flights, if you see a flurry of activity, people rushing around, or the like, it usually means something bad happened. It might be engineers rushing to replace a failed hard disk where science instrument data was being funneled. It could be that weather over the science target was poorer than expected, and we are scrambling to put together an alternate plan to deal with the situation. Or perhaps somebody’s lunch just boiled over in the microwave and made a mess.

But when things go smoothly, the appearance is one of calm, quiet, even boredom. The boredom is often real, believe me, especially 11 long flights into a campaign. But the instruments are still working and recording their data, the airplane is flying smoothly, and all is well in the Operation IceBridge world. I like days like this.


DC-8 data systems engineer Eric Buzay always looks productive. I’ve never seen this guy take a nap.Image is courtesy of John Sonntag.

Notes from the Shack: On Receivers and Data Processing

From: Colleen McIntosh, data analyst/programmer, Sigma Space/NASA’s Goddard Space Flight Center

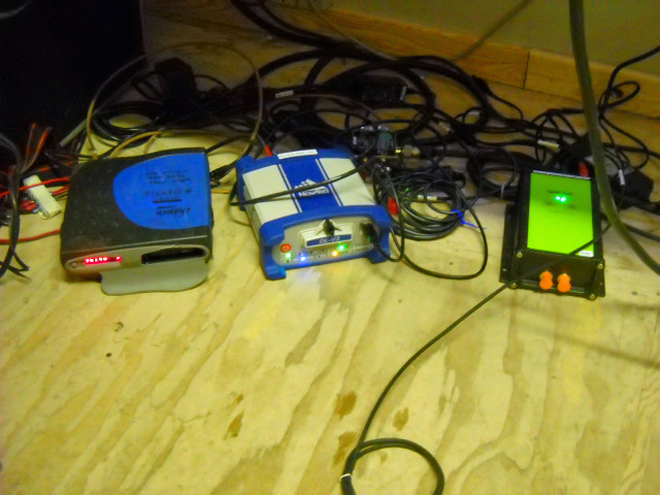
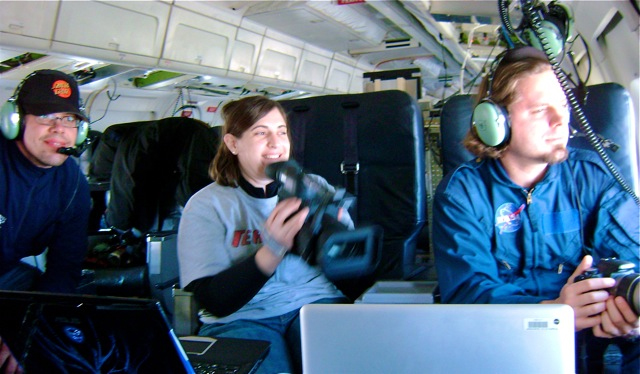
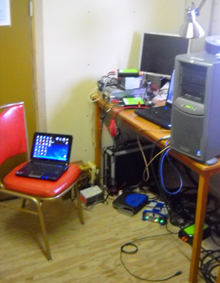
Staying on the ground as part of the GPS base station crew, there isn’t a whole lot to do as far as maintaining the receivers. The Land, Vegetation, and Ice Sensor (LVIS) team has three receivers, all different. We have a Javad which records data at 20 hertz, a Novatel which records data at 10 hertz and an Ashtech which records data at 2 hertz. These receivers are running all day every day.

Running receivers at different frequencies is somewhat of an experiment. The higher the frequency the more data points you get and, theoretically, the better the results. We are just testing that theory to figure out the best rate for LVIS.

I check on the receivers twice a day: once in the morning before the flight takes off, and then again an hour after the plane lands. The most important data, of course, is taken while the plane is in flight. The remaining data is used to get the most accurate position of our base station possible. Inside the collected data file are coordinates, which should be the same from day to day, but nothing is perfect, so they are slightly different. We take an average of the coordinates, and I use those values when processing the data.

It may seem that I only do something before and after the flight, but while the plane is in flight I process the data collected from previous days. The internet is rather slow up here, so sometimes processing can take some time.

Zachariae and 79 North

The IceBridge flight on Tuesday, March 30, marked the first of a four-flight series to measure the Zachariae and 79 North glaciers in northeast Greenland. The flight made six parallel passes up and down the uppermost, inland portion of the glaciers. The beds of these glaciers are below sea level, which has implications for how the glaciers interact with ocean water and how they lose ice. The planned part of the survey concluded early, so the crew decided on-the-fly to add two extra flight lines — one pass down the middle of each glacier. Jim Yungel, of NASA’s Wallops Flight Facility, captured a series of photos throughout the low-altitude flight:

The actual flight path, including two extra flight lines down the middle of the glaciers. 

Thule plow and sweeper clear the ramp and taxiway before the flight. Credit: Jim Yungel/NASA’s Wallops Flight Facility

Nunataks — hills or mountains encircled by a glacier — are seen among the ice. Credit: Jim Yungel/NASA’s Wallops Flight Facility

Glacial blocks are seen near Zachariae Glacier. Credit: Jim Yungel/NASA’s Wallops Flight Facility

A close up view shows details within glacial blocks seen near Zachariae Glacier. Credit: Jim Yungel/NASA’s Wallops Flight Facility

The science team and a NASA video producer watch the glacier. Credit: Jim Yungel/NASA’s Wallops Flight Facility

Preliminary data from the Airborne Topographic Mapper (ATM) show the topography around the Zachariae Glacier calving front region. The image contains preliminary data and is not for scientific analysis. Credit: Rob Russell/ATM team

NASA Readies for Spring 2010 Ice Bridge Campaign

From: Kathryn Hansen, Science Writer, NASA’s Earth Science News Team


Credit: John Sonntag/Wallops Flight Facility

In August 2008, NASA scientist John Sonntag, of NASA’s Wallops Flight Facility in Wallops Island, Va., captured this view of a small iceberg as it moved down the Narsarsuaq fjord in southern Greenland. “I spent about half an hour watching that little berg, which was in the process of disintegrating during the time I was watching,” Sonntag said. “It went from a complete, small berg to a collection of floating ice rubble within that small span of time. The place was so quiet that the noise of the berg softly coming apart was the only sound present.”

Sonntag’s observation took place during the 2008 NASA and Center for Remote Sensing of Ice Sheets (CReSIS) airborne deployment in Greenland. This spring, Sonntag and other scientists return to the Arctic for big picture and little picture views of the ice as part of NASA’s six-year Operation Ice Bridge mission — the largest airborne survey of Earth’s polar ice ever flown — now entering its second year. The project team is finalizing flight paths over Greenland’s ice sheet and surrounding sea ice, where scientists will collect measurements, maps and images from a suite of airborne instruments. Such information will help scientists extend the record of changes to the ice previously observed by NASA’s Ice, Cloud, and land Elevation Satellite (ICESat), while uncovering new details about land-water-ice dynamics.

NASA aircraft have made numerous science flights over Greenland, most recently during the spring 2009 Ice Bridge campaign and also in 2008 as part of the NASA/CReSIS deployment. Smaller-scale airborne surveys have been made by William Krabill, of NASA Wallops, and colleagues nearly every spring since 1991.

Visit the Operation Ice Bridge Web page throughout the spring 2010 campaign for news, images, and updates from the field. Flights from Greenland are scheduled to begin no sooner than March 22.


Welcome to the Start of the Operation IceBridge 2010 Campaign


From: Lora Koenig, IceBridge project scientist, NASA’s Goddard Space Flight Center


Credit: Image is courtesy of Lora Koenig, NASA’s Goddard Space flight Center

Hello, and welcome to the start of the Operation IceBridge Greenland 2010 campaign. Over the next few months we will be blogging about the science, research, aircraft, and day to day activities of our airborne campaign. The NASA DC-8 aircraft is fully loaded in Palmdale, Calif., and will take off late Sunday night to fly scientists, crew and instruments to Thule, Greenland. The DC-8 will stay in Greenland until the end of April at which time the NASA P-3B aircraft will take over for another month of flights monitoring the changes occurring over the Greenland ice sheet and the Arctic sea ice. Hopefully some of you are returning to the blog after our previous Greenland 2009 and Antarctic 2009 campaigns. Please check in often to follow our progress and learn more about our exciting Arctic research.

My name is Lora Koenig and I am a physical scientist in the Cryospheric Sciences Branch at NASA’s Goddard Space Flight center. You may be asking, what is cryospheric science? Well, it is the branch of science that studies the areas of frozen water on Earth. This includes science related to snow, sea ice, ice sheets, glaciers and permafrost. My research is focused on monitoring changes over the Greenland and Antarctic Ice Sheets and for the last five months I have been one of the NASA project scientists in charge of IceBridge. In this blog I will tell you a little about the planning that has gone on behind the scenes for this campaign.

For the last five months, starting while most of the IceBridge team was still in Antarctica, NASA started planning for the Greenland 2010 Campaign. Because the austral (Southern Hemisphere) spring and boreal (Northern Hemisphere) spring are only six months apart the IceBridge team is constantly planning for the next field campaign. Yes, the Antarctic 2010 campaign planning has already started and the DC-8 has yet to take off for Greenland.

What does planning for a major NASA airborne mission entail? Two things: logistics and flight line planning. A team at NASA’s Earth Science Project Office (ESPO) and the aircraft crews have been busily working to ensure that the instruments are ready to be loaded on the plane, flight clearances are in place, hangers are ready and sufficient for the planes to use, hotel reservations are made, airports are open, divert airports are nearby in case of bad weather, cargo is shipped, the science and instruments teams have flight reservations and passports, cold weather gear is assembled, food is available, internet is set up, and the list goes on and on. These behind the scenes logistics and preparation make for a successful field campaign.

While ESPO was dealing with the logistics, the IceBridge science team and I were tasked with planning flight lines. The Greenland ice sheet and the Arctic Ocean are large areas to monitor. Our aircraft cannot fly everywhere so the science community works together to decide where to fly, when to fly, and how often to fly. Flight decisions are made though a consensus process conducted by teleconferences and meetings with groups of scientists who specialize in studying sea ice, the Greenland ice sheet and ice sheet modeling. Most of the scientists are trying to answer one of the following questions: How are changes in the Greenland ice sheet affecting sea level rise? What changes are occurring to the Arctic sea ice extent and thickness? And in the future, what changes should we be preparing for as the Greenland ice sheet and Arctic sea ice cover change?

Each community of scientists requests specific areas where they want data, and each community desires a specific instrument to take their measurements. In many cases there is overlap in flight lines and instruments and in some cases there is not. Throughout this campaign you will hear about specific flights and the scientific reasons they were flown. Some flights will focus on sea ice, others will overfly glaciers that are changing rapidly and some will overfly scientist working on the ground so results can be extrapolated over a larger area. The IceBridge flight plans are designed to meet the needs of many within a limited amount of time. Flight line planning started in January and was just completed last week. John Sonntag, who you are sure to meet later in the campaign, is the master flight line designer and keeps the aircraft on track for making important scientific discoveries.

Well, I hope this gives you a bit of a flavor for the work that has been occurring by computer, phone and desk to get the Greenland 2010 Campaign up and flying. Next stop Thule, Greenland, with a transit flight that — weather dependant — was designed to monitor a small portion of the southeast Alaskan glaciers and the Arctic sea ice on a transect across the Arctic Ocean.

Operation IceBridge Off to a Successful Start in Greenland

From: Michael Studinger, IceBridge project scientist, Goddard Earth Science and Technology Center at the University of Maryland

Hello and a warm welcome to all blog readers from the IceBridge team here at Thule Air Base in northern Greenland. After taking off on Sunday night from NASA Dryden’s Aircraft Operations Facility in Palmdale, Calif., the NASA DC-8 arrived at Thule Airbase on Monday afternoon. Both the aircraft and science teams have done an incredible job in setting up operations in record time here in Thule. 


The moon and sunrise are visible over the Arctic Ocean during the flight from Palmdale, Calif., to Thule, Greenland. Credit: Michael Studinger

We were able to take off for an eight-hour science flight on Tuesday morning to survey the sea ice in the Arctic Ocean north of Ellesmere Island. Wednesday’s science flight was targeted at several glaciers north of Thule. Some of the glaciers have been surveyed for the first time last year and we are back this year to monitor the changes that have occurred since last spring. We begin the day with flying over a small glacier called Heilprin Glacier. We are very early in the season and the sun is just above the horizon in the morning hours, illuminating the coast of Greenland with its frozen fjords, icebergs and glaciers in a beautiful light. 


The sun is very low and only barely above the horizon at the beginning of the third science flight, creating beautiful illumination of the cost of Greenland with its frozen fjords, icebergs and glaciers. Credit: Michael Studinger

After an hour of flying we begin to fly a grid pattern in the catchment area of Petermann Glacier to measure the thickness of the ice with a radar system from the University of Kansas. These data will be used as input for computer models that will allow us to better predict how the Greenland ice sheet will respond to environmental changes in the Arctic.

We continue our flight by repeating two survey lines along Petermann Glacier that have been surveyed several years before. The scenery with the steep sidewalls is spectacular. We can see huge meltwater channels on the surface that will be filled with water running down the glacier when the Arctic melt season starts in a few months. 


The IceBridge crew fly down Petermann Glacier in northern Greenland with NASA’s DC-8 aircraft. Credit: Michael Studinger

After completing the flight lines over the Petermann Glacier we turn back towards Thule Air Base and measure the ice surface elevation with a laser altimeter along a track that has been measured many times by NASA’s ICESat satellite. We are heading back to Thule Airbase to land before the tower and airfield close for the day. 


At the end of a day of glacier flying, Dundas Mountain — a major Greenland landmark — can be seen during the approach to Thule Air Base. Credit: Michael Studinger

We have had an incredibly successful start of the 2010 Arctic campaign. We have been able to collect LVIS laser data along the transit from California to Greenland and have been flying 3 days in a row collecting huge amounts of data. A storm system here in Thule has forced us today to stay on the ground and everyone is catching up with sleep and data processing. With a little bit of luck we hope to fly the DC-8 again on Friday. Thanks to all the aircraft and science teams, the staff at Thule Air Base, and many people back home who have made such an incredible start of the IceBridge 2010 campaign possible!


Inside the DC-8: Instrument Test Flight


From: Nick Frearson, Gravimeter Instrument Team, Lamont-Doherty Earth Observatory


The flight engineer ticks off instruments over the intercom. “LVIS, ready.” “Gravity, ready.” “DACOM, ready.”


We are about to take the DC-8 on its first test flight before Antarctica. The pilots, clipped and professional, have just described the day’s flight plans and the plane is bustling with people making last-minute adjustments.


Suddenly we are ready to go. The city of Palmdale, Calif., drops away as the plane climbs and circles. The dried up lake bed that is home to Dryden and Edwards Air Force Base spreads out below, giving us a Google-Earth view of the area.


We head west over the hills and Los Angeles, indistinct through the haze, and out over the Pacific Ocean. The gravimeter in front of me and Stefan purrs quietly. The aim of the flight is to test and calibrate the laser altimeter – the Laser Vegetation Imaging Sensor (LVIS) – which will measure the surface elevation of the ice sheet.


At 28,000 feet we perform a series of maneuvers to sweep the laser beam back and forth beneath the aircraft. The LVIS engineer is talking to the flight engineer over the intercom while he aligns the instrument. I can hear static, whistles and pops over their voices but nothing that appears to be interfering with our instruments.


To my left an instrument samples the air as we fly along. Melissa, who built the equipment a few days ago, watches pressure gauges and tweaks the dials. Outside, I can see Catalina Island surrounded by clear water. The LVIS engineer announces that he is happy with the laser so we turn for home.


We pass over the smog of L.A., mountains still scarred from the recent forest fires, and the Mojave Desert, where the clear air allows you to see for miles. Back on the ground we head for flight debrief.


Sean downloads the gravity and GPS data that will tell us how well the gravimeter performed. First indications are looking good.