By Michael Studinger, IceBridge Project Scientist, NASA Goddard Space Flight Center/UMBC
Wallops Flight Facility, Wallops Island, VA – Welcome to the fourth annual Arctic campaign with NASA’s Operation IceBridge. Over 75 days, we will collect data with two aircraft over the Greenland Ice Sheet, the Arctic Ocean and the Canadian ice caps. We will be based in Kangerlussuaq and Thule Airbase in Greenland, and in Fairbanks, Alaska for sea ice flights over the Beaufort Sea.
During the past several weeks, Operation IceBridge teams have worked at NASA’s Wallops Flight Facility on the eastern shore of Virginia, installing cutting-edge laser altimeters and extremely sensitive radars that will allow us to measure changes in sea ice thickness in the Arctic Ocean. We will also be monitoring changes in the thickness of ice sheets and glaciers that cover most of the subcontinent of Greenland and the Canadian Arctic Archipelago. We will start our campaign with NASA’s P-3B Orion research aircraft from Wallops at Thule Airbase in northern Greenland with sea ice missions over the Arctic Ocean. The extent and thickness of the sea ice cover in the Arctic Ocean is declining quickly and we are there to take measurements that document this change from year to year. The second plane in this year’s Artic campaign, a Falcon HU-25 jet operated by NASA’s Langley Research Center in Hampton, Va., will join the campaign later in April carrying the Land, Vegetation, and Ice Sensor (LVIS), a high-altitude laser altimeter capable of measuring a 2-km-wide (1.2-mile-wide) swath.

The P-3B aircraft inside the hangar at NASA’s Wallops Flight Facility in Virginia. Credit: Michael Studinger.
Before we can start collecting data over the Artic we have to make sure that all installed sensors on the P-3 work and are calibrated. In order to make extremely precise laser altimeter measurements of the ice surface elevation we calibrate the instruments using target sites at the Wallops Flight Facility that we have surveyed on the ground. A second test flight takes us out over the Atlantic Ocean, some 200 miles away from the coast, where we can switch on the radar systems from the Center for Remote Sensing of Ice Sheets (CReSIS) at the University of Kansas, without interfering with other systems. We use the radar signal that is bouncing back from the ocean surface to calibrate the radars. We also did a couple of maneuvers at high-altitude over the Atlantic to calibrate the antennas of the ice-penetrating radar systems that we will use to survey the sea ice, glaciers and ice sheets.
Research flying has little in common with everyday air travel. One of the maneuvers that we do during the test flights is to fly the aircraft at a 90° roll angle with the wings perpendicular to the horizon. Fasten your seat belts! You will (hopefully) never experience something like this on a commercial flight.

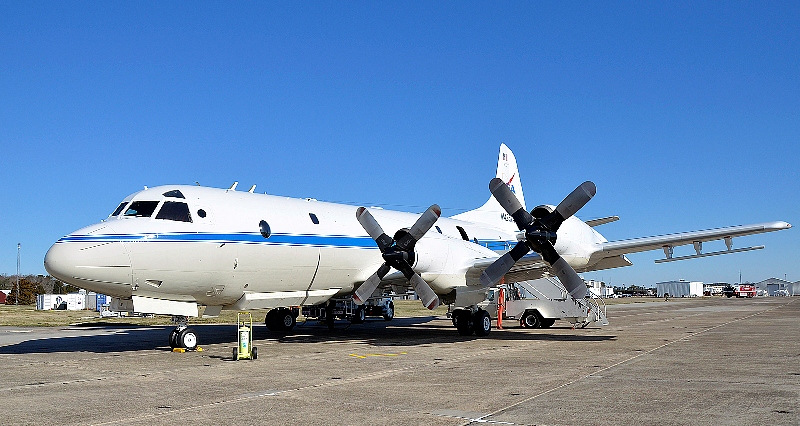
The P-3B on the ramp before a test flight. The antennas of the ice-penetrating radar system can be seen mounted under the wings. Credit: Michael Studinger.
We are collaborating with other experiments such as CryoVEx, the CryoSat-2 calibration and validation campaign from the European Space Agency. We will also work closely together with teams that work on the ground and take measurements over sea ice in the Arctic Ocean, and do coordinated flights with an ER-2 high-altitude aircraft from NASA’s Dryden Flight Research Center in Edwards, Calif. The ER-2, a civilian research version of the Air Force’s U-2 , will carry the Multiple Altimeter Beam Experimental Lidar (MABEL). The ER-2 will fly out of Keflavik, Iceland, and climb to 60,000 feet on its way to Greenland to measure the same tracks as the P-3B Orion.
We have now completed all our test flights here at Wallops and are ready to go to Greenland where we hope to map much of the sea ice cover over the Arctic Ocean and the Greenland Ice Sheet.


