By Maria-Jose Viñas, Cryospheric Sciences Laboratory Outreach Coordinator, NASA Goddard Space Flight Center
Michael Studinger is Operation IceBridge’s project scientist. He trained as a geophysicist in Germany, his home country, before moving to the U.S. to take a position at the Lamont-Doherty Earth Observatory and then transferring to NASA Goddard Space Flight Center in 2010. Studinger has been studying polar regions for 18 years, expanding his initial focus on the geology and tectonics of the Antarctic continent to the overall dynamic of polar ice sheets.
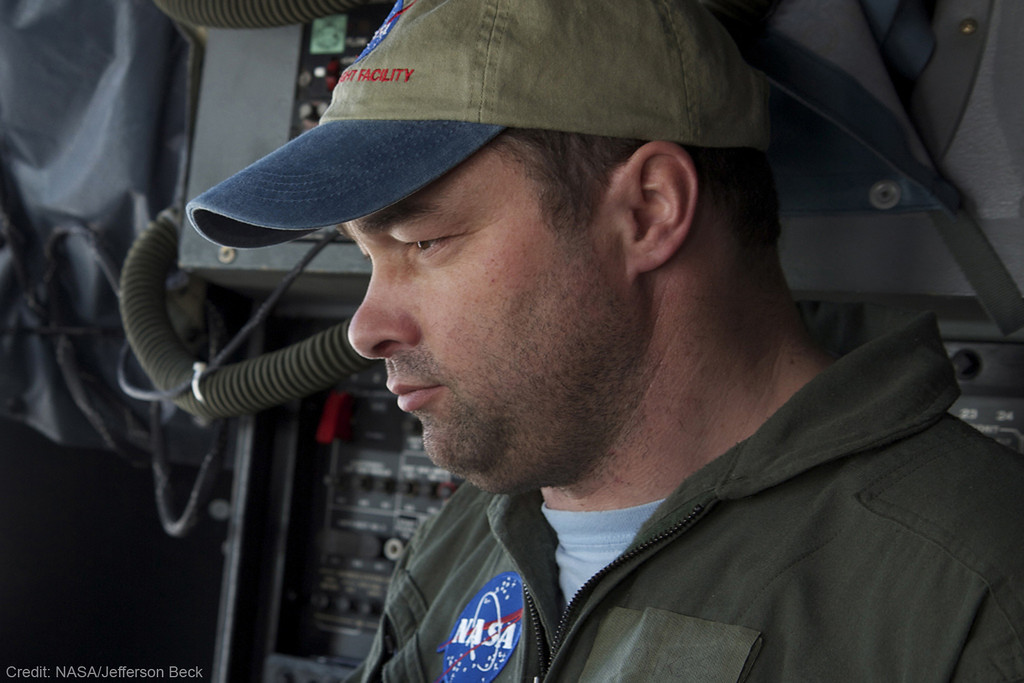
Operation IceBridge Project Scientist Michael Studinger. Credit: Jefferson Beck / NASA
Studinger recently returned from Greenland, where he was leading Operation IceBridge’s 2012 Arctic campaign.
This was IceBridge’s fourth Arctic campaign. How different was it from previous years?
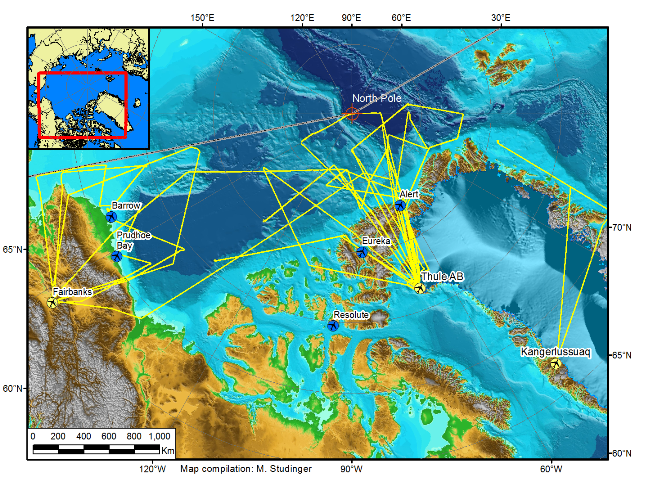
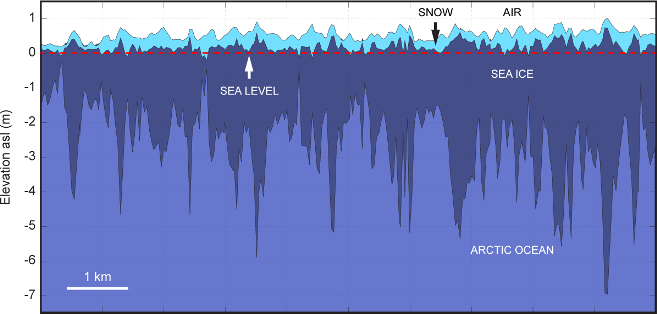
We flew more than last year: During the 75 days we were there, we only had to cancel a single flight because of weather, something I’ve never seen before. Regarding sea ice, we have expanded coverage in terms of area. For the first time we went to the Chukchi and Beaufort Seas to collect data there. But the biggest change this year is that we published a new data product that we had to deliver to the National Snow and Ice Data Center before we even returned from the field. This product is being used by modelers and other scientists to make a better prediction of the annual sea ice minimum in the summer. We can now feed ice thickness measurements from March and early April into these predictions and see how they improve them.
What are the benefits of improving Arctic sea ice minimum predictions?
There seems to be enough people who have an interest in finding out how thick or thin the sea ice will be. People who live in the Arctic and shipping companies…they want to know, they want to prepare. It’s like long-range weather forecast: People who grow crops would like to know if they’re going to get a wet season or a dry season.
Also, it’s a relatively short-term prediction, so we’ll soon find out if the models are working or not. It helps building better models because you can compare the results to the reality in a few months.
This Arctic campaign, you teamed up with CryoVEx, ESA’s calibration and validation campaign for the CryoSat-2 satellite. How did it go?
We did two coordinated flights with them. We were in Thule, Greenland, and they were in Alert, Canada. We both took off at the same time and made sure we were over the same point in the Arctic Ocean with CryoSat-2 flying overhead. It was quite a bit of a coordination effort. We measured the same spot along the satellite track within a few hours. The CryoVEx team has instruments similar to ours, but also some that we don’t have. IceBridge has unique instrument suite for sea ice that includes the world’s only airborne snow radar. By combining all the data from all the instruments, we can learn a lot about what each instrument is seeing and what CryoSat-2 is actually measuring over sea ice.
How’s your average Arctic campaign?
We start in Thule because we want to get the sea ice flights out of the way early on, as long as it’s cold over the Arctic Ocean. It’s still fairly dark there, that far north [Thule is 750 miles north of the Arctic Circle]. We have just enough light in the second half of March to fly the sea ice missions, during the first three weeks of the campaign. Then we go down to central Greenland while it’s still cold there and start doing ice sheet flights, for three or four weeks. Then we go back to Thule because it’s getting too warm in southern Greenland, and we finish the ice sheet flights in the northern half.
Can you describe your daily routine while in Greenland?
We get up at 5 a.m. In Kangerlussuaq, we try to be in the air at 8:30, and in Thule we try to be flying at 8, when the airport opens. Eight hours later, we land. After that, we have a science meeting where we talk about how the flight went and the plan for the following day. Then we eat dinner, check email, look at data… all that before we go to bed and do it all over again the next day.
How do Arctic and Antarctic campaigns differ?
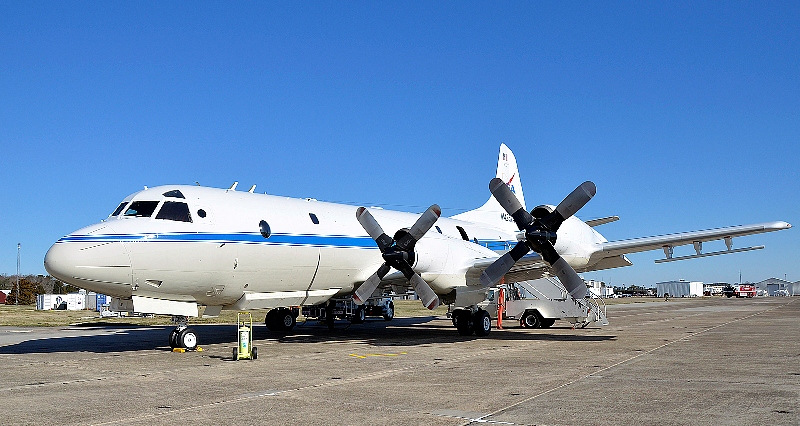
We use different aircraft: a P-3B for the Arctic and a DC-8 for Antarctica. In Greenland, when we fly out of Kangerlussuaq or Thule, we start collecting data pretty much right away, except for the sea ice missions. In Antarctica, we “commute” from Punta Arenas in southern Chile, which takes a few hours. Then we can only collect data for a few hours before we go back home to Punta Arenas. Typically, in the DC-8 we fly for 11 to 11.5 hours, much longer than the about 8 hours of flight with the P-3.
We actually fly more instruments on the P-3: the accumulation radar and the magnetometer (which is much easier to install on the P-3 than on the DC-8). We don’t really have the room in the fuselage to mount the accumulation radar antennas and there’s not really much of a need to use it in Antarctica. The snow accumulation in Greenland is higher. We can actually see annual layers with the accumulation radar but it’d be far more difficult in Antarctica because less snow falls there.
Personally, do you prefer one campaign to the other?
No, they’re just different. It’s a different airplane: the DC-8 is much more comfortable, less noisy. You don’t have the vibration of the P-3, so you can actually get a lot of work done on the transit flights. But the flights are very long.
And scientifically, is one campaign more interesting than the other?
Not for me. Most of my work I’ve done in Antarctica, but I’m getting more and more interested in what Greenland has to tell us. If you look at the two biggest glaciers we study, Jakobshavn Isbrae in Greenland and Pine Island Glacier in Antarctica, the kind of mechanism through which both glaciers are losing ice is similar — warm ocean water is melting the ice from underneath. So we’re studying similar processes. Antarctica is far more challenging to get there and collect data, but from a scientific point we need to do both, otherwise we’re missing part of the picture.
What’s the 2012 Antarctic campaign going to look like?
It’s going to be shorter for a number of reasons, mostly because the aircraft has already been committed for an international multi-aircraft experiment in Thailand, and it’s also committed afterward. We’ll try to fly as much as we can, we’ll be using two aircraft: a G-V from the National Science Foundation, flying at high altitude, and NASA’s DC-8 flying low.
What will the future bring for IceBridge?
The plan is we will start using unmanned aerial vehicles and we’ll probably be doing it mostly over sea ice in the Arctic Ocean, but we don’t know the details yet. We will be doing some test flights over the Arctic Ocean later this year with the Global Hawk, either with the radar or laser altimeter onboard. I don’t think we can replace manned aircraft completely over the course of IceBridge.
After ICESat-2 launches, will IceBridge continue to some extent?
There will always be airborne campaigns to some degree, because there are some datasets that we can only collect from planes, and we will also need to calibrate and validate the satellite data. We need a variety of different scales, wavelengths, different types of measurements in order to really answer the science questions that we have, such as what is the contribution of Greenland to sea level rise in the next 20 or 30 years. For example, if we only have ICESat-2 collecting measurements of how the surface elevation is changing, we’ll know a lot, but we’ll never be able to answer with certainty what is causing these changes. It’s almost like you’re taking the pulse of a patient; you’re only looking at the symptoms of the illness without understanding what’s causing it. In order to find out why the ice sheet is changing its surface, we need to understand what’s beneath the ice sheet because that’s what’s driving a lot of the dynamic changes. And those are datasets that you can’t collect from space, you need an airplane to go in there and get the greater picture of what’s below there and other things, like snow accumulation, which can be done much better from airplane. It’s not a single satellite that will provide us the answer, not a single airborne measurement – it all has to come together.
A Spanish version of this post is available on National Public Radio’s Science Friday blog.

