IceBridge Over the Desert

By Claire Saravia, NASA Goddard Space Flight Center Office of Communications


Before the instruments aboard NASA’s Operation IceBridge fly over Antarctica in October to collect polar ice data, they will be tested over an unlikely ice substitute: a series of sites in the Mojave Desert.

The instruments that are part of IceBridge—a six-year flight mission designed to study ice at the Earth’s poles and bridge the gap between the two ICESat missions —are put through test flights every year to ensure they’re functioning properly.

This year, instruments like the Airborne Topographic Mapper (ATM) will use three separate sites in the California desert as a dress rehearsal for one of the real mission flights.

View of the Mojave Desert from the DC-8
View of the Mojave Desert from the DC-8. Credit: NASA/J. Yungel

While it might seem counterintuitive to use a desert to simulate land filled with ice, ATM scientist John Sonntag said the area’s land features and reflective sand produce a similar landscape.

“The variety of terrain and surface reflectance over these lines will allow us to adjust the ATM for a wide variety of targets, thus increasing the reliability of the system once we get over Antarctica,” Sonntag said.

The IceBridge mission scientists aren’t the first to use the dry, sandy area to portray its icy counterpart. Sonntag said the test flight would be using some of the same tracks used during test flights of the ICESat mission as a way to compare measurements.

“We continue to overfly these tracks as part of ATM calibrations because we can compare the results with over flights of those same targets in previous years,” Sonntag said. “These comparisons will allow us to adjust the calibration parameters of the ATM with great precision.”

One of the desert features that will be used in the test flight is the El Mirage dry lake, which Sonntag said is frequently featured as a scenic backdrop in both movies and car commercials.

“El Mirage is a nearly ideal site for doing these laser calibrations because it is large, relatively flat, completely unobstructed by overhead features such as power lines and light poles, and has a bright laser reflectance similar to snow and ice,” Sonntag said.

The El Mirage dry lake in the Mojave Desert
The El Mirage dry lake in the Mojave Desert. Credit: NASA/J. Yungel

While it would be more ideal to use actual snowy surfaces to test the instruments, ATM program manager James Yungel said the easy access to sand regions outside both the NASA Wallops Flight Facility and the Dryden Flight Research Center made it the next best thing.

“Finding snow near Wallops or Dryden when we install on the aircraft can be difficult, but both NASA home airports have sand beaches or sand desert regions that are fairly close to snow reflectivity,” Yungel said. “These sandy sites allow us to tune the ATM systems for actual snow targets.”

IceBridge project scientist Michael Studinger said the fact that the scientists know the desert sites well makes them a popular spot for adjusting the instruments to measure ice.

“This is necessary so that we can collect high quality data over unknown targets like the Antarctic ice sheet and be confident that we have an extremely precise measurement of the ice surface elevation,” Studinger said. “It’s not about the precise location, but calibrating the radar for the signal that is transmitted from the antennas and then reflected back from the layers in the ice sheet and glaciers.”

IceBridge conducted two equipment checkout flights, one over the Pacific Ocean on Oct. 2 and one over the Mojave Desert on Oct. 3. The IceBridge Antarctic campaign is scheduled to begin with its first science flight on or about Oct. 11, 2012.

Weather and Operation IceBridge

By John Sonntag, OIB Instrument Team Lead, NASA

If you know the saying “make hay while the sun shines”, you’ve already got a pretty good idea of how weather affects flight operations for Operation IceBridge. Generally speaking, our flights require clear skies over the area in which we are operating on any given day. There are two good reasons for this. First, some of our sensors, including the Airborne Topographic Mapper and the Digital Mapping System, are optical instruments and need the sky between the aircraft and the ground to be cloud-free to obtain their measurements. Second, since we usually fly low and close to terrain (and sometimes amongst mountain peaks), our pilots need clear skies in order to see and avoid the terrain for flight safety reasons. These requirements mean that weather largely governs what we do on any given day, and makes it necessary for OIB project scientist Michael Studinger and myself to remain immersed in the minutiae of polar weather every day while we are in the field. On every potential flight day, we must make a decision about whether to fly and where to fly, and if we make the wrong decision we might face the mortifying prospect of returning from an expensive taxpayer-funded flight without science data to show for it. So far in the 3-year history of OIB, that has not happened, and Michael and I very much want to maintain that record.

Michael and I typically start studying the current weather patterns governing our operating areas at least a week prior to our deployment. It is helpful to develop a sense of context and a feeling for the current weather systems and their movements before we must begin making decisions on flight days. Our primary tools for this, and for all of our weather analysis tasks, are satellite imagery in several wavelengths, meteorological forecast models and point observations of current weather conditions from observers on the ground.
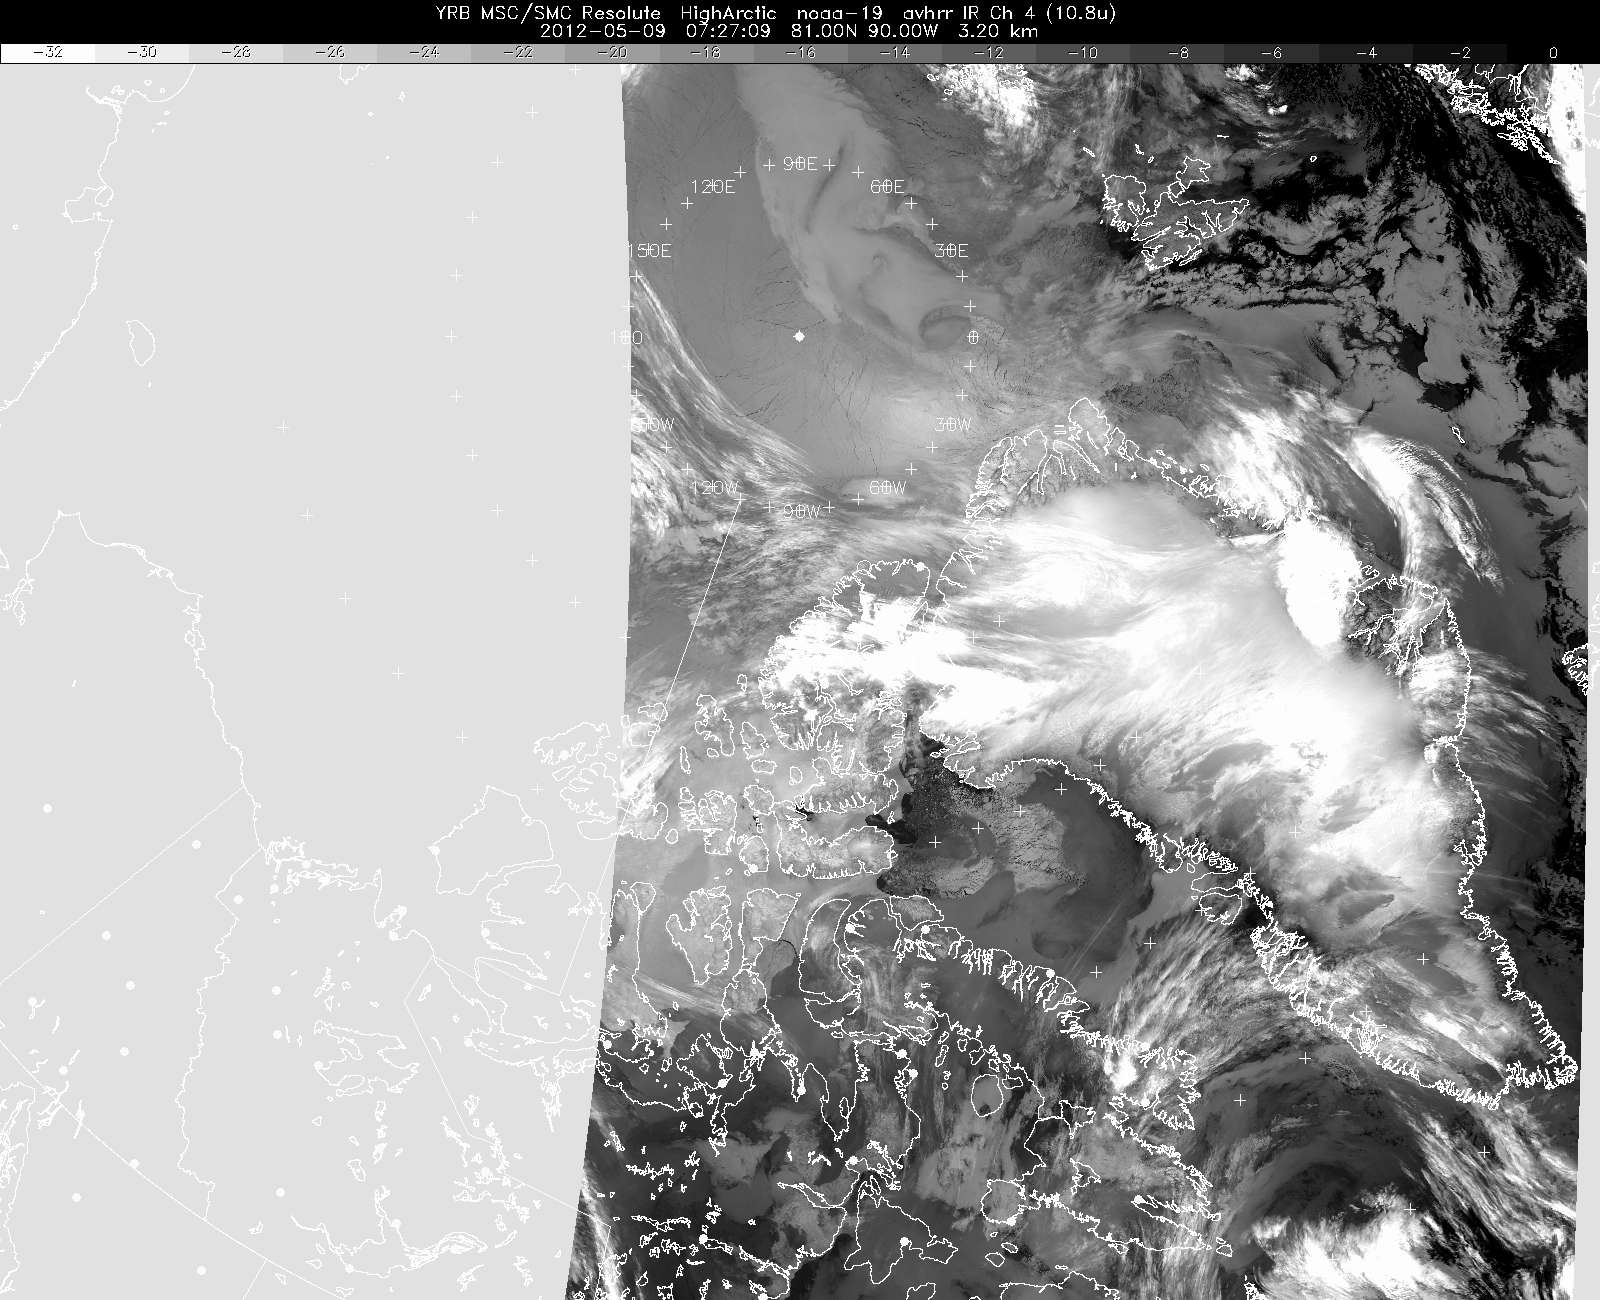
An early morning weather satellite image of Greenland and Arctic Canada, taken on 9 May 2012.

An early morning weather satellite image of Greenland and Arctic Canada, taken on 9 May 2012. This image is an infrared image from a NOAA polar orbiter, and while it shows significant cloud cover at several altitudes over western Greenland, we chose to fly a mission along a narrow corridor along the northwest coast of Greenland where the weather was clear. Credit: NOAA

Satellite imagery, most of which is provided by NOAA polar-orbiting satellites in our case, gives us a snapshot of the clouds over an area of interest. Imagery in the infrared band shows us not only the extent of the clouds over an area but also suggests the altitude of the cloud tops, since the infrared band is sensitive to temperature, and cloud temperatures are dependent on their altitude. Basically, bright white clouds are high, gray clouds are medium or low, and ground fog can sometimes be almost indistinguishable from the ice surface as their temperatures are similar. Visible imagery is better at showing us texture, which helps us distinguish between ice surface and fog, estimate the thickness and density of the cloud cover and determine the distance between cloud bases and the terrain beneath by virtue of the shadow they cast on the surface, especially when the sun angle is low. Another type of imagery we sometimes use is known as the “3 micron” band for its wavelength. This type is particularly sensitive to the amount of water vapor present in cloud masses.

We often refer to ground observations to help us refine our interpretation of satellite imagery, primarily because they provide a reliable measurement of the distance between the ground and the cloud bases. Sometimes the clouds are high enough and the terrain sufficiently benign that we are able to fly below the cloud bases, and point observations occasionally allow us to make such a judgment with some confidence we might not otherwise have. We must be careful, however, to remember that these observations are valid at one point only, while our flights cover large distances.

But for forecasting weather into the future, we are highly dependent on computer meteorological models, which predict what the weather may be like later in a day, or into the next day or beyond. Such information is critical for planning and optimizing our flight selections. For example, we might examine satellite imagery early on a potential flight morning and conclude the weather over our target is clear, but if a forecast model shows that the weather there will deteriorate by mid-day we would probably choose not to fly there. Sometimes the reverse occurs, where morning imagery might show marginal conditions over a target area but the forecast models confidently predict quick improvement. In such a case we might choose to launch a flight into the area, if our confidence in the model predictions is sufficient.

A typical flight day for me (and probably Michael as well) literally starts with weather as soon as I roll out of bed. The first thing I do every morning, even before brushing my teeth, is to open up my laptop and download a few satellite images to get a sense of cloud cover. That way I can mull it over while I get showered and into my flight suit and have breakfast. After breakfast, Michael and I, and our pilots, head to the local airport’s weather office to get their take on the weather where we are going. I cannot stress enough the importance we place on our discussions with these professional meteorologists, nor can I praise them enough for the help they invariably give us. Most of them seem to genuinely enjoy the professional challenge we bring to them, since the kind of flying we do, and the weather we are dependent on, are so different from those of the flight crews they normally deal with. In this morning weather briefing, we go over everything they have available, including satellite imagery, model predictions, point observations, and their own professional and experientially-derived “feel” for the conditions. Once we have gathered all the information available, it is decision time. We always remember that when we launch a flight, we are committing the U.S. taxpayer to pay many thousands of dollars to operate a big, expensive aircraft that day. So we take this decision very seriously, and at times it can be a rather nerve-wracking process.

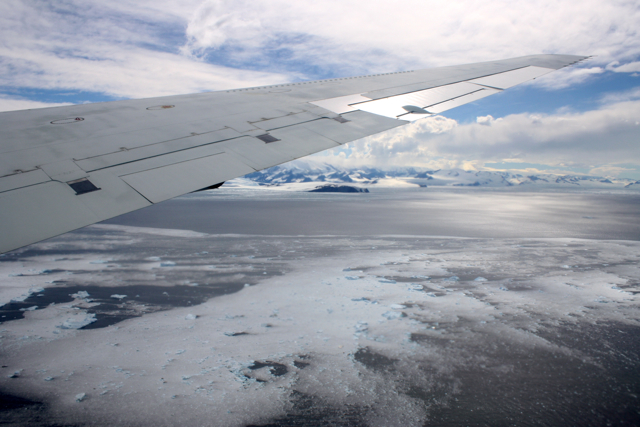
Icebergs in a northwest Greenland fjord shrouded in fog.

Icebergs in a northwest Greenland fjord shrouded in fog. Credit: NASA/Jim Yungel.

Once in the air we constantly monitor the weather to see if it was as we expected, based on the morning weather briefing. It usually is, though the exact locations of cloud boundaries and ceilings are sometimes slightly different from what was predicted, and occasionally ground fog might exist where we did not expect it. We find that ground fog is consistently the most difficult aspect of polar weather to predict, although it has never adversely affected a flight to a serious degree. We also monitor the winds and compare these to the forecasts, which is important because winds can create turbulence under certain conditions, and turbulence can create a variety of problems for us.

Once we land, Michael and I immediately head back to weather office to get a forecast for the next day. Next, based on what I heard at this post-flight briefing and on further information I obtain from the internet, I prepare a weather briefing for the entire field team, which I give at our nightly science meeting. This briefing usually has two parts. First is a quick retrospective analysis of the day’s mission, comparing the weather we expected with what we actually encountered. Doing this on a daily basis helps us fine-tune our understanding of the performance of various weather models, our interpretation of imagery and our general decision-making process. Next I give an overview of our expectation of the next day’s weather and which flights might be best-suited for it. This enables the flight crew and the instrument operators to prepare for the next day’s activities.

The next morning, the process starts all over again. By the time we end a long deployment (the current one will be 11 weeks long), I look forward to spending entire days without looking at a weather image. But to be honest, I am at heart a weather geek, and after being back home for a while I miss the sense of connectedness I had to the natural world from remaining so immersed in meteorology for such a long time.

I have found that the key to successful weather-based decision-making is to consult as wide a variety of sources as possible, diligently calibrate oneself to the strengths and shortcomings of all weather models and other sources of data, and probably most importantly, simply stay on top of the weather situation multiple times each day. By doing this we can develop an almost intuitive sense for the evolving weather regime, which helps us quickly digest new information and interpret it correctly. Finally, I think it’s important to cultivate a sense of humility with regards to weather forecasting. Meteorology is a complex business and there is much we do not know. This is particularly true in the polar regions, because in contrast to places such as the continental US, the measurements that feed weather prediction tools are extremely sparse. In practice this sense of humility translates into keeping an open mind about the weather, avoiding coming to hasty conclusions before consulting every possible source and having contingency plans ready in case things do not work out exactly as we thought.

Rollercoaster of Opportunity

From Kathryn Hansen, NASA’s Earth Science News Team, Goddard Space Flight Center

Nov. 13, 2010

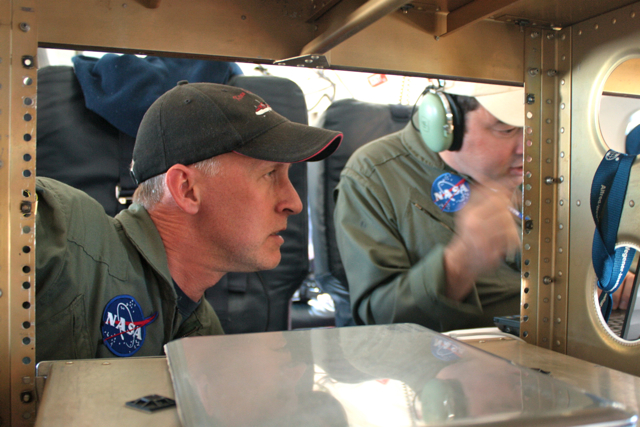
John Sonntag (left), of NASA’s Wallops Flight Facility/URS, and Michael Studinger (right), of NASA’s Goddard Space Flight Center/UMBC, evaluate the Peninsula mission on the fly. Credit: NASA/Kathryn Hansen

PUNTA ARENAS, Chile — Friday evening, IceBridge teams gathered in the hotel conference room to discuss logistics for upcoming flights. First up: weather. The audience watched the animated WRF model, a tool used for flight planning because it tells you what the weather will be like in the next 6-12 hours. On this particular morning, the model showed system after system lined up to pummel Antarctica. “Are we sure this isn’t the WTF model?” a scientists inquired.

Saturday morning, scientist and flight planner John Sonntag arrived at the airport offices with the flight decision. Weather conditions weren’t perfect, but were the best the Antarctic Peninsula had seen in a month. Given that it had been a few days since the last flight and the forecast looked to only worsen in the days ahead, mission planners decided to take the opportunity to fly under the cloud ceiling. The model predicted clear skies below 10,000 feet. “I hope they’re right,” Sonntag said.

The flight planners quickly worked up a modified version of the “Pen 23” flight plan and at 9:23 we took off for the Peninsula.

The DC-8 approaches the Antarctic Peninsula. Credit: NASA/Kathryn Hansen

We flew the planned route backward, hitting northern cloud-free regions first. Heading south, we followed the eastern side the “spine” — the crest of a mountain range that extends down the middle of the Peninsula. Unfortunately for stomachs, the spine influences weather patterns and the east side also happened to be the windy, turbulent side. The DC-8 may need to restock the little white bags!

Stomachs also suffered from the dramatic changes in altitude necessary to collect data. The measurements require a relatively consistent altitude, which can be tricky when accessing a glacier behind a rock cliff. But the pilots deftly handled the 7,000-foot-roller coaster flight line to collect data over targets also surveyed during the 2009 campaign.
Glaciers meander through the rocky terrain of the Antarctic Peninsula (right). Credit: NASA/Kathryn Hansen

Targets flown: Hektoria, Drygalski, Crane, Flask and Leppard. Each of these glaciers drain into the Larsen A and B ice shelves which broke apart in 1995 and 2002, respectively. Attlee, Hermes, Lurabee and Clifford. Each of these glaciers drains into Larsen C, which is still intact.

So what? Like a cork in a bottle, ice sheets can plug the neck of a glacier. Remove that ice shelf and the glacier more freely dumps ice into the ocean. Scientists want to keep an eye on how these glaciers continue to respond years and decades after the loss of the shelves. Crane, for example, which feeds into the remnant of Larsen B, shows little sign of slowing down.

Cruising further south, however, we encountered too many clouds so we cut across to the west side of the spine to check out the Fleming Ice Shelf. Clouds there also proved too dense, however, so we turned north back to Punta Arenas. At 8.4 hours, the modified Pen 23 became the shortest flight of the campaign — to the relief of many yellow-faced passengers.

The IceBridge Routine

From: John Sonntag / ATM Senior Scientist and IceBridge Management Team

Working in the field with Operation IceBridge, we think that every day we fly is exciting. We’re soaring above the stupendous Greenland Ice Sheet, spectacular outlet glaciers, or ever-changing, always mesmerizing polar sea ice, after all. These are not the kinds of settings most people get to call their “office” every day. On top of that we’re making important contributions to knowledge about a part of our world which is important to the future of all mankind, with every mile we fly. It’s good stuff, a dream job for many of us.

But there is no denying that even the unique can become routine after a while. We are now more than three weeks into our deployment in Greenland. As I write this we are conducting our 11th flight of the campaign, part of a four-mission effort to survey the lower Northeast Greenland Ice Stream in unprecedented detail. And things are going smoothly and well. They are going so well, in fact, that many of the scientists and engineers are battling drowsiness as they monitor their instruments, and those who are off-duty are often napping.

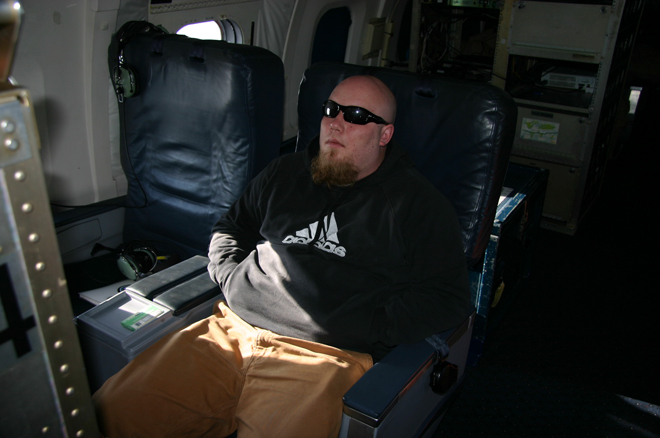
University of Kansas snow radar engineer Ben “Blitzkrieg” Panzer monitors his instrument (well, we think). He’s not nearly as intimidating as he looks. Note the first-class airline-style seats, too. Every experimenter has one, and they’re comfy. Image is courtesy of John Sonntag.

We sometimes fly visitors on these flights, and occasionally they’ll express surprise to see so little apparently going on. There’s no chatter on the intercom system and not much movement aft of the flight deck (where I can assure you our flight crew is wide awake and probably chatting merrily). But some of us on board have years of experience with research flying, many hundreds of flights in my case, and we know and appreciate days like this. The lack of apparent activity indicates that nothing is going wrong! On board these flights, if you see a flurry of activity, people rushing around, or the like, it usually means something bad happened. It might be engineers rushing to replace a failed hard disk where science instrument data was being funneled. It could be that weather over the science target was poorer than expected, and we are scrambling to put together an alternate plan to deal with the situation. Or perhaps somebody’s lunch just boiled over in the microwave and made a mess.

But when things go smoothly, the appearance is one of calm, quiet, even boredom. The boredom is often real, believe me, especially 11 long flights into a campaign. But the instruments are still working and recording their data, the airplane is flying smoothly, and all is well in the Operation IceBridge world. I like days like this.


DC-8 data systems engineer Eric Buzay always looks productive. I’ve never seen this guy take a nap.Image is courtesy of John Sonntag.

Calibrating in California

Before the IceBridge crew flew to Thule, Greenland, they performed a test flight on March 17 in California to calibrate the aircraft’s science instruments.


From: John Sonntag, senior scientist with the IceBridge management team, URS Corporation in Wallops Island, Va.

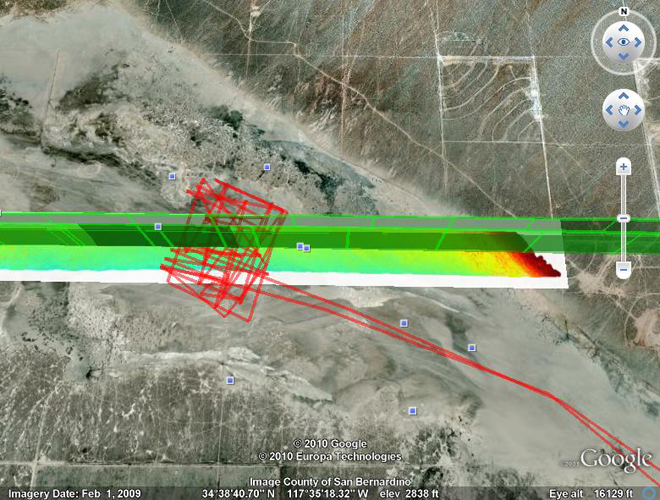
This Google Earth image graphically illustrates one of the many techniques the Airborne Topographic Mapper (ATM) team utilizes to calibrate and validate our instrument.

The image shows El Mirage Dry Lake, about 25 miles east of Palmdale, Calif. We overflew the lakebed three times on the March 17 test flight — the flight paths are shown in green. The extremely detailed elevation measurements made by the ATM are depicted by the multi-colored swath, with warm colors depicting topographic “highs” and cool colors depicting lows. The red path is a survey we conducted of the lake surface with a GPS-equipped vehicle.

By comparing the ATM laser swath measurements with the surface measurements we made using the GPS-equipped vehicle, we can derive a variety of calibration measurements for the ATM, which we use to improve its accuracy and precision, ultimately to the level of a few centimeters. This process has just begun and will be supplemented by many other datasets as we proceed with the campaign.

Another aspect this image illustrates is the extremely high precision of our navigation systems, which are also part of the ATM system. The flight crew “coupled” their autopilot to our precise navigation system for all three of these passes. The result was that all three passes were within just a few meters of each other — pretty impressive when we’re flying at 250 knots!