From: John Sonntag, ATM Senior Scientist and IceBridge Instrument Team Lead
Thule, Greenland — One of the many unusual aspects of flying with NASA’s Operation IceBridge (OIB) is that we fly very, very precisely. Getting the airplane where we want it to be, when we want it to be there is important for a variety of reasons. At its most basic, however, precise flying is necessary to match the limited footprint of our remote-sensing instruments with the target they are measuring. This target might be a spacecraft ground track, the centerline of the fastest-moving channel of a steep, sinuous glacier, or even a research camp established on a drifting ice floe.
Our pilots are outstanding professionals and the precise flying is primarily their doing. But to help them do it, OIB leverages NASA’s multi-decade investment in operations of the Airborne Topographic Mapper (ATM), a scanning lidar and key instrument of OIB. The ATM project, which is my own home team and where I learned most of what I know about airborne science, long ago addressed the need to fly a remote-sensing aircraft very accurately over regions with no fixed landmarks. The key, not surprisingly, is the Global Positioning System, or GPS. GPS, of course, gives us nearly continuous updates of our position with an accuracy of just a few meters. But using this knowledge effectively, especially at 250 knots, is a little tricky.
So the ATM team developed, and continues to modernize, a suite of software and hardware tools to effectively use GPS to help pilots steer an airplane very accurately, and even to steer the airplane directly. In their current form these tools are called “SOXMap and SOXCDI”.
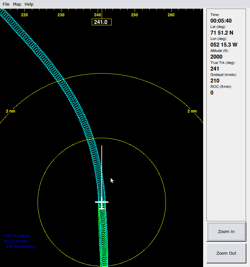 SOXMap is really just a “moving map” system, at heart not unlike the ones in consumer GPS units used in cars or for hiking, but simpler and highly specialized for remote sensing applications. SOXMap displays the aircraft’s current position and orientation relative to a science target, such as the sinuous centerline of a glacier (see the SOXMap illustration, left). It also displays the measurement swath being collected by a science instrument such as the ATM, drawn to scale. This display is piped to the pilots up front, using little tablet computers with very sharp, bright displays, which are mounted right on the control yoke. Our pilots use this information, which is continuously updated, to steer the aircraft and its sensor swath right where we want it. Some of our OIB pilots refer to SOXMap as “the Pac Man display”, in reference to the old video game where the player guides a little mouth around a screen chewing up dots. The beauty of SOXMap is its versatility. Our bread-and-butter use for it with OIB is to follow sinuous glacier centerlines with any degree of curvature, but SOXMap is also useful for area-mapping applications, or really any targeted flying.
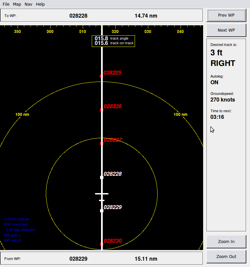 Even cooler than SOXMap is its sibling, “SOXCDI”. SOXCDI (image right) incorporates a moving map display similar to the one in SOXMap, but unlike SOXMap, SOXCDI can actually steer the airplane automatically! It is designed for cases where we fly long straight lines, such as grid lines or satellite ground tracks. We can do the same thing successfully using only SOXMap, but for long straight lines this demands lengthy periods of concentration from our pilots and can be extremely tedious for them. So SOXCDI continuously compares the current position of the aircraft to a desired straight-line track connecting a pair of waypoints (for any navigation geeks who might be reading along, the straight line is actually a great circle, and I plan to add a selectable rhumb line option as well). Doing a little math with that comparison, we always know how far we are from the desired track and whether we are right or left of it.
But how do we use this information to steer the aircraft automatically? Here is where things get extremely cool. It turns out that most large airplanes have what is called an “instrument landing system”, or ILS. The ILS is really just a radio receiver that is designed to listen to a simple pair of audible tones being broadcast from an airport runway, each tone angled slightly away from each side of the centerline. This allows them to land in bad weather when the runway isn’t immediately visible. If the ILS radio “hears” more of one of the tones than the other, it directs the pilot, actually the autopilot in our case, toward the “quieter” tone until the two tones are equal. When they are equal, the airplane is centered on the runway, right where it should be.
Can you guess where we’re going here? SOXCDI simply mimics an ILS signal, which we pipe into the aircraft’s autopilot. And it’s pretty simple, really. If we’re left of track, we generate more of the “left” tone than the “right” tone, and vice versa. The airplane’s autopilot does the rest. The tricky part comes in calculating how much of each tone we generate given how far right or left of track we are, but those are just details. The point is, the system is simple because we just piggyback on existing technology – the ILS. And though our software certainly has some complexity, the hardware is almost breathtakingly simple. We run the SOXCDI (and SOXMap) programs on very basic, run-of-the-mill computers – that 8-year-old laptop you tossed in the closet during the previous presidential administration would probably work fine once we installed our software on it. The tones are generated by the sound card built in to every modern computer has built in. We literally just plug a cable into the headphone jack of the computer, and plug the other end into a standard piece of lab equipment called a “function generator.” The function generator just takes the two tones and turns them into a radio signal, which we then pipe via another cable into the airplane’s ILS. And that’s it. You might not be familiar with a function generator, but to give you an idea what a basic piece of lab equipment it is, we recently bought one for just about $1,000, about what a basic laptop costs.
Once it’s all set up, SOXCDI generally keeps the airplane within just a few meters of where we want it to be, and can do it literally all day long. It does this, in essence, by “singing” a two-note chord to the airplane, the relative volumes of the two notes determining the steering correction. And it works equally well with both of NASA’s workhorse OIB airplanes – the P-3 turboprop and the DC-8 jet. And that points to another strength of the SOXCDI design. Because it mimics standard ILS signals, it should work with any ILS-equipped airplane.
If I sound enthusiastic about our precise navigation systems, well, I am. I am the developer of SOXMap and the co-developer of SOXCDI with my colleague Rob Russell, and I’m very proud of their role as a key enabling technology for IceBridge. They are also just about the most fun projects I’ve ever taken on at work, a perfect task for an at-heart aerospace tinkerer like me. But Rob and I can’t claim all the credit, or even most of it. We built SOXCDI and SOXMap on ideas originally conceived and developed by our colleagues Wayne Wright (SOXCDI predecessors), and Richard Mitchell and Bob Swift (SOXMAP predecessors), respectively.
And finally, what about those names? Well, the original implementation of the moving map concept with the sensor swath drawn to scale, way back in the 90s, was called XMAP. So in homage to that, I originally called my implementation “Son Of XMAP”, which became SOXMap. Later when we developed SOXCDI, we essentially merged elements of SOXMap and and older system called CDI (for Course Deviation Indicator), yielding SOXCDI.

