Mowing the Lawn at Pine Island Glacier


From: Jill Hummels, Public Information Officer, University of Kansas School of Engineering


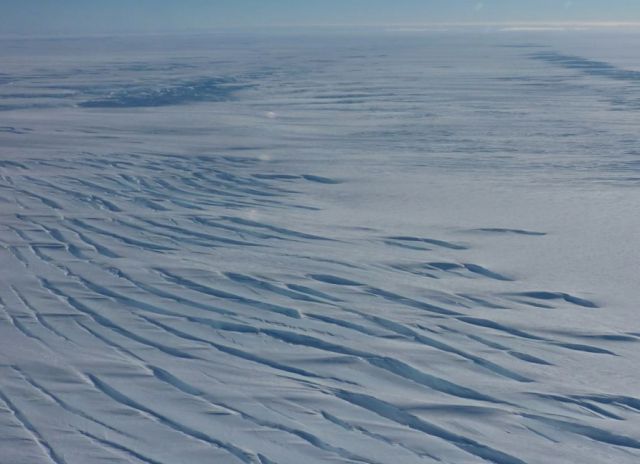
PUNTA ARENAS, Chile, Oct. 20 — Today’s high-altitude flight took NASA’s Operation Ice Bridge researchers over Antarctica’s Pine Island region (75° 25’ S and 98° 25’ W and surrounding area).


“We’re really pumped. We’re getting some really good data,” says Chris Allen from the University of Kansas about midway through the 11-hour flight. The electrical engineering professor and four graduate students are operating three different radars developed at the university through the National Science Foundation Center for Remote Sensing of Ice Sheets.


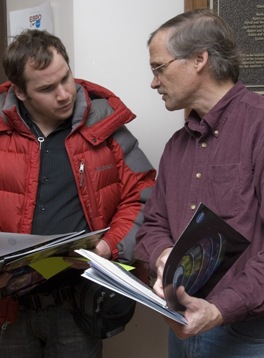
Chris Allen at the controls of the MCoRDS radar, over Antarctica. (Jill Hummels/University of Kansas)


“A while back, we were over the ice shelf, and it was very distinct.” Now, as the plane progresses over the land formation, the vibrant multicolored display offers less clear information. But the raw data is still being captured. “That’s where the signal processing comes in,” Allen says.


The display offers a cactus-like spectrum of color, with spikes protruding from separate layers of color. The uninitiated eye can clearly see a “surface” in the image. That would be the top of the ice layer, Allen explains. The more trained eye knows that where the yellow, aqua and blue colors intermingle is where the real action lies. More sophisticated methods will be needed to coax meaning from the raw data.


Already the Kansas team is eliciting “oohs” and “ahhs” from other science team members through data they’ve collected with the MCoRDS radar in the mission’s two previous flights.  In a recent evening briefing at the hotel in Punta Arenas, an image being displayed for all to see appeared to show that in one inland area of Antarctica the ice sheet is several kilometers thick and is nestled in a channel of bedrock that appears to be well below sea level.


Five hours after today’s flight started, the plane has gone through several passes over the glacier and still has many more to go. The proscribed flight path — called “mowing the lawn” — includes 11 parallel lines and a couple perpendicular ones. Each parallel path is about five miles apart. However, the flight crew skips the adjacent path in order to comfortably make the wide turn to the next run. A couple “teardrop turns,” wider turns that loop back nearly 360 degrees to a narrower path, have been thrown in for good measure to ensure the science and engineering teams are on the exact positions they need.  It also helps break the monotony of flying over endless tracks of white.


Even after the flight crew has maneuvered the DC-8 through its perpendicular labyrinth and is making the long stretch home across the Antarctic Ocean, the Kansas team will still be hard at work crunching numbers and distilling hard truths from the icebergs of raw data.  With significant computing power aboard the plane, the team has made it a goal to try to deliver detailed information about ice sheet thickness and more by the time the plane lands in Punta Arenas.


The DC-8’s flight plan (dark lines) and actual flight paths (red lines) mid-way through the “mowing” of Pine Island Glacier. (Pine Island Bay is on the left side of this image.)


Up and Down Thwaites Glacier


From: Kathryn Hansen, Science Writer, NASA Goddard Space Flight Center


NASA’s DC-8 returning from its second Antarctic flight of the mission.  (NASA/Steve Cole)


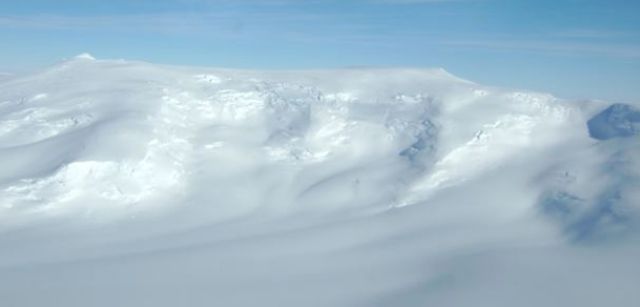
On Sunday, Oct. 18, researchers and crew flew on the DC-8 aircraft’s second Antarctic flight of the Operation Ice Bridge Campaign. The mission was dedicated to reflying areas of Thwaites Glacier previously mapped by the ICESat satellite to see how the glacier has changed.


The team took advantage of the good weather, flying at low altitude, spending about three hours surveying the glacier with the Airborne Topographic Mapper (ATM), the campaign’s primary instrument. ATM pulses laser light in circular scans on the ground, which reflects the pulses back to the aircraft. The laser data are then converted into elevation maps of the ice surface.


Another instrument, the Multichannel Coherent Radar Depth Sounder (MCoRDS), collected thickness measurements over the glacier. The instrument team’s initial analysis of the data turned up unexpected depth.


First Flight: Across the Getz Ice Shelf


From: Steve Cole, Public Affairs Specialist, NASA Headquarters


PUNTA ARENAS, CHILE – The first flight of Operation Ice Bridge was made from the southern tip of South America on Friday, Oct. 16. The primary target was the Getz Ice Shelf along Antarctica’s Amundsen Coast. The DC-8 flew two parallel tracks along the coast, one just offshore over the floating ice shelf, and one just inland. By measuring on either side of the “grounding line” between the floating ice and the ice on land, scientists can determine the rate at which this near-shore part of the ice shelf is melting.


This target area was selected from the series of flights planned because weather forecasts showed that this was the only clear area available. The low-altitude Getz grounding line paths would allow for a survey of the bottom topography with the MCoRDS instrument, a search for the presence of under-ice water with the gravimeter, and ice surface topography measurements with the ATM laser instrument.


The plane took off at 9:11 a.m. local time with 31 people onboard, including a videographer with the Associated Press. The DC-8 flew at 35,000 feet on the ocean transit to Getz. During this part of the flight, the LVIS laser and the DMS mapping camera made observations of the sea ice. The DC-8 covered 1630 nautical miles before getting to its science targets in Antarctica.


The DC-8 descended to about 1500 feet just east of the Scott Peninsula to begin the low-altitude observations. At the end of the flight path over the Getz Ice Shelf, the plane turned out over the sea ice, which was characterized by open water.


The DC-8 then flew up the DeVicq Glacier to an elevation of about 5,000 feet. Returning to the onshore survey line, the pilots were able to fly the entire line with clear skies. We completed a total of 3.5 hours of low-level flight. The ATM team reported collecting about 200 million laser measurements during the flight. The DC-8 landed at about 9 pm.  Total flight time: 11 hours, 45 minutes.


— Based on reports from Seelye Martin (University of Washington) and James Yungel (NASA Wallops Flight Facility)


Getz Ice Shelf at low altitude (Photo courtesy Seelye Martin)


Mount Kauffman at the head of the DeViqc glacier (Photo courtesy John Yungel)


Antarctic sea ice from 20,000 feet. (Photo courtesy John Arvesen)


On Sea Ice


From: Kathryn Hansen, Science Writer, NASA Goddard Space Flight Center


The Operation Ice Bridge team is just about to start science flights over two main Antarctic targets: ice sheets and sea ice. Thorsten Markus, principal sea ice investigator for the mission, chatted with me at NASA Goddard in Greenbelt, Md., about sea ice and how measurements from the air will differ from what’s possible on the ground or from space.


We hear a lot about sea ice in the Arctic. How is sea ice in Antarctica different?
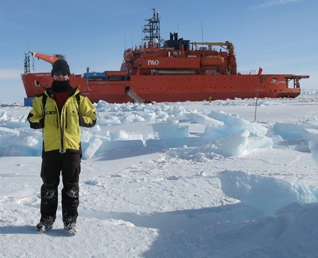
 

Markus: The immediate response is that the Antarctic sea ice is experiencing a decline in cover. The problem with Antarctica is that you don’t have an easy one-sentence answer. The Arctic is sort of easy: the ice is decreasing, and we’ll eventually see ice-free summers. In Antarctica, the system is more complex. Next to West Antarctica, sea ice is decreasing. Around the Peninsula it’s also decreasing and probably getting more snowfall, so we see big changes there, too. But for more of the continent, we actually see a slight increase in sea ice. It has to do with the ocean underneath the ice, the ozone hole, and a combination of both. A big difference is also that Arctic sea ice is centered at pole with land masses around it. In Antarctica, we have the opposite scenario:  A landmass centered at the pole, the Antarctic ice sheet, and sea ice around it in full contact with the world’s ocean.


What are the potential global impacts of changes to Antarctica’s sea ice?


Markus: Sea ice formation and melt have a really strong impact on ocean circulation, which acts like a huge heat pump keeping our climate stable. This “thermohaline circulation” is driven by temperature and salinity. The interesting part of this circulation is that the deep, bottom water masses of the ocean only make contact with the atmosphere only at polar latitudes, in the Arctic or the Antarctic. Change ocean salinity — by growing or melting sea ice, which is inherently salt-free — and you can affect global circulation. The process is complex, but that’s basically why it’s so critically important.


Sea ice in Antarctica is also important for the global energy balance, just as in the Arctic. It’s a white surface that reflects solar energy, which affects Earth’s whole energy system.


Do we have a good idea of what the thickness is?


Markus: There are some measurements from drillings or from icebreakers, but those are snapshots in time and very sparse. The area you cover with a ship is excruciatingly small. So we do have some idea, but it’s not great. With the ICESat satellite and the Operation Ice Bridge airborne campaign, we have a chance to get ice thickness measurements over larger scales than we have been able to get before.


We have more instruments on the plane than we have on the satellite. So while aircraft don’t provide nearly the coverage of satellites, you do get additional information — such as thickness — that should be really useful.


What sea ice information will we get from the aircraft campaigns?


Markus: We have a laser altimeter, Bill Krabill’s instrument, that’s similar to ICESat and is the primary instrument of the mission. The laser bounces off the surface, whether it’s snow or ice, and provides a measure of surface elevation. But we also have radars on this plane, developed by the University of Kansas, which penetrate the snow. If you look at the difference between the laser and radar results, ideally you get the snow depth.


Accurate snow depth is important for estimating sea ice thickness, which is done with a conceptually simple calculation: if you know how much ice is above the water, then you can estimate how much is below the water. The problem occurs when you have snow on top, which submerges the ice to some extent.


Snow depth is a bigger issue for Antarctica because we have overall thinner ice and more snow than we have in the Arctic. It can vary quite significantly — anywhere from zero to a few meters — and it can be so heavy that the ice itself is submerged below sea level and you get flooding on the interface.


ICESat does not have radar, so in this regard we are getting a value-added product in Ice Bridge. In an ideal world, people would put a radar altimeter together with a laser altimeter — something you can do on a plane, but not as easily on a satellite.

So there’s a need to continue flying airplanes?


Markus: Yes. Some people are saying “Wow, we can do everything with airplanes,” which is wrong because the Antarctic is huge. It looks great on paper because all the flight lines that we draw on maps are pretty thick. But if you drive with your car across the United States and measure something, does this represent the entire United States? If you drive too far south, you miss the Rockies, and if you drive too far north, you miss the desert Southwest, so you get a completely wrong picture of the United States.


We can, however, look at critical areas in the sea ice, as well as over the ice sheets and see how they are changing in the time between ICESat and ICESat-II, so that we are not completely blind. 


Why is it important to have that continuous coverage in Antarctica?


Markus: We want to establish a consistent long-term record so that we have continuous coverage. A gap in data leaves you with just a snapshot in time and poses a problem. For example, if you measured Washington, D.C.’s temperature in December 1990 at 70 F and then again on that date 10 years later at 30 F, you might assume a dramatic cooling trend. We want to avoid a similar misinterpretation of changes in Antarctica. We now have five years of data from ICESat, but we have just started to understand the processes.


Have you been to Antarctica?


Markus: Yes, several times for field work. On an icebreaker mostly.


The irony is that from a plane, as well as from on the ice, it looks and feels like really solid ground.  It looks perfectly still. You’re in an ice desert.  On previous field expeditions that were on the ice, we would take out drills and hammers and more sophisticated instruments and do our work; it looks pretty much like a construction site. The captain would tell us afterward that we drifted 10 miles while we were working. It’s just incredible if you think about it: standing on ice we would measure its thickness with all these drills and know we were on 15-20 centimeters of ice, and that underneath is 4,000 meters of water. You’re floating out there, it’s a terribly cool thing.


What about from the sky?


Markus: Ice Bridge flights won’t land in Antarctica, but even from a plane, sea ice looks static. An animation compiled from satellite images of Antarctic sea ice shows you how dynamic the sea ice is — how it looks like a living thing. In Greenland, I showed a similar movie of Arctic sea ice to the pilots while we were flying and they were amazed when they saw what’s really happening. Only since satellites did people get a better understanding how dynamic the sea ice is.
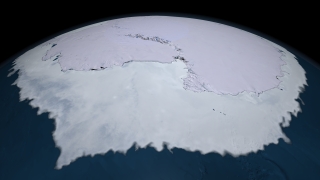


Sea ice surrounding the Antarctic landmass is dynamic, shifting in location, extent and thickness. This animation shows the sea ice motion around Antarctica from June 4 through Nov. 18, 2005. Credit: NASA/Goddard Space Flight Center Scientific Visualization Studio


Getting You Behind the Scenes


From: Steve Cole, Public Affairs Specialist, NASA Headquarters, Washington, D.C.


The last time I was on NASA’s big DC-8 “flying laboratory,” I never got off the ground.
 

It was a bright April day last year in Fairbanks, Alaska. There was fresh snow on the runway and a wind chill of about 0 degrees Fahrenheit. I was helping journalists get behind the scenes of NASA’s airborne campaign to see how air pollution factored into climate changes across the Arctic. The DC-8 was filled with scientists and instruments and reporters – Associated Press, National Public Radio, the Fairbanks Daily News-Miner – on our media tour of the plane at the city’s airport. (In the photo, I’m the helpful one on the right.)


That’s what we do in NASA’s Office of Public Affairs: help get the word out to the press and public about the cutting-edge science, technology, and exploration that U.S. taxpayers sponsor through our civilian space agency. My slice of NASA is the Earth Sciences Division. Although I usually work this beat from behind a desk, once in a while I get to head outside when NASA launches a new Earth-observation spacecraft or takes to the field to do some science.


Now I’m no scientist (English major, thank you), but I’ve been writing about what scientists do for over 20 years. What fascinates me about the whole endeavor is the ingenious ways these men and women find to see things that haven’t been seen before. Who has seen a continent-sized ice sheet change before? I mean, how do you do that? Well, they find a way.  It’s an amazing and fun thing to watch.


And with Operation Ice Bridge, I might finally be able to watch scientists doing their work from the air. The DC-8 flight managers tell me there should be enough spare seats for reporters and public affairs types like me to fly along over Antarctica. If that works out, I’ll be sharing the experience with you using the new media tools we now have available: Twitter, YouTube, Flickr, and this blog.


Look for my live reports from Punta Arenas, Chile, starting Oct. 16.


Satellite Laser Fires Up for Campaign


From: Kathryn Hansen, Science Writer, NASA Goddard Space Flight Center


On Wednesday, Sept. 30, engineers, scientists and mission operations personnel gathered around a single computer monitor tucked away in a corner of a building at NASA Goddard Space Flight Center in Greenbelt, Md. They were waiting for an indication that communication was established between the satellite ground station in Boulder, Colo., and NASA’s Ice, Cloud, and land Elevation Satellite (ICESat) in orbit. Once a connection was made, scientists can “command on” one of the satellite’s lasers and resume the collection of critical ice elevation data.

ICESat has been collecting elevation information of Arctic and Antarctic ice sheets and sea ice since 2003, but it’s uncertain how much longer the satellite’s last of three lasers will operate. So, scientists this fall are using ICESat to calibrate similar measurements from aircraft flights over targets in Antarctica during Operation Ice Bridge. The aircraft campaign will help bridge the data gap until ICESat-II is launched.

As the satellite made a first pass over Antarctica at about 4:15 p.m. EDT, a glitch in communications foiled the first contact. The satellite’s next pass over Antarctica gave ground station managers at University of Colorado’s Laboratory for Atmospheric and Space Physics in Boulder, Colo., enough time to fix the glitch.

At 5:50 p.m., station connection with the satellite was a success and “all commanding was executed as planned,” said David Hancock of Wallops Flight Facility in Wallops Island, Va., instrument manager for the satellite’s GLAS instrument that houses the lasers.

“We now have two ‘laser on’ campaigns per year,” said Shelley Thessen, of ICESat mission operations at Goddard. “It’s a common occurrence, but I still get a lump in my throat every time.”

Subsequent passes over Antarctica were also successful. Scientists have started analyzing the science data returned from the first pass, seen in the figure above as a blue line across central Antarctica.

“On this first pass, there was a small amount of thick cloud cover over the ice sheet,” said Jay Zwally, ICESat project scientist at Goddard. “Accurate measurements of the surface elevation were obtained from 93 percent of the 23,297 laser pulses over the ice sheet.”


Flying the Antarctic: The Trouble with Weather


From: Seelye Martin, Chief Scientist, Operation Ice Bridge


The issue of forecasting weather conditions over Antarctica presents a serious challenge to the Operation Ice Bridge DC-8 flights that get underway in just two weeks.

In the Southern Hemisphere, the Antarctic Ocean is unique in that the Antarctic Peninsula (the focus of many of our flights) is the only north-south oriented land barrier. Within this region, five or six weather systems accompanied by clouds and strong winds, rotate rapidly around the continent from west to east. The clouds from these systems extend from the ocean to the ice sheet, and are associated with strong winds. These systems are partially blocked by the mountains on the Peninsula that rise to approximately 10,000 feet (3,000 meters). Between these weather systems, periods of clear sky occur.

(See for yourself. Here is a link to one Antarctic forecast tool I’ve been using: http://www.mmm.ucar.edu/rt/wrf/amps.  After opening the first page, click on “animations” at the top left; in the next frame select “cloud base” under the first pull-down menu on the left. The image above is a sample of what you’ll see.)

The challenge in planning the flights is that we require clear weather over the target area to operate the lasers. For aircraft safety, we also need to avoid severe storms.


We will obtain our forecasts by working with the Chilean weather service, with polar scientists from the Centro de Estudios Cientificos (Center for Scientific Studies), by examination of satellite imagery downloaded at the airfield, and by use of web-based forecasts.


Another mission challenge is that as it proceeds, our ability to obtain a cloud-free flight decreases. This occurs because at the beginning of the flight series, we have a variety of geographically dispersed targets, such as the sea ice in the Weddell and Amundsen seas, the Peninsula glaciers, and the ice sheet in the vicinity of Pine Island and Thwaites glaciers. This gives us geographic flexibility and the ability to choose a cloud-free region from many different sites. As the flights proceed, the number of our target sites decrease, and finding cloud-free conditions over the target will become more difficult.


Communicating 'Wondrous' Research Efforts


From: Jill Hummels, Public Information Officer, University of Kansas School of Engineering

In August, my boss sent me an email with the subject line of “FYI.” I know what he really meant to type was “Great Opportunity.” In the email he asked if I would be willing to travel to the southern tip of Chile to report on the activities of a University of Kansas research team.

My response: “I carry my passport with me at all times … Yes.”

As a public information officer for the KU School of Engineering, I work with people who do truly wondrous things that few others outside the school or the field know much about. My job is to ensure more people know the wondrous, seemingly magical, research efforts of our faculty.

This time I’m following the adventures of KU researchers who’ve developed radars and computer models that can tell the world a lot about what’s happening to our polar ice. Not a bad gig. The KU team, housed at the Center for Remote Sensing of Ice Sheets and led by Professor Chris Allen, was selected by NASA to provide much of the instrumentation for Operation Ice Bridge. Also, not a bad gig.

I’ve traveled to most states and visited many Canadian provinces and a few Mexican states, but this is my first trip outside North America. I’m pretty excited about the opportunity to travel to Punta Arenas, so much so that a 29-hour flight itinerary seems like a pretty cool endurance test. I guess it’s good that I like to fly. That finely honed skill will come in handy if I’m able to sit in on a flight over Antarctica in NASA’s DC-8.

My family is pretty pumped about my Chile excursion, too, although we haven’t broken the news to the dog, yet. We think she might be jealous.


Thinking on Your Feet on the Ice


From: Nick Frearson, Gravimeter Instrument Team, Lamont-Doherty Earth Observatory


Hi there! I’m senior engineer at Columbia University’s Lamont Doherty Earth Observatory in New York, and my role in Operation Ice Bridge is to work with the gravimeter. This instrument can see beneath ice sheets into the water and bedrock below to reveal the hidden shape of this part of the ice sheet – critical information for predicting how ice sheets will change as the climate warms.


I see the importance of the poles as an indicator of change. There you can see how sensitive the environment is and how easy it is to upset its delicate balance. Changes to the ice sheets at the poles will change sea levels and climate around the world.


I have traveled to both poles and like the wildlife, solitude and shear expansiveness of these amazing places that remind me constantly of how fragile life is. I enjoy thinking on my feet and solving problems with limited resources — so different from our normal civilized lives.


On my last trip to Antarctica, we mapped a huge and remote ice-covered mountain range in the middle of the continent, trying to understand how and when the ice sheets formed. Inside my tent I could hear the constant whispering of the wind over the snow, mixed with the music of Radiohead, Coldplay, Snow Patrol, Imogen Heap, among many others.


I miss my friends when I’m away. Two summers ago, I went to Canada’s Ellesmere Island with my good colleague, Michael Studinger, to test gravity instruments near the North Pole. The island is stunning with windswept hillsides leading down to frozen fjords. I walked for miles across the island, observing Musk Ox and wolves go about their lives. Back at camp, I enjoyed listening to other scientists talk about their travels.


I hope that you enjoy reading about our exploits flying over Antarctica as much as I’ll enjoy taking part in them.


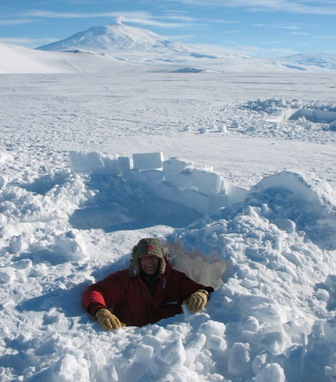
Nick Frearson from the Lamont-Doherty Earth Observatory

“at home in his snow hole near Mount Erebus,

Antarctica, Christmas 2008.”


A New Way to Experience Antarctica


From: Michael Studinger, Instrument Co-Principal Investigator, Lamont-Doherty Earth Observatory 


The scale and style of Operation Ice Bridge will be a new experience for me. I’ve been involved in airborne research for more than a decade using ice-penetrating radar systems, airborne laser scanning, gravity and magnetics to learn more about the polar ice caps and how they behave.


In previous airborne campaigns we have used small instrumented Twin Otter aircraft and operated out of remote field camps deep in the interior of Antarctica and at high elevations and extreme temperatures. This means living and working in tents for months at temperatures around -20 to -40°F and flying in unpressurized aircraft at high altitude. There are no showers and only limited communications with the outside world in these remote field camps.


The Ice Bridge campaign will be very different from that. We’ll be flying non-stop roundtrips on the large NASA DC-8 from Punta Arenas, Chile. It feels a bit strange to be flying over Antarctica without actually setting foot on the continent and experiencing firsthand the icy cold and breathtaking beauty of the polar landscape. During Ice Bridge we will have to enjoy the fascination of the polar environment from a heated and pressurized aircraft cabin.


I am a research scientist at Columbia University’s Lamont-Doherty Earth Observatory in New York. My background is airborne geophysics which I use to study the ice caps and the Earth’s crust in polar regions. For Ice Bridge, I’ll be involved in measuring the Earth’s gravity field to estimate how deep the water is beneath floating glaciers along the Antarctic Peninsula.


I’m looking forward to a relaxed airborne campaign, where you leave from Punta Arenas in the morning and return to civilization in the evening.