Back from Greenland, No Rest for the Weary

NASA and university partners returned from Greenland on May 28, concluding Operation IceBridge’s 2010 field campaign to survey Arctic ice sheets, glaciers and sea ice.

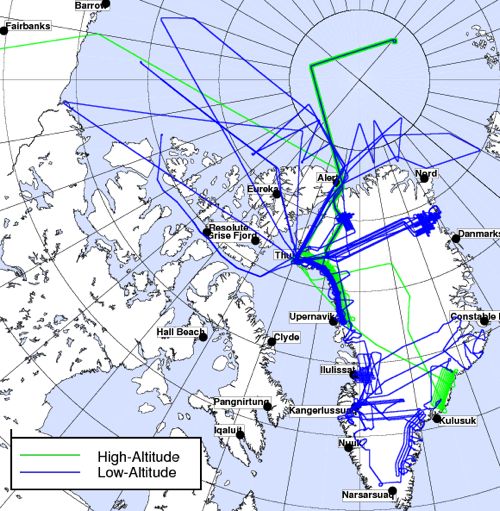
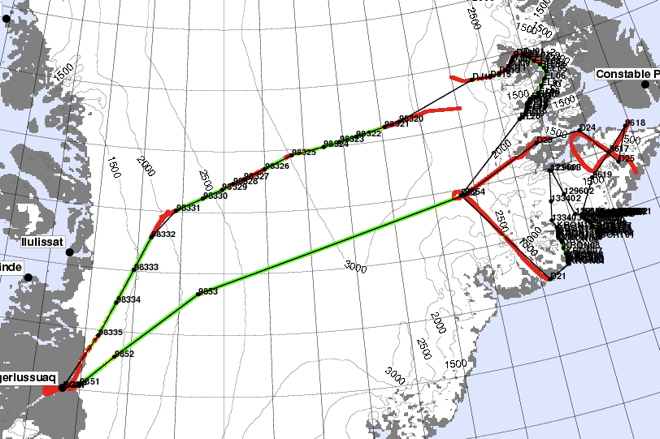
Over the span of almost 10 weeks, crew flew 28 science flights between the DC-8 and P-3 aircraft. Flight paths covered a total of 62,842 nautical miles, equivalent to about 2.5 trips around Earth at its equator. Credit: NASA

IceBridge — the largest airborne survey ever flown of Earth’s polar ice — has now completed two successive Arctic campaigns, adding a multitude of new information to the record from previous surveys.

Continue to follow the IceBridge blog and twitter feed to read updates as science results emerge. Also hear from scientists already planning the return to Antarctica this fall.

IceBridge project scientist Michael Studinger, recently back from the field, offered words of thanks to those who helped made the 2010 Arctic campaign a success.

“A project of this size with two aircraft and multiple deployment sites and a fairly complex instrument payload is only possible with the support of many people. I would like to thank everyone from NASA’s Dryden Aircraft Operations Facility, NASA’s Wallops Flight Facility and NASA’s Earth Science Project Office, who all provided excellent support for Operation IceBridge. We also had excellent support from the NASA instrument teams, the science teams from the universities, and many of our science colleagues, both, from the teams in the field and from people back home in the labs. IceBridge also would like to thank the many people in Kangerlussuag and at Thule Air Base in Greenland who provided excellent support while we were there. We could not have accomplished our goals without their terrific help.”

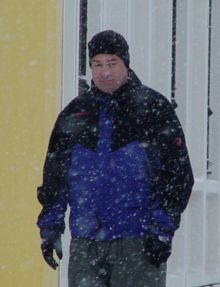
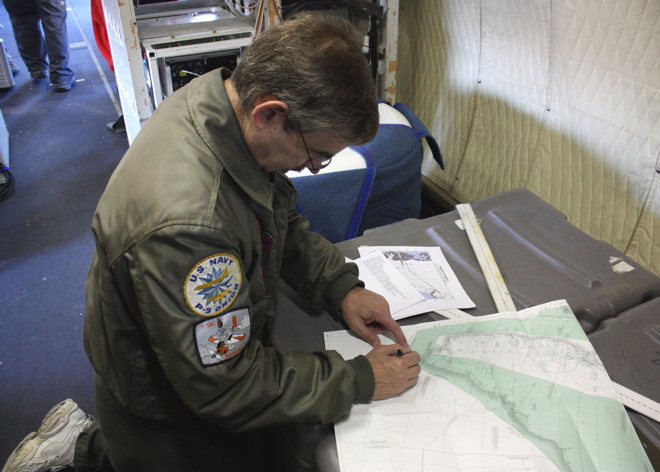
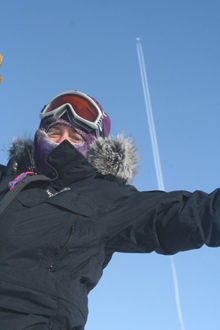
Michael Studinger (right) readies for a science flight from Kangerlussuaq, Greenland, during the Arctic 2010 IceBridge field campaign. Credit: NASA/Jim Yungel

Seeing Eastern Greenland for the First Time

From: Jason Reimuller, aerospace engineering student, University of Colorado, Boulder

My involvement with Operation IceBridge comes from a desire to better understand the polar climate and the climatic changes that are evident there. I have been working with NASA through the last five years as a system engineer for the Constellation project, while working to complete my doctoral dissertation in Aerospace Engineering Sciences at the University of Colorado in Boulder. I have also been recently involved with airborne remote sensing and LiDAR systems by completing a three year, NASA-funded research campaign that involved flying a small Mooney M20K aircraft to the Northwest Territories, Canada to better understand noctilucent clouds through synchronized observations with NASA’s Aeronomy of Ice in the Mesosphere (AIM) satellite.

This has been my first campaign with the project, participating in sorties based out of Kangerlussuaq, Greenland throughout the first two weeks of May 2010. To me, the project is a unique synthesis of personal interests — from polar climate observation and analysis, aircraft operations, remote sensing and instrument design, and flight research campaign planning. My role this year has been principally as a student with the intent to integrate the data that we collect with satellite and ground station data to better characterize glacial evolution, though I hope to become much more involved with the operations of future campaigns.

Seeing Eastern Greenland for the first time through the P-3’s windows, as its four engines lifting the aircraft easily over the sharp mountainous ridgelines and its strong airframe holding up to the constant moderate turbulence of the coastal winds being channeled through the fjords, was spectacular. I really got a strong sense of contrast between experiencing the stark minimalism of the ice cap and experiencing the aggressive terrain of the eastern fjordlands. The long flight trajectories we conducted there gave me a sense of the incredible diversity of the terrain and the low altitude of the flight plans gave me a connection to the environment not available at higher altitudes, even down to viewing the tracks of polar bears!

I have been very grateful to all the team members that have spent time with me to explain in detail the systems that they are responsible for, specifically the LiDAR systems, the photogrammetric systems, and the RADAR systems. Also, NASA pilot Shane Dover clearly explained to me the systems unique to the P-3 from a pilot perspective, which was of keen interest even though I may never log an hour in a P-3. In particular interest to me was the way John Sonntag was able to modulate complex flight plans onto ILS frequencies, providing the pilot a very logical, precise display to aid in navigating through both the numerous winding glaciers and the long swaths of satellite groundtrack. This has truly been an amazing personal experience, but upon hearing the excitement that many of the world’s top glaciologists have voiced about Operation IceBridge during my time in Kangerlussuaq, I’ve been proud to be a part of the team.

Ice Calves from Russell Glacier

From: Kathryn Hansen, NASA’s Earth Science News Team/Cryosphere Outreach Specialist


On May 14, 2010, scientists working from Kangerlussuaq, Greenland, with NASA’s IceBridge mission observed ice calving from nearby Russell Glacier. Credit: Eric Renaud/Sander Geophysics Ltd.

IceBridge scientists spend many days in flight surveying the snow and ice from above. On research “down days,” some scientists use their day off to take in the sights. On Friday, May 14, a group of scientists with Columbia University’s gravimeter instrument — which measures the shape of seawater-filled cavities at the edge of some major fast-moving major glacier — made the trek out to Russell Glacier. In the right place at the right time, the group witnessed a calving event that sent ice cascading down the glacier’s front.

“I took burst speed photos with my Canon 40D and just kept my finger on the trigger until everything stopped moving,” said Eric Renaud, an electronic technician with Sander Geophysics Ltd. “We were lucky to witness it.”

Read more about the group’s trek in a blog post by Columbia University’s Indrani Das, and watch a time-lapse video of the calving event composed by Renaud.

An Inland Connection?

From: Kathryn Hansen, NASA’s Earth Science News Team/Cryosphere Outreach Specialist

Scientists have long been tracking Greenland’s outlet glaciers, yet aspects of glacier dynamics remain a mystery. One school of thought was that glaciers react to local forces, such as the shape of the terrain below. Then, researchers noticed that glaciers in different regions were all thinning together, implying a connection beyond local influences. Scientists have posed theories about what that connection might be, but the jury is still out.

Recently, the landscape in southeast Greenland has started to change. Helheim Glacer, which was thinning at 20-40 meters per year, slowed dramatically to just 3 meters per year while thinning of the nearby Kangerdlugsuaq also slowed. Further south, two neighboring glaciers showed the opposite trend and started thickening by as much as 14 meters per year. Neighboring glaciers behaving in similar ways implies a connection, but what exactly?

The IceBridge flight on May 12 will help scientists learn how changes to outlet glaciers affect the ice sheet inland. Instruments on the P-3 surveyed in detail three southeast glaciers: Fridtjof-Nansen, Mogens North and Mogens South. Next they flew four long lines mapping changes near the ocean and up to 60 kilometers inland, capturing the extent, if any, at which thinning near coast reflects on changes to the ice inland. It’s an important connection to make; while the loss of outlet glaciers alone would not contribute much to sea level rise, loss of the ice sheet could have a dramatic impact.

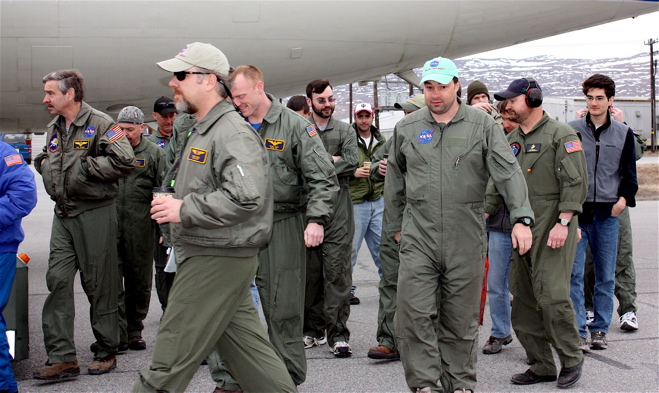
IceBridge crew and researchers board the P-3 on May 12 for a flight to study glaciers and the ice sheet in southeast Greenland. Credit: NASA/Kathryn Hansen


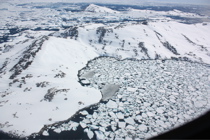
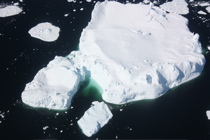
The P-3 flew over areas of sea ice wile mapping glaciers and the flight line closets to the coast. Credit: NASA/Kathryn Hansen

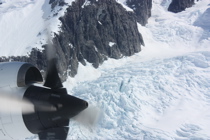
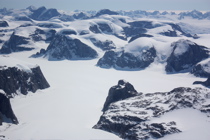
Mountainous terrain along Greenland’s southeast coast led to short-lived periods of turbulence and spectacular scenery. Credit: NASA/Kathryn Hansen

Eyes for Ice: In the Field with Indrani Das

From: Kathryn Hansen, NASA’s Earth Science News Team/Cryosphere Outreach Specialist

KANGERLUSSUAQ – Kangerlussuaq International Science Support is a red, boxy building that doubles as a laboratory and a hotel for polar researchers. Upon my arrival it was quiet, nearly empty. By the end of the week, however, an influx of scientists staging field expeditions quickly filled the kitchen and halls.

Space is limited, so I share a room with Indrani Das, an ice scientist from Columbia University’s Lamont-Doherty Earth Observatory — the only other woman with the IceBridge team here in Kangerlussuaq. She works with the Gravimeter instrument, which measures the shape of seawater-filled cavities at the edge of some major fast-moving major glaciers.

Das, looking out the P-3’s window on the flight to Greenland’s Helheim and Kangerdlussuaq glaciers, has expertise that reveals a world hidden from my untrained eyes — textures in the ice that disclose, generally, how a glacier is moving.

Das wrote about her experience on the flight May 8, sprinkling her narrative with some glacial facts. Read her post here, on the Lamont-Doherty Earth Observatory’s IceBridge blog.

The Big Three

From: Kathryn Hansen, NASA’s Earth Science News Team/Cryosphere Outreach Specialist

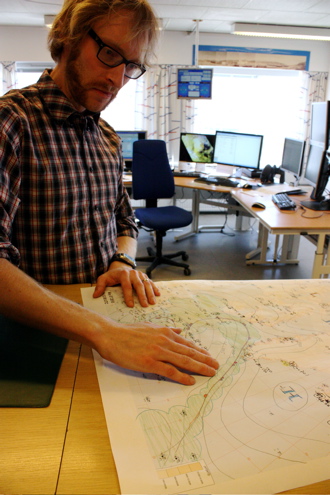
KANGERLUSSUAQ — The evening before the second science flight, IceBridge scientists Michael Studinger and John Sonntag visited Kangerlussuaq’s weather office — a small building adjacent to the town’s grocery store. Weather can make or break a mission, as clouds interfere with instruments’ ability to map the ice.

This time there was another factor to contend with. Ash from Iceland’s Eyjafjallajokull volcano had made its way over the southeast side of Greenland. Comparing the proposed flight path with the position of ash, IceBridge crew decided the flight was a “go.”

Mission managers selected the Helheim-Kangerd flight plan, which called for mapping two of three glaciers deemed “the big three.” (The third is Jacobshavn, to be surveyed in a separate mission).

Helheim and Kangerdlugssuaq glaciers are quickly accelerating, speeding up ice loss to the ocean. Steep beds and the influence of saltwater working its way under the glaciers are thought to be playing a role. Annual data collected during IceBridge will help scientists maintain a record of the ice loss and learn more about the factors driving the change.

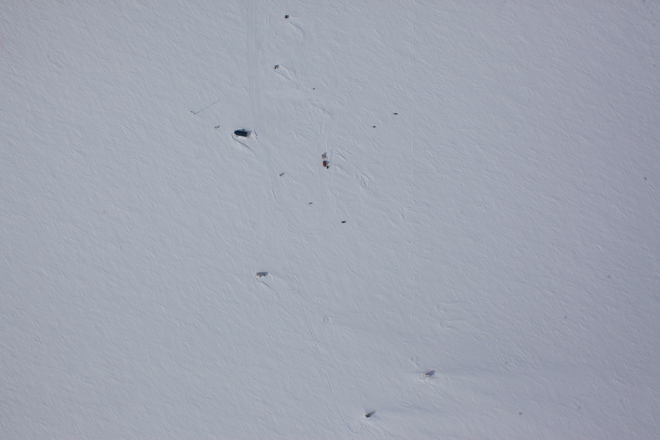
After mapping Kangerdlugssuaq, the P-3 passed over a ground team on an expedition collecting ice cores. The overflight was intentional — multiple sources of data over a single location can prove useful for calibrating data and for research. Similarly, IceBridge flights frequently reexamine tracks previously observed by the ICESat satellite. The ice coring crew was caught on camera (below) by the Digital Mapping System — a digital camera mounted in the underbelly of the P-3.

Isolation

From: Kathryn Hansen, NASA’s Earth Science News Team/Cryosphere Outreach Specialist

KANGERLUSSUAQ — There was a rumor that the flight on Friday, May 10, would be among the most scenic of the 2010 Arctic campaign. The high-priority flight along Greenland’s southeast coast required clear weather for pilots to maneuver along the sinuous glaciers at low altitudes. We were fortunate. The first opportunity to fly from Kangerlussuaq with the P-3 on this Arctic 2010 campaign turned up clear skies and relatively balmy temperatures, and we lifted off for Geikie Plateau shortly after 8 a.m.

Why Geikie? The plateau is “dynamically isolated” from the rest of the ice sheet. That means what happens to the main ice sheet is not necessarily also happening to Geikie. So, IceBridge scientists want to collect Geikie’s vitals — ice thickness, surface elevation, bedrock profile — and compare them with the rest of the ice sheet. “They’re potentially doing very different things, which can tell you something about climate’s impact on the region,” said John Sonntag, Senior Scientist with the ATM laser instrument and IceBridge management team member.

The survey of Geikie Plateau called for about eight hours of total flight time. Credit: NASA/John Sonntag

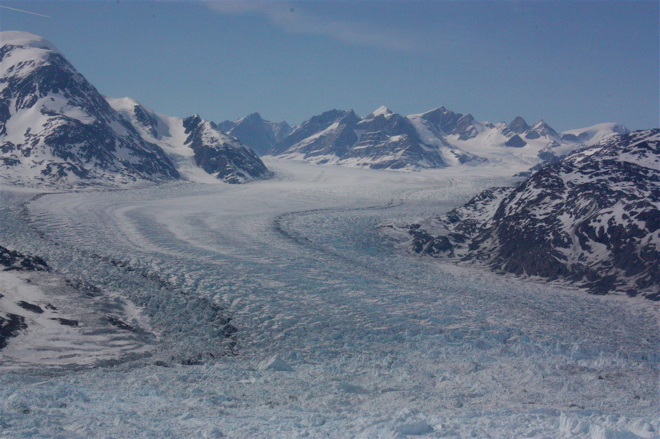
Observing from one of the P-3’s few windows, I was struck by the scale of the landscape. As we closed in on the southeast coast, the flat barren ice sheet soon mingled with occasional hills and then steep mountains with sharp peaks. Ice appeared to be making its escape, flowing down valleys and merging with the glacial superhighway. Some glaciers terminated in cliffs half a mile high. For others, all that remained were the brown, silty remnants.

Ice works its way down between mountains before joining a larger glacier. Credit: NASA

At the same time that I was making my visual inspection, however, IceBridge instruments were collecting a more scientific type of information. Lasers mapped the surface while radars dove down for a look below. Will scientists find that Geikie indeed acts in isolation? They’ll have a better idea after deciphering and analyzing the data. In the meantime, the IceBridge team is plotting to visit a few other isolated ice sheets throughout the mission — if time and weather permit.

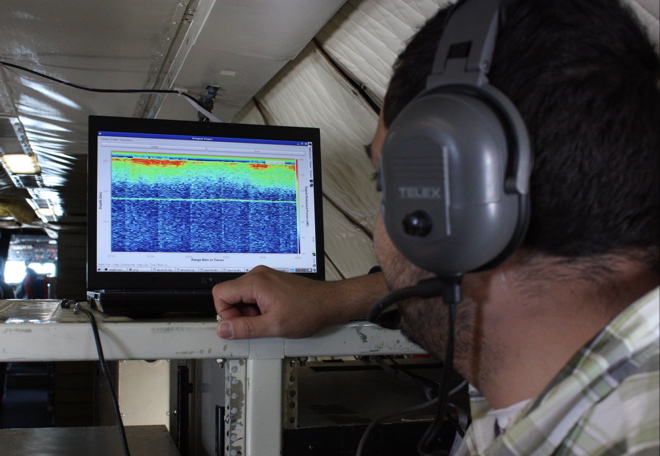
The Multichannel Coherent Radar Depth Sounder instrument shows ice characteristics at depth and also the shape of the bedrock below (thin green line). Credit: NASA

Fasten Your Seat Belts: Mid-Mission Test Flights Complete


From: Michael Studinger, IceBridge project scientist, Goddard Earth Science and Technology Center at the University of Maryland

NASA Wallops Flight Facility, Virginia — During the past week, Operation IceBridge teams have worked at NASA’s Wallops Flight Facility on the eastern shore of Virginia, transferring the science instruments from the DC-8 onto a NASA P-3 Orion aircraft that we will use for the second half of our Greenland campaign. NASA’s fleet of research aircraft allows us to choose the aircraft that is best suited for the science goals that we want to accomplish with IceBridge. We began our work in Greenland with the DC-8 because of its range, load carrying capability, and its ability to fly very high. With the DC-8 we have surveyed the sea ice in the Arctic Ocean and numerous glaciers in northern Greenland. For the second half of the Greenland campaign we will focus on mapping glaciers in southern Greenland using the NASA P-3. The aircraft’s range and maneuverability are ideally suited for low-altitude glacier flying.

The inside of NASA’s P-3 Orion aircraft during installation of Operation IceBridge science instruments at NASA’s Wallops Flight Facility. Credit: Michael Studinger

During the past three months, IceBridge teams from the Center for Remote Sensing of Ice Sheets (CReSIS) at the University of Kansas and Wallops have worked hard to make the impossible possible: designing and manufacturing a complex array of 16 ice-penetrating radar antennas mounted under the wings and the belly of the P-3 and installing and test flying it in only three months! The array of radar antennas is a new development that has never been flown before, allowing us to map heavily crevassed outlet glaciers in unprecedented detail. We will collect several Terabytes of data during each flight that will be processed on a supercomputer at CReSIS when we are back home. The complex array of antennas will allow IceBridge teams to distinguish between radar clutter from surface crevasses and the very weak echo reflected from the base of the glacier of interest. 

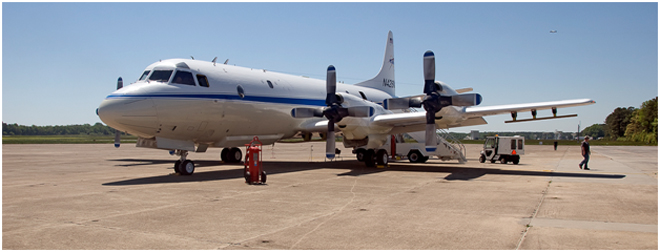
NASA’s P-3 research aircraft waits on the ramp at Wallops shortly before taking off for a test flight. The antennas for the ice-penetrating radar system are mounted under the wings. Credit: Michael Studinger

We have now completed a series of mandatory test flights at Wallops to verify the antenna installation and aircraft performance during flight and to check out our science equipment before we leave for Greenland. Research flying has not much in common with everyday air travel. One of the maneuvers that we do during the test flights is to fly the aircraft at a 90° roll angle with the wings perpendicular to the horizon. Fasten your seat belts! You will never experience something like this on a commercial flight. If you do, you might want to consider using a different airline next time.

NASA’s P-3 aircraft during a test flight over Wallops Island, Va. The ice-penetrating radar antennas for Operation IceBridge are mounted under the wings and the belly of the aircraft. Images are courtesy of Rick Hale, CReSIS.

One of the major science goals of Operation IceBridge is to understand the contributions of the Greenland and Antarctic ice sheets to global sea-level rise. During one of the test flights we use the Airborne Topographic Mapper laser system and high resolution aerial photography to map beach erosion on Wallops Island, the location of NASA’s rocket launch facility. Here, at the coast of Wallops Island, rising sea-levels and increased beach erosion are real and need to be considered in long-term planning for the launch facility.

We have now completed all our test flights here at Wallops and are ready to go back to Greenland where we hope to map many of the outlet glaciers and contribute to our understanding and knowledge of future sea-level rise.

Moment of Truth at Summit Camp

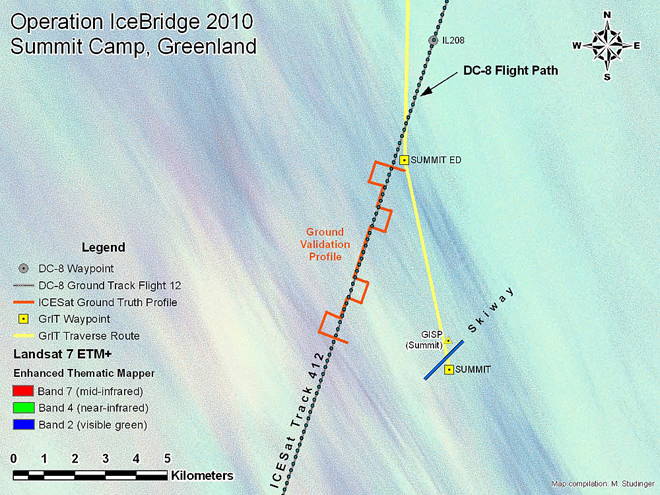
IceBridge mission planners plot some flight lines to match the location — and sometimes the timing — of measurements collected on the ground or from satellites. This “ground-truthing” technique helps scientists calibrate and interpret air- or space-based measurements. On April 14, IceBridge flew along a previous track from the Ice, Cloud, and land Elevation Satellite (ICESat), while at the same time scientists at Summit Camp collected ground-based data. Christina Hammock and Sonja Wolter share some images from the event, and provide a look inside the life of a “Summit Camp techie.”

We had been anticipating this flight for almost a month because we were timing some ground-truthing measurements to coordinate with the flight (more below). We had near-daily contact with John Sonntag for a few weeks prior to the flight over Summit Camp. It took a while, but both the weather and the logistics finally came together for the flight on Wednesday, April 14.

Sonja Wolter(right) from Summit Camp in Greenland was working in the field when NASA’s DC-8 passed overhead. Credit: Christina Hammock

Summit Camp is a research station dedicated mainly to atmospheric and climate research. There are only five people on station during the winter months, which is divided into three phases, late August to early November, early November to early February, and early February to late April. During the summer (late April to late August), the station population goes up to 25-50 researchers and support staff (starting a week from today with the arrival of an LC-130 bringing about 25 people – ack!)

Our crew includes a Station Manager — Ken Keenan; a heavy equipment operator — Geoff Miller; a power plant mechanic — Luke Nordby; and the two of us — the Summit science technicians. When we have an involved task like the IceBridge coordination, everyone helps get us out the door.

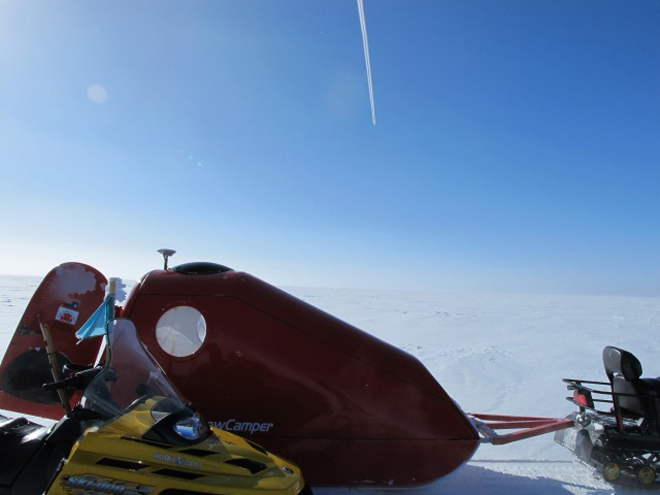
Gear for the IceBridge and ICESat transect at Summit Station included two snowmobiles, an emergency snow camper, a GPS system and a bamboo pole to make the measurement. Credit: Sonja Wolter

As science techs, we carry out and maintain all the ongoing experiments at or near camp. One of these experiments is the ICESat transect, which is (or was) a ground-truthing measurement for the now-defunct ICESat. The Summit ICESat transect is a zigzagging path of bamboo poles that underlies one of the swaths of the icecap that an ICESat overpass used to include. Once per month, we manually measure the snow depth at the poles and also get exact GPS coordinates at these spots.

To do this, we drive two snowmobiles out and cruise (well, putt putt) along the line poles (at -35 F this week). We don’t know for sure, but we’re guessing the round trip is about 8 miles, and it takes us 2.5 to 3 hours. Although the ICESat instruments are no longer working, we have carried on with the transect measurements to continue the data set for this snow accumulation study. This month’s measurements had the extra bonus of being coordinated with IceBridge for verification of their measurements.

During the winter, the last brush with the outside world (not including the world wide web and telephone, that is) is the Twin Otter flight that comes to pick up the outgoing crew after a week of turnover. So, seeing the NASA DC-8 plane was the first reassurance that people are in fact still out there. Maybe we are geeks, but it was exciting and fun for us to be a part of the IceBridge project.

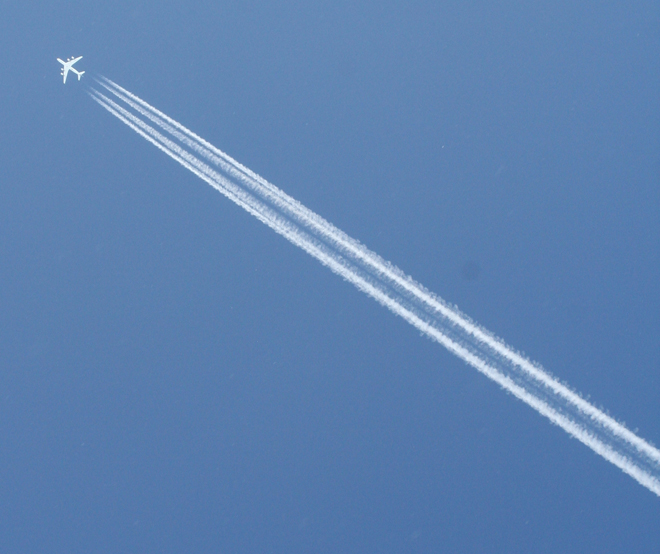
On April 14, 2010, NASA’s DC-8 flew over Summit Camp, Greenland. Credit: Christina Hammock

When not on the ice, Sonja Wolter works full-time as the operations coordinator for NOAA’s Carbon Cycle/Greenhouse Gases group in Boulder, Colo. Christina Hammock works in Space Science Instrumentation at the Johns Hopkins Applied Physics Lab in Laurel, Md., and formerly worked in the Laboratory for High Energy Astrophysics at NASA’s Goddard Space Flight Center. 

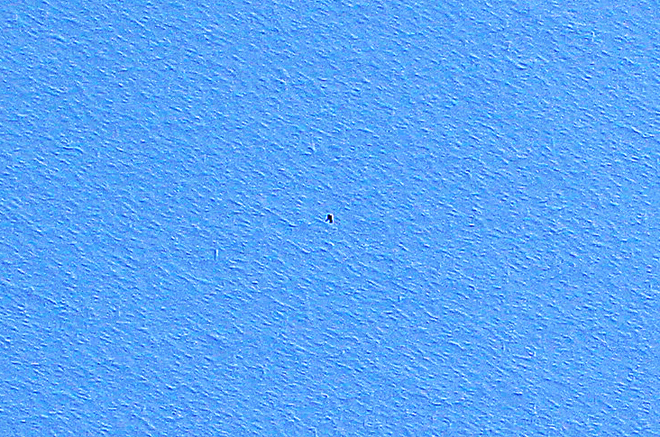
The downward-looking Digital Mapping System camera captured an image of what scientists think is the ground crew from Smmit Camp.Credit: NASA

Yes,It's Cold in Thule

On April 6, the IceBridge blog received a comment from a first-grade class in response to a March 30 post,”Notes from the Shack.” The class asked a series of questions based on Colleen McIntosh’s words and photos from Thule, Greenland, where she is working as a data analyst and programmer in a GPS Shack during NASA’s IceBridge mission. Answers to the class’ questions, below, were compiled by McIntosh.

Students: How cold is it there?

IceBridge: During the time we have been up here the temperatures have ranged from -12 to 35 F. Typically, like just about everywhere, it is colder in the morning and night, and as the sun rises higher in the sky it warms up. However, on average for the last week or so, it has been around 11 F throughout the day.

Students: Does it ever snow?

IceBridge: Yes it does snow here. However, it is extremely cold and dry up here. When the air is very cold there is a lack of water vapor. Snow is of course made of water, so if it is too dry — even though it may be very cold — it is less likely to snow. And if it does snow it doesn’t snow a whole lot. But since it is so cold up here, when it does snow, it takes a very long time for the snow to melt. So there is snow up here that may be from snowfalls months ago, it just hasn’t melted yet!
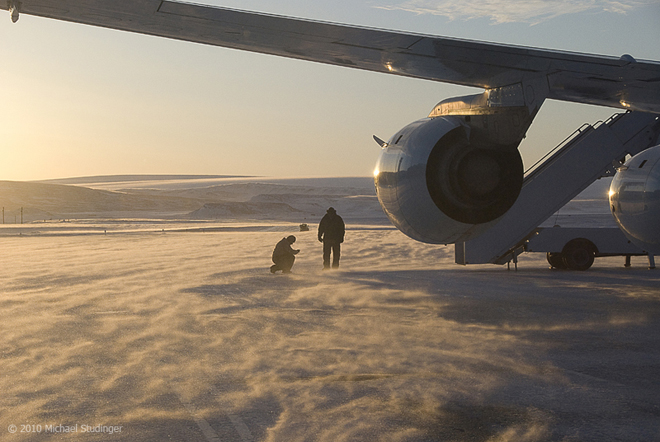

DC-8 crew members Leo Salazar and Scott Silver in blowing snow on the ramp shortly before takeoff from Thule Air Base to the fifth science flight of Operation IceBridge. Credit: Michael Studinger

Students:
How many people are working with you?

IceBridge: It depends on what you mean by working with me … working on the LVIS instrument, there are five of us (including me). On the IceBridge mission, there are about 70 people, however, they are not all up here at once. On average there about 30 people in the IceBridge group in Greenland at one time during this mission. And out of all of those 70 people, only SIX are women!! Also on the entire Air Base in Thule, including contractors, natives, and Air Force people, there are only about 400 to 500 people, only about 75 are women! Oh and there are also children up here as well, most are the native Greenlandic children, but there are a few children who are visiting their mother or father who are stationed up here in the Air Force.

Students: Is it ever springtime there?

IceBridge: They do have all four seasons up here, however spring and fall are very very short compared to winter and summer. During the summer and winter there are about three months where they have either “24 daylight” or “24 nighttime.” And then for about a month before and after winter and summer, it is either quickly getting dark or quickly getting light. And then for around a month or so in fall and spring there is “normal sunlight time.”

Students: Is that mountain made of ice?

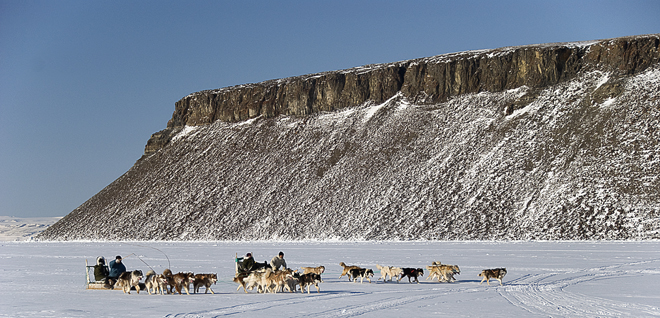
IceBridge: No, Dundas Mountain is made out of rock and dirt, just like mountains we have in the United States. It is just surrounded by and topped with a lot of snow and ice this time of year. You can climb the mountain when it is warm enough, but it is a very hard climb. Toward the top there is even a rope to help you pull yourself up the rest of the way up the mountain because it becomes very steep!

Students: How tall is that mountain?

IceBridge: The mountain is about 700 feet high

Sled dog race in Thule, Greenland, with Dundas Mountian in the background. Credit: Michael Studinger

Students: How far away from where you are standing is the mountain?

IceBridge: It is about 1.5 miles to Dundas Mountain from the GPS shack.

Students: Why does the sun look so big and so close to the Earth?

IceBridge: When celestial objects, like the sun and the moon, they get closer to the horizon and they “appear” bigger. However, this is just an optical illusion. The fact is that the illusion is dependent entirely on the visual cues provided by the terrain when the moon is near the horizon, and the lack of such cues when it’s at the zenith (directly above our heads). To prove this, try viewing the moon through a cardboard tube or a hole punched in a sheet of paper to mask out the landscape — the illusion disappears.

This time of year time of year the sun stays in the sky for almost 24 hours. Come April 17, the sun will not set here for the next three months. This is because of the way the Earth is tilted. Right now the Earth is tilting toward the sun, and because Greenland is just about at the top of the world, the Earth’s top always sees the sun. But something to note is that although the sun does not set for three months, the temperature still only reaches 60 degrees at its hottest!

Students: How do you make electricity?

IceBridge: There are several diesel generators that power the entire base. Also on the base are several cylindrical containers that hold the fuel for the airplanes that land and take off from this base. There used to be a lot more containers, but now that the base isn’t used as much as it was in the 1950s and 1960s, they have taken out these containers.