 IceBridge mission planners plot some flight lines to match the location — and sometimes the timing — of measurements collected on the ground or from satellites. This “ground-truthing” technique helps scientists calibrate and interpret air- or space-based measurements. On April 14, IceBridge flew along a previous track from the Ice, Cloud, and land Elevation Satellite (ICESat), while at the same time scientists at Summit Camp collected ground-based data. Christina Hammock and Sonja Wolter share some images from the event, and provide a look inside the life of a “Summit Camp techie.”
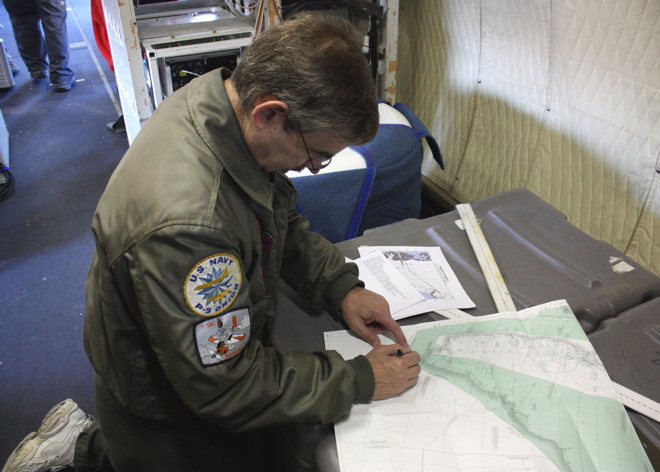
We had been anticipating this flight for almost a month because we were timing some ground-truthing measurements to coordinate with the flight (more below). We had near-daily contact with John Sonntag for a few weeks prior to the flight over Summit Camp. It took a while, but both the weather and the logistics finally came together for the flight on Wednesday, April 14.
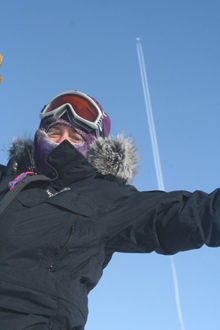
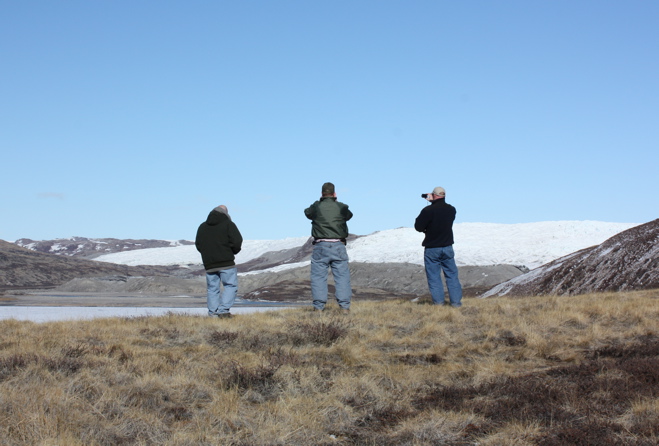
Sonja Wolter(right) from Summit Camp in Greenland was working in the field when NASA’s DC-8 passed overhead. Credit: Christina Hammock
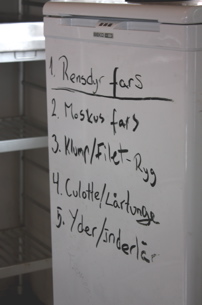
Summit Camp is a research station dedicated mainly to atmospheric and climate research. There are only five people on station during the winter months, which is divided into three phases, late August to early November, early November to early February, and early February to late April. During the summer (late April to late August), the station population goes up to 25-50 researchers and support staff (starting a week from today with the arrival of an LC-130 bringing about 25 people – ack!)
Our crew includes a Station Manager — Ken Keenan; a heavy equipment operator — Geoff Miller; a power plant mechanic — Luke Nordby; and the two of us — the Summit science technicians. When we have an involved task like the IceBridge coordination, everyone helps get us out the door.
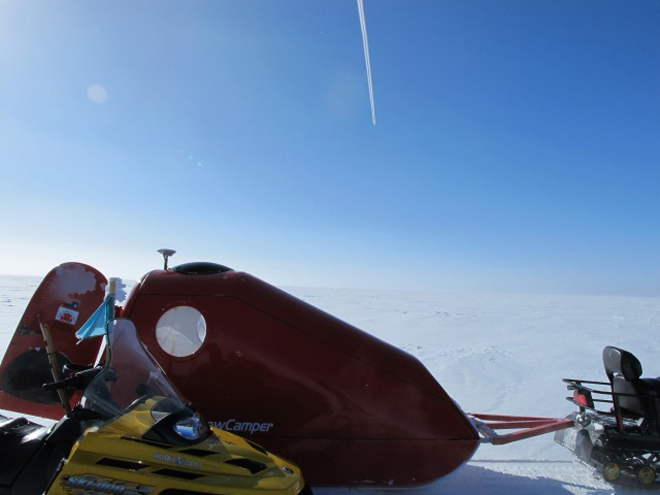
Gear for the IceBridge and ICESat transect at Summit Station included two snowmobiles, an emergency snow camper, a GPS system and a bamboo pole to make the measurement. Credit: Sonja Wolter
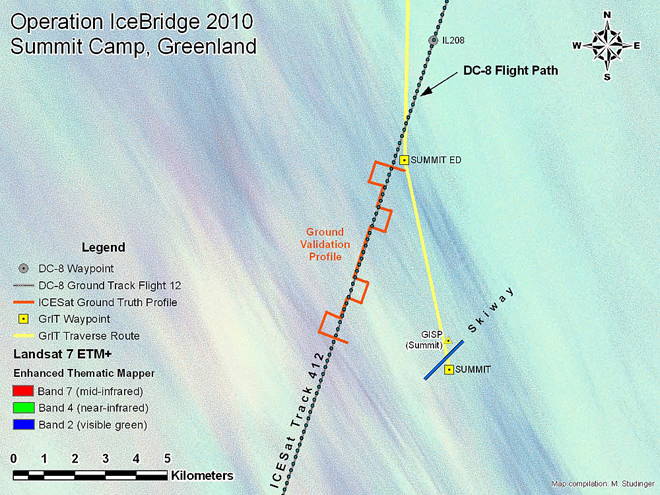
As science techs, we carry out and maintain all the ongoing experiments at or near camp. One of these experiments is the ICESat transect, which is (or was) a ground-truthing measurement for the now-defunct ICESat. The Summit ICESat transect is a zigzagging path of bamboo poles that underlies one of the swaths of the icecap that an ICESat overpass used to include. Once per month, we manually measure the snow depth at the poles and also get exact GPS coordinates at these spots.
To do this, we drive two snowmobiles out and cruise (well, putt putt) along the line poles (at -35 F this week). We don’t know for sure, but we’re guessing the round trip is about 8 miles, and it takes us 2.5 to 3 hours. Although the ICESat instruments are no longer working, we have carried on with the transect measurements to continue the data set for this snow accumulation study. This month’s measurements had the extra bonus of being coordinated with IceBridge for verification of their measurements.
During the winter, the last brush with the outside world (not including the world wide web and telephone, that is) is the Twin Otter flight that comes to pick up the outgoing crew after a week of turnover. So, seeing the NASA DC-8 plane was the first reassurance that people are in fact still out there. Maybe we are geeks, but it was exciting and fun for us to be a part of the IceBridge project.
On April 14, 2010, NASA’s DC-8 flew over Summit Camp, Greenland. Credit: Christina Hammock
When not on the ice, Sonja Wolter works full-time as the operations coordinator for NOAA’s Carbon Cycle/Greenhouse Gases group in Boulder, Colo. Christina Hammock works in Space Science Instrumentation at the Johns Hopkins Applied Physics Lab in Laurel, Md., and formerly worked in the Laboratory for High Energy Astrophysics at NASA’s Goddard Space Flight Center.

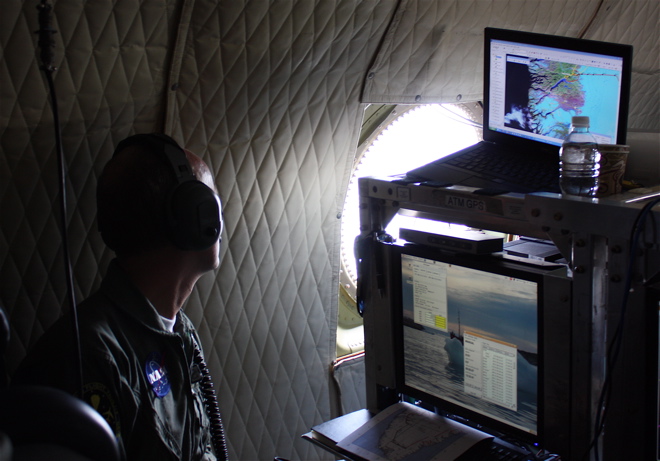
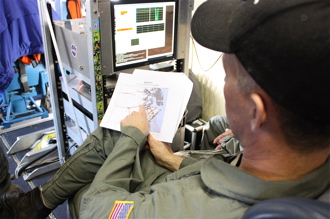
 During an IceBridge science flight, a GPS instrument onboard collects measurements of the aircraft’s position. Scientists later combine the positional information with other data, such as surface elevation from the
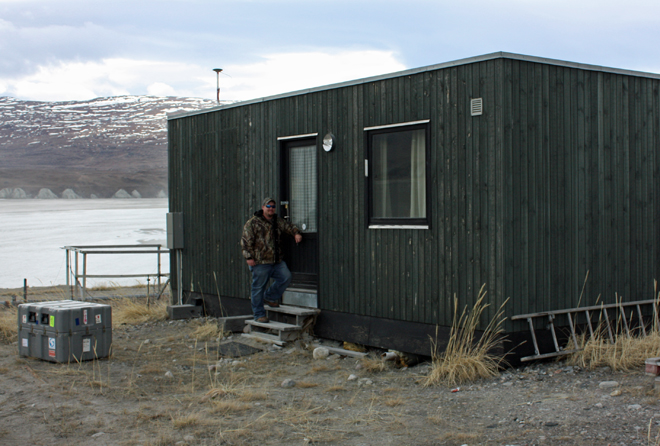
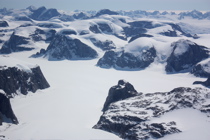
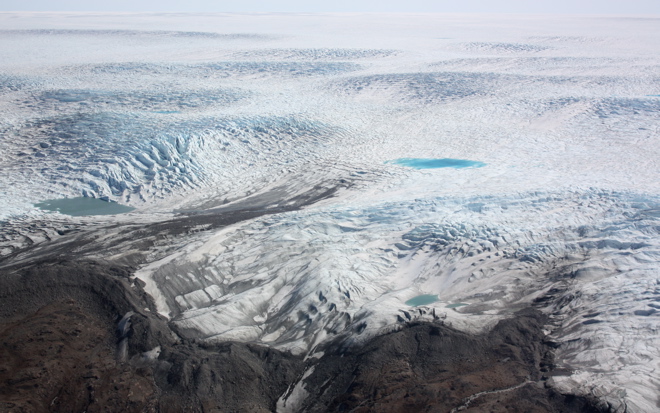
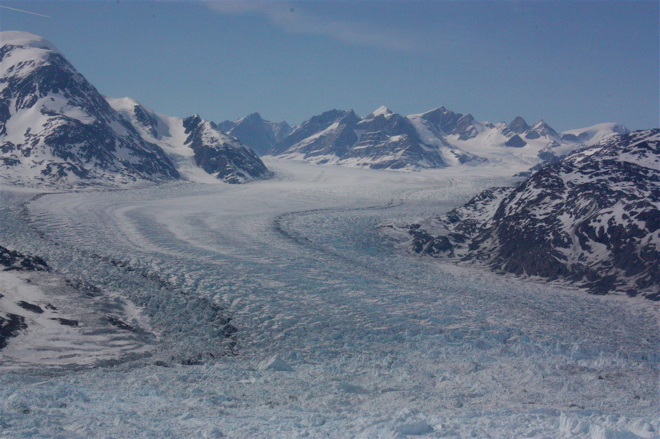
 Scientists have long been tracking Greenland’s outlet glaciers, yet aspects of glacier dynamics remain a mystery. One school of thought was that glaciers react to local forces, such as the shape of the terrain below. Then, researchers noticed that glaciers in different regions were all thinning together, implying a connection beyond local influences. Scientists have posed theories about what that connection might be, but the jury is still out.
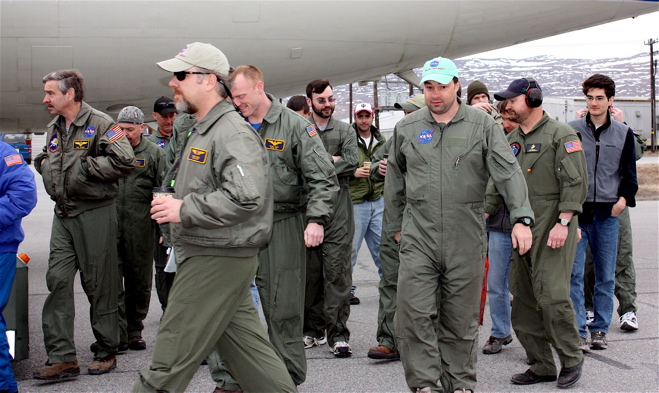


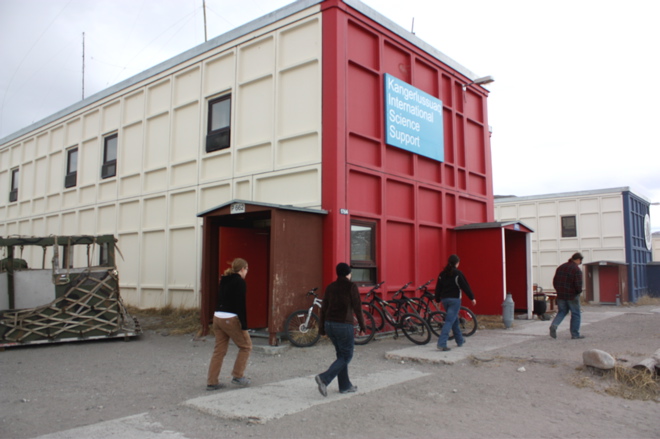
 KANGERLUSSUAQ – Kangerlussuaq International Science Support is a red, boxy building that doubles as a laboratory and a hotel for polar researchers. Upon my arrival it was quiet, nearly empty. By the end of the week, however, an influx of scientists staging field expeditions quickly filled the kitchen and halls.
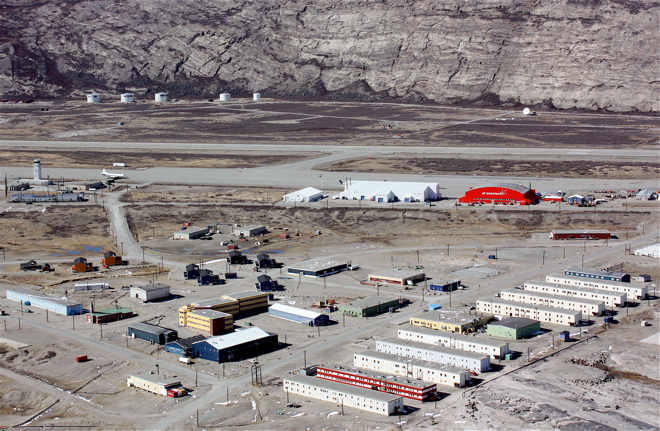

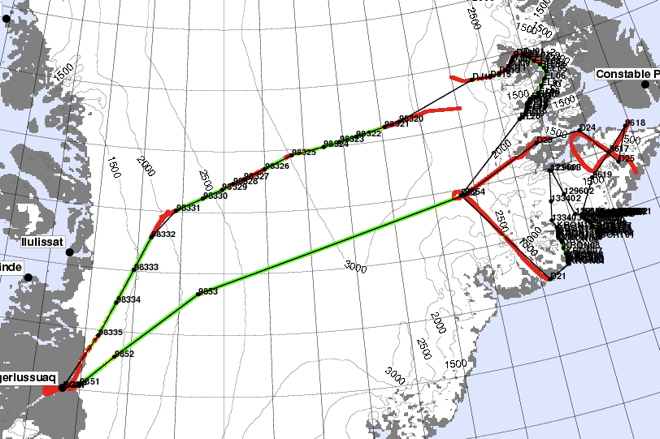
 KANGERLUSSUAQ — IceBridge flight planners woke this morning to news that volcanic ash from Iceland had moved over almost half of Greenland, blocking flight lines to survey outlet glaciers along the southeast coast. In response, the team came up with a shortened flight plan that called for limiting the mission to western targets.
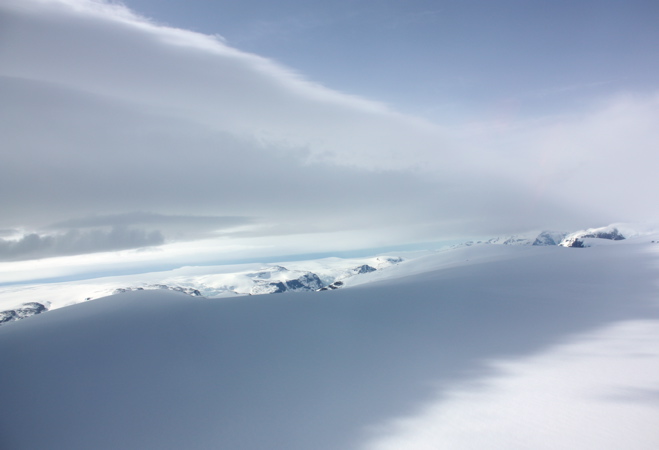
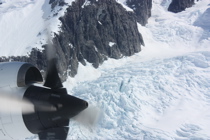
 KANGERLUSSUAQ — There was a rumor that the flight on Friday, May 10, would be among the most scenic of the 2010 Arctic campaign. The high-priority flight along Greenland’s southeast coast required clear weather for pilots to maneuver along the sinuous glaciers at low altitudes. We were fortunate. The first opportunity to fly from Kangerlussuaq with the P-3 on this Arctic 2010 campaign turned up clear skies and relatively balmy temperatures, and we lifted off for Geikie Plateau shortly after 8 a.m.