NASA Readies for Spring 2010 Ice Bridge Campaign

From: Kathryn Hansen, Science Writer, NASA’s Earth Science News Team


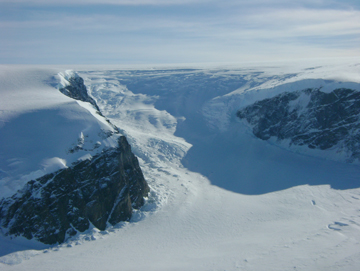
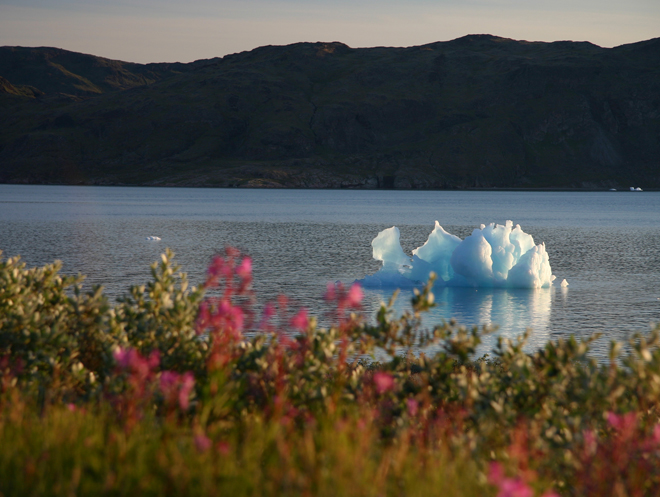
Credit: John Sonntag/Wallops Flight Facility

In August 2008, NASA scientist John Sonntag, of NASA’s Wallops Flight Facility in Wallops Island, Va., captured this view of a small iceberg as it moved down the Narsarsuaq fjord in southern Greenland. “I spent about half an hour watching that little berg, which was in the process of disintegrating during the time I was watching,” Sonntag said. “It went from a complete, small berg to a collection of floating ice rubble within that small span of time. The place was so quiet that the noise of the berg softly coming apart was the only sound present.”

Sonntag’s observation took place during the 2008 NASA and Center for Remote Sensing of Ice Sheets (CReSIS) airborne deployment in Greenland. This spring, Sonntag and other scientists return to the Arctic for big picture and little picture views of the ice as part of NASA’s six-year Operation Ice Bridge mission — the largest airborne survey of Earth’s polar ice ever flown — now entering its second year. The project team is finalizing flight paths over Greenland’s ice sheet and surrounding sea ice, where scientists will collect measurements, maps and images from a suite of airborne instruments. Such information will help scientists extend the record of changes to the ice previously observed by NASA’s Ice, Cloud, and land Elevation Satellite (ICESat), while uncovering new details about land-water-ice dynamics.

NASA aircraft have made numerous science flights over Greenland, most recently during the spring 2009 Ice Bridge campaign and also in 2008 as part of the NASA/CReSIS deployment. Smaller-scale airborne surveys have been made by William Krabill, of NASA Wallops, and colleagues nearly every spring since 1991.

Visit the Operation Ice Bridge Web page throughout the spring 2010 campaign for news, images, and updates from the field. Flights from Greenland are scheduled to begin no sooner than March 22.


Up and Down Thwaites Glacier


From: Kathryn Hansen, Science Writer, NASA Goddard Space Flight Center


NASA’s DC-8 returning from its second Antarctic flight of the mission.  (NASA/Steve Cole)


On Sunday, Oct. 18, researchers and crew flew on the DC-8 aircraft’s second Antarctic flight of the Operation Ice Bridge Campaign. The mission was dedicated to reflying areas of Thwaites Glacier previously mapped by the ICESat satellite to see how the glacier has changed.


The team took advantage of the good weather, flying at low altitude, spending about three hours surveying the glacier with the Airborne Topographic Mapper (ATM), the campaign’s primary instrument. ATM pulses laser light in circular scans on the ground, which reflects the pulses back to the aircraft. The laser data are then converted into elevation maps of the ice surface.


Another instrument, the Multichannel Coherent Radar Depth Sounder (MCoRDS), collected thickness measurements over the glacier. The instrument team’s initial analysis of the data turned up unexpected depth.


On Sea Ice


From: Kathryn Hansen, Science Writer, NASA Goddard Space Flight Center


The Operation Ice Bridge team is just about to start science flights over two main Antarctic targets: ice sheets and sea ice. Thorsten Markus, principal sea ice investigator for the mission, chatted with me at NASA Goddard in Greenbelt, Md., about sea ice and how measurements from the air will differ from what’s possible on the ground or from space.


We hear a lot about sea ice in the Arctic. How is sea ice in Antarctica different?
 

Markus: The immediate response is that the Antarctic sea ice is experiencing a decline in cover. The problem with Antarctica is that you don’t have an easy one-sentence answer. The Arctic is sort of easy: the ice is decreasing, and we’ll eventually see ice-free summers. In Antarctica, the system is more complex. Next to West Antarctica, sea ice is decreasing. Around the Peninsula it’s also decreasing and probably getting more snowfall, so we see big changes there, too. But for more of the continent, we actually see a slight increase in sea ice. It has to do with the ocean underneath the ice, the ozone hole, and a combination of both. A big difference is also that Arctic sea ice is centered at pole with land masses around it. In Antarctica, we have the opposite scenario:  A landmass centered at the pole, the Antarctic ice sheet, and sea ice around it in full contact with the world’s ocean.


What are the potential global impacts of changes to Antarctica’s sea ice?


Markus: Sea ice formation and melt have a really strong impact on ocean circulation, which acts like a huge heat pump keeping our climate stable. This “thermohaline circulation” is driven by temperature and salinity. The interesting part of this circulation is that the deep, bottom water masses of the ocean only make contact with the atmosphere only at polar latitudes, in the Arctic or the Antarctic. Change ocean salinity — by growing or melting sea ice, which is inherently salt-free — and you can affect global circulation. The process is complex, but that’s basically why it’s so critically important.


Sea ice in Antarctica is also important for the global energy balance, just as in the Arctic. It’s a white surface that reflects solar energy, which affects Earth’s whole energy system.


Do we have a good idea of what the thickness is?


Markus: There are some measurements from drillings or from icebreakers, but those are snapshots in time and very sparse. The area you cover with a ship is excruciatingly small. So we do have some idea, but it’s not great. With the ICESat satellite and the Operation Ice Bridge airborne campaign, we have a chance to get ice thickness measurements over larger scales than we have been able to get before.


We have more instruments on the plane than we have on the satellite. So while aircraft don’t provide nearly the coverage of satellites, you do get additional information — such as thickness — that should be really useful.


What sea ice information will we get from the aircraft campaigns?


Markus: We have a laser altimeter, Bill Krabill’s instrument, that’s similar to ICESat and is the primary instrument of the mission. The laser bounces off the surface, whether it’s snow or ice, and provides a measure of surface elevation. But we also have radars on this plane, developed by the University of Kansas, which penetrate the snow. If you look at the difference between the laser and radar results, ideally you get the snow depth.


Accurate snow depth is important for estimating sea ice thickness, which is done with a conceptually simple calculation: if you know how much ice is above the water, then you can estimate how much is below the water. The problem occurs when you have snow on top, which submerges the ice to some extent.


Snow depth is a bigger issue for Antarctica because we have overall thinner ice and more snow than we have in the Arctic. It can vary quite significantly — anywhere from zero to a few meters — and it can be so heavy that the ice itself is submerged below sea level and you get flooding on the interface.


ICESat does not have radar, so in this regard we are getting a value-added product in Ice Bridge. In an ideal world, people would put a radar altimeter together with a laser altimeter — something you can do on a plane, but not as easily on a satellite.

So there’s a need to continue flying airplanes?


Markus: Yes. Some people are saying “Wow, we can do everything with airplanes,” which is wrong because the Antarctic is huge. It looks great on paper because all the flight lines that we draw on maps are pretty thick. But if you drive with your car across the United States and measure something, does this represent the entire United States? If you drive too far south, you miss the Rockies, and if you drive too far north, you miss the desert Southwest, so you get a completely wrong picture of the United States.


We can, however, look at critical areas in the sea ice, as well as over the ice sheets and see how they are changing in the time between ICESat and ICESat-II, so that we are not completely blind. 


Why is it important to have that continuous coverage in Antarctica?


Markus: We want to establish a consistent long-term record so that we have continuous coverage. A gap in data leaves you with just a snapshot in time and poses a problem. For example, if you measured Washington, D.C.’s temperature in December 1990 at 70 F and then again on that date 10 years later at 30 F, you might assume a dramatic cooling trend. We want to avoid a similar misinterpretation of changes in Antarctica. We now have five years of data from ICESat, but we have just started to understand the processes.


Have you been to Antarctica?


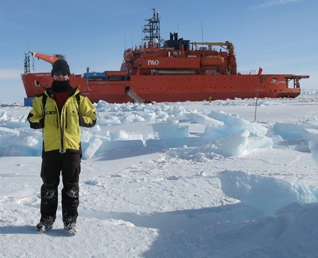
Markus: Yes, several times for field work. On an icebreaker mostly.


The irony is that from a plane, as well as from on the ice, it looks and feels like really solid ground.  It looks perfectly still. You’re in an ice desert.  On previous field expeditions that were on the ice, we would take out drills and hammers and more sophisticated instruments and do our work; it looks pretty much like a construction site. The captain would tell us afterward that we drifted 10 miles while we were working. It’s just incredible if you think about it: standing on ice we would measure its thickness with all these drills and know we were on 15-20 centimeters of ice, and that underneath is 4,000 meters of water. You’re floating out there, it’s a terribly cool thing.


What about from the sky?


Markus: Ice Bridge flights won’t land in Antarctica, but even from a plane, sea ice looks static. An animation compiled from satellite images of Antarctic sea ice shows you how dynamic the sea ice is — how it looks like a living thing. In Greenland, I showed a similar movie of Arctic sea ice to the pilots while we were flying and they were amazed when they saw what’s really happening. Only since satellites did people get a better understanding how dynamic the sea ice is.
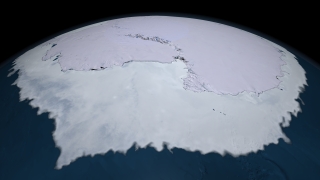


Sea ice surrounding the Antarctic landmass is dynamic, shifting in location, extent and thickness. This animation shows the sea ice motion around Antarctica from June 4 through Nov. 18, 2005. Credit: NASA/Goddard Space Flight Center Scientific Visualization Studio
  

Satellite Laser Fires Up for Campaign


From: Kathryn Hansen, Science Writer, NASA Goddard Space Flight Center


On Wednesday, Sept. 30, engineers, scientists and mission operations personnel gathered around a single computer monitor tucked away in a corner of a building at NASA Goddard Space Flight Center in Greenbelt, Md. They were waiting for an indication that communication was established between the satellite ground station in Boulder, Colo., and NASA’s Ice, Cloud, and land Elevation Satellite (ICESat) in orbit. Once a connection was made, scientists can “command on” one of the satellite’s lasers and resume the collection of critical ice elevation data.

ICESat has been collecting elevation information of Arctic and Antarctic ice sheets and sea ice since 2003, but it’s uncertain how much longer the satellite’s last of three lasers will operate. So, scientists this fall are using ICESat to calibrate similar measurements from aircraft flights over targets in Antarctica during Operation Ice Bridge. The aircraft campaign will help bridge the data gap until ICESat-II is launched.

As the satellite made a first pass over Antarctica at about 4:15 p.m. EDT, a glitch in communications foiled the first contact. The satellite’s next pass over Antarctica gave ground station managers at University of Colorado’s Laboratory for Atmospheric and Space Physics in Boulder, Colo., enough time to fix the glitch.

At 5:50 p.m., station connection with the satellite was a success and “all commanding was executed as planned,” said David Hancock of Wallops Flight Facility in Wallops Island, Va., instrument manager for the satellite’s GLAS instrument that houses the lasers.

“We now have two ‘laser on’ campaigns per year,” said Shelley Thessen, of ICESat mission operations at Goddard. “It’s a common occurrence, but I still get a lump in my throat every time.”

Subsequent passes over Antarctica were also successful. Scientists have started analyzing the science data returned from the first pass, seen in the figure above as a blue line across central Antarctica.

“On this first pass, there was a small amount of thick cloud cover over the ice sheet,” said Jay Zwally, ICESat project scientist at Goddard. “Accurate measurements of the surface elevation were obtained from 93 percent of the 23,297 laser pulses over the ice sheet.”


ICECAP Investigates East Antarctica


From: Kathryn Hansen, Science Writer, NASA’s Earth Science News Team

Operation Ice Bridge scientists and crew completed 21 successful flights over West Antarctica and returned home in time for Thanksgiving. Still flights over the icy continent continue. Scientists with another field campaign — Investigating the Cryospheric Evolution of the Central Antarctic Plate, or simply ICECAP — are making ongoing airborne investigations over East Antarctica.


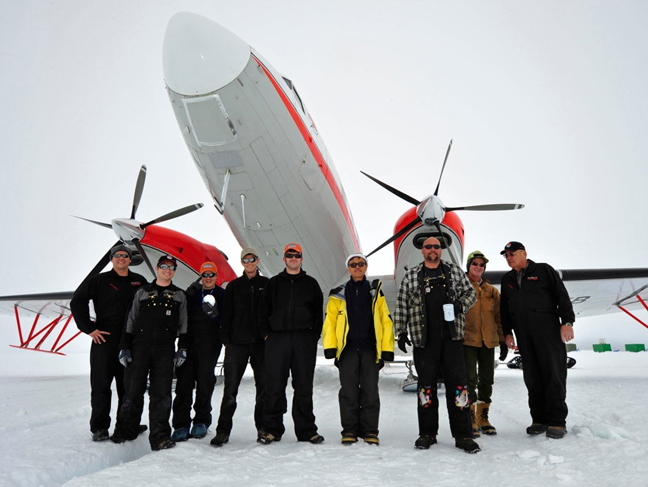
The ICECAP Casey/DDU survey team at Casey from left to right: Dean Emberley (KBA), Jamin Greenbaum (Texas), Jorge Alvarez (Texas), Andrew Wright (Edinburgh), Duncan Young (Texas), Young Gim (JPL), Dave Meyer (KBA), Noel Paten (AAD), Ray Cameron (KBA); not pictured Glenn Hyland (AAD). Credit: Todor Iolovski (Bureau of Meteorology)


ICECAP, for which NASA’s Ice Bridge is funding some of the flights, is an international collaboration with principal investigators from University of Texas at Austin’s Jackson School of Geosciences, the University of Edinburgh, and the Australian Antarctic Division. The goal is to use airborne instruments to chart ice-buried lowlands, which could show how Earth’s climate changed in the past and how future climate change will affect global sea level.

Where have they flown and what have they observed? ICECAP’s University of Texas researcher Duncan Young provided some updates from the field:

Dec. 8, 2009

Right now we are preparing to begin our shift from McMurdo to Australia’s Casey Station via the joint French-Italian base on top of the ice sheet, Concordia, after completing our ICECAP flights out of McMurdo today with Flight 16, right down the maw of Byrd Glacier. Tomorrow we will use our survey plane to move people and cargo to Concordia, surveying all the way, and then return to McMurdo. On Wednesday we will move the rest of our people using our aircraft all the way to Casey from McMurdo. It is a complex multinational ballet, where the timing of weather at locations over 1,250 miles (2,012 kilometers) apart is critical. Then we will begin our ICECAP/Ice Bridge operations out of Casey Station with our Australian colleagues.

Dec. 22, 2009

Using an upgraded DC-3, we have completed five flights, each about seven hours long out of Casey Station, in addition to the 20 flights we completed out of McMurdo Station. Three of these Casey based flights have flown over 2,330 miles (3,750 kilometers) of ICESat tracks, over the rapidly lowering Totten and Denman Glaciers.


Denman Glacier; Credit: Jamin Greenbaum, University of Texas at Austin


T
oday we are conducting an ambitious 10-hour flight to finish off our Casey work for this season. We will be flying to Concordia Station in the center of the ice sheet, picking up fuel and base GPS data we have been gathering over the past ten days to help improve our aircraft positions, and thus the surface elevations we have been measuring.

Then we will fly along a ‘tie-line’ to connect several transects we flew last season to the Dome C ice core. By tracking ice layers in the radar data, we have a chance to find where some of the oldest ice in Antarctica might lie, perhaps more than a million years old. This old ice would contain greenhouse gasses from the past, leading to a better understanding of climate change if it is drilled. The aircraft will then return to Casey station along our last targeted ICESat line along Totten Glacier.

After this flight, we plan to move to Dumount d’Urville Station in time for a French Christmas dinner — if the katabatic winds there allow it …


A Splendid Day for Flying Glaciers


From: Kathryn Hansen, Science Writer, NASA Goddard Space Flight Center


A last-minute change in flight plans made for another great science flight on Nov. 4. Initial plans were to make a high-altitude flight, according to program director Jim Yungel of NASA’s Wallops Flight Facility.  But a forecaster in the Punta Arenas airport weather office advised crew of the potential for weather to interfere with the high-altitude measurements for the mission’s LVIS instrument.


With a new flight plan in place, NASA’s DC-8 took off just a few minutes after the scheduled 11 a.m. departure time. The new plan called for low-altitude flights over the Antarctic Peninsula.


“The forecaster was completely correct,” Yungel wrote to colleagues after the flight. “We flew into sunny conditions with occasional very light high cirrus over flight lines, resulting in an outstanding data set over the Larsen Ice Shelf and many impressive glaciers.”


Instruments that collect data at lower altitudes, including the Airborne Topographic Mapper, had a successful 11.3-hour flight.


Much of this flight surveyed a grid over the Larsen C Ice Shelf,” Yungel wrote. “Later in the flight we surveyed several significant glaciers in the central Peninsula area, including the Atlee, Flask, Crane, Hektoria, and Drygalski glaciers. It was a splendid day for flying glaciers!”


Despite the busy flight, Yungel managed to capture these images of the landscape from the aircraft window …