A Balance Between Two Extremes

By Nathan Kurtz, IceBridge scientist, NASA Goddard Space Flight Center/Morgan State Univ. 

Something quite unexpected happened to me during this IceBridge campaign. In fact, something was missing: much of the sense of awe and wonder which I had on my previous three missions was gone. Once there was excitement to see new and inspiring sights, but now there was routine and a sense that I had seen this all before. Despite spectacular views of the polar landscape outside the window of the DC-8 aircraft, I was more often concerned with analyzing data from past IceBridge campaigns than taking time out to look outside.

Bothered by my inability to be moved by my chosen subject of study I forced myself to stare out the aircraft window in hopes that renewed interest would strike. As the silent scenes of the ice scrolled by below me a quote by horror writer H.P. Lovecraft kept running through my head like the background score of a movie: “The oldest and strongest emotion of mankind is fear, and the oldest and strongest kind of fear is fear of the unknown.” After a long bout of reflection I finally realized what the connection was: my sense of awe and wonder wasn’t actually missing, it had simply been hidden away. Only by finding this missing aspect again could I finally experience the renewed interest I was looking for and incorporate this into a deeper respect for the significance of my role as a scientist in the IceBridge mission.
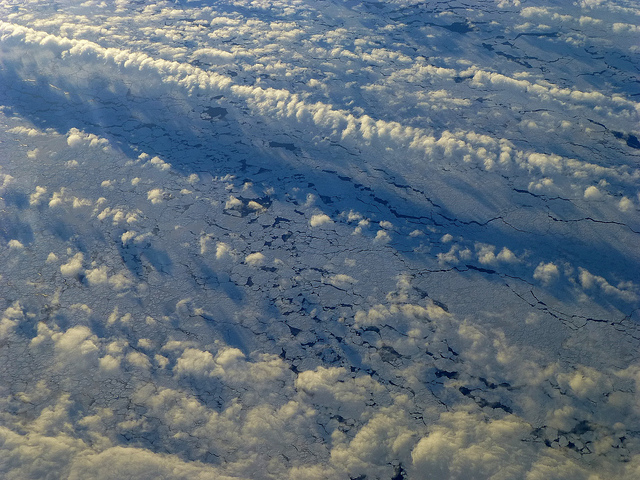
Low-lying clouds over sea ice on the Bellingshausen Sea.
Low-lying clouds over sea ice on the Bellingshausen Sea. Credit: NASA / Maria-Jose Vinas

Wrapped in the relative safety of the airplane and content with my knowledge of the physical processes which formed the massive ice sheets around me I had only a vague feeling of missing something. This missing aspect was fear. My familiarity with everything around me caused me to be complacent and lose a healthy sense of fear for the world outside my window. I had become the consummate scientist who fashions the world into nothing more than a series of numbers, equations, and rules. Once the unknown was made known my sense of fear was gone as everything seemed to be explainable according to well-described laws. Such is the dilemma of the scientist: one may be criticized as being arrogant for making sweeping claims of knowledge of unbelievably complex phenomenon, yet possessing a high confidence is also necessary to know that it is indeed possible and correct to make such claims with sufficient data.

This is in stark contrast to my previous experiences flying with the IceBridge mission. In my first flight over the Antarctic sea ice two years ago I felt an indescribable rush of fear and excitement as a vast and remote new world opened up before my eyes. I had never seen anything like it before and felt terrified viewing the harshness of the region. I knew that I’d have little chance to survive if I left the safety of the airplane. I also felt that all of the scientific facts I had read about the polar regions had done little to capture the complexity of everything around me. That I had much to learn before I could properly do my job as a scientist and make broad claims about the state of the polar regions based on the data we were collecting.

Somewhere between these two extremes of fear lies a balance that needs to be attained. Some fear is healthy, it allows one to have humility and respect for forces of nature which are beyond the powers of people to control, but that it is also possible to understand these forces in order to live in harmony with them. Too much fear is unhealthy and can lead to a paralysis of thought and action and distortion of the truth to protect one from an uncomfortable reality. These two extremes of fear seem to define an ongoing conflict between science and society, particularly with regards to the polar regions. In recognizing this, it also gives the potential for scientists to form a bridge between these two conflicting groups.
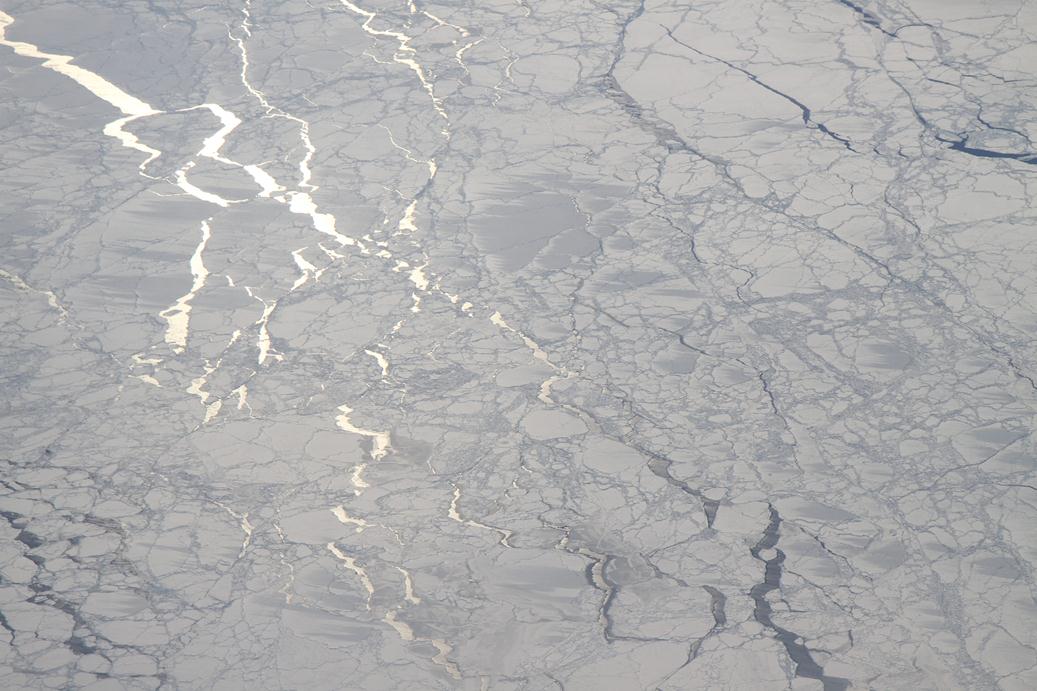
Sunlight reflecting off refrozen leads in sea ice in the Bellingshausen Sea.
Sunlight reflecting off refrozen leads in sea ice in the Bellingshausen Sea. Credit: NASA / Jefferson Beck

In my experience, most people see the polar regions in a generally negative light, one that is based on fear. Nowhere is this more prevalent than in the arts which are a good barometer (and influential aspect) of the prevailing view of society. Classic writers such as Lovecraft and Edgar Allan Poe wrote stories about the polar regions and portrayed them as places filled with supernatural terrors. This attitude can be seen in contemporary literature as well. For example, popular author George R.R. Martin uses a cold region beyond a great wall of ice as a place where unseen evils lie in wait to tear down a society excessively focused on politics and power games. The artist Edwin Landseer, mostly known for his pleasing pictures of animals, chose to use the polar regions as the backdrop for his controversial painting ‘Man Proposes, God Disposes’ which gruesomely depicts the end of an ill-fated polar expedition. A plethora of horror movies such as The Thing and 30 Days of Night use the polar regions as a setting for tales of terror. These are but a few examples of the negative fear-based depiction of the polar regions in our culture. But is the prevailing view of the polar regions only this and nothing more, a bleak place for us to project our fears?

Aside from only one happy movie (Happy Feet), I can think of positive portrayals of the polar regions mainly in science texts and documentaries. Science is providing (to paraphrase Carl Sagan) a candle in the dark to make a feared unknown into something known. One of these feared aspects is the big question of what changes are happening in the polar regions and to what extent are these changes influencing the global climate. From my own studies of sea ice I have seen large decreases in both the extent and thickness of Arctic sea ice, while the Antarctic sea ice cover has shown a small increase in extent over the last three decades and no statistically significant trends in thickness. Models show that the Antarctic sea ice extent may counter-intuitively increase over the next few decades under a warming climate, but if the warming continues it will begin to decrease again. A decrease in the global coverage of sea ice is expected to cause changes to the global deep ocean circulation as well as increase the amount of absorbed solar radiation which will lead to increased global temperatures. These are simple facts obtained from scientific observations and model physics. Facts such as these are not scary, and if utilized properly they should serve as vital sources of information. Not to paralyze our thoughts in fear, or to give a false illusion of control. But if used with a sense of humility they can be used to promote and guide positive and constructive action.

This is where the IceBridge mission can play a role, and something I realize this trip has inspired me to work towards. Confronting the unknown through exploration and gathering of scientific facts. Presenting the facts as accurately possible is the only way to make the unknown known and unite the world of science with the human element. That is, to allow scientific knowledge to be used as a tool to improve the lives of people. Having spent several weeks with the unique and interesting people that make up the IceBridge mission I am sure that we can do things to the best of our ability. To shine some truth and light on the unknown and work towards getting rid of a climate of fear.
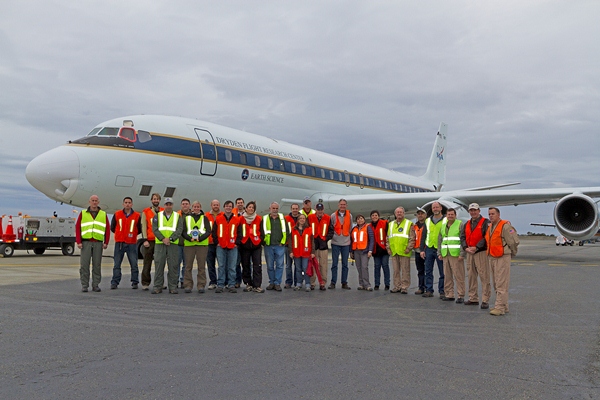
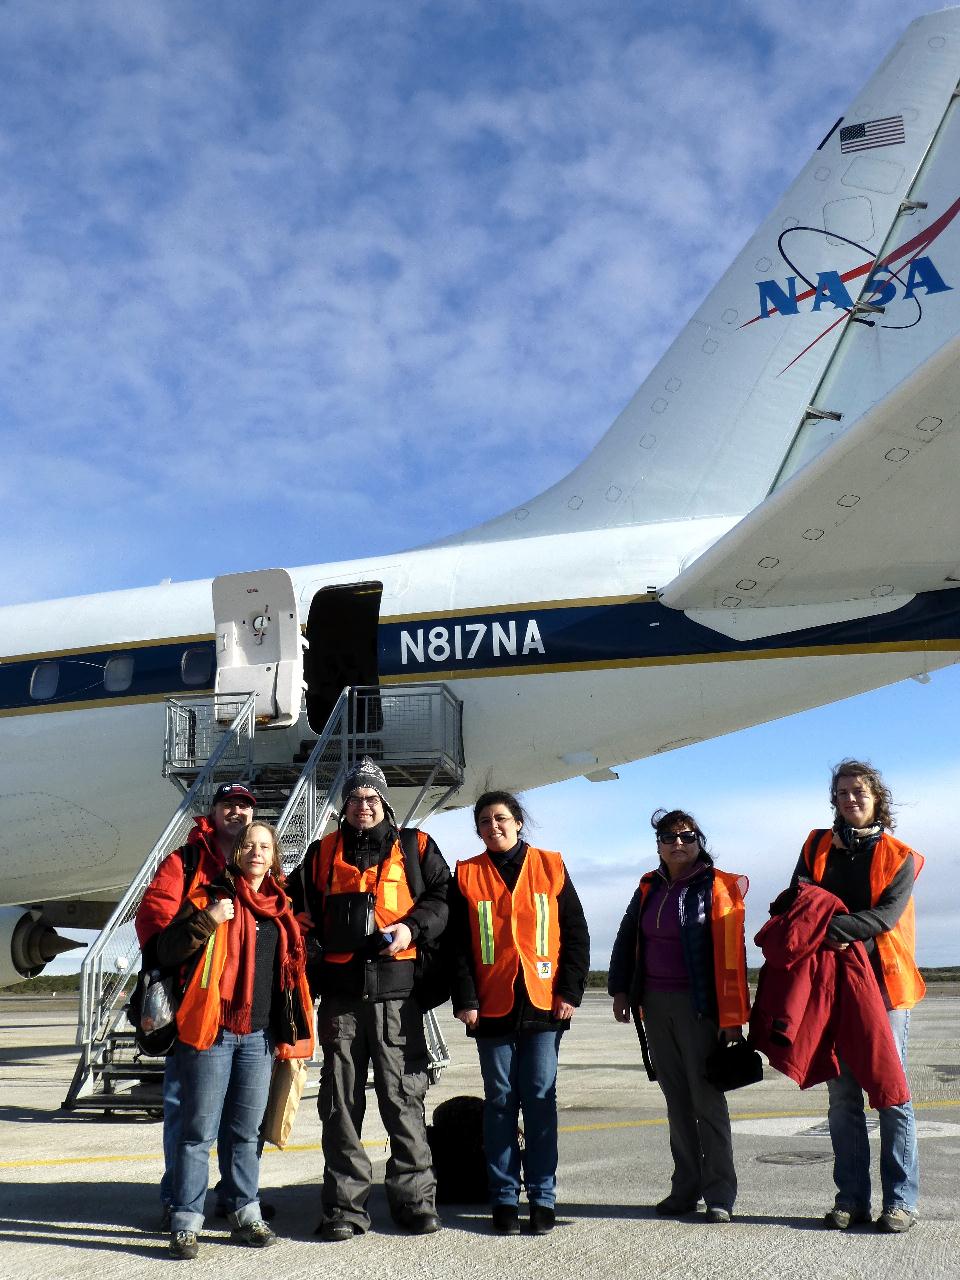
Group photo of IceBridge team in front of the NASA DC-8.
Group photo of IceBridge team in front of the NASA DC-8. Credit: NASA

Seeing Data Collection Firsthand

By Donghui Yi, Remote Sensing Scientist, NASA Goddard Space Flight Center

Punta Arenas, Chile is a city with friendly people, rich history, beautiful beach, and spectacular lenticular clouds. Participating in IceBridge’s 2012 Antarctic campaign based at the Punta Arenas airport was an amazing experience for me. I study Airborne Topographic Mapper (ATM) laser waveforms and different tracking algorithms and their influence on elevation measurements. Participating in IceBridge flights let me see ATM instrument setup and operation firsthand.

The flights I was on covered the Antarctic Peninsula, Bellingshausen and Amundsen seas, West Antarctic ice sheet, Weddell Sea, Ronne and Filchner ice shelves and a portion of the East Antarctic ice sheet. The highest latitude we reached was over 86 degrees south. From NASA’s DC-8 aircraft, the beauty of Antarctica’s sea ice, coast, mountains and ice sheets is breathtaking. From a typical survey height of 500 meters above surface, you see an Antarctic you cannot see from surface or from a satellite image. It makes the over 11-hour flight an exciting and enjoyable journey each time.

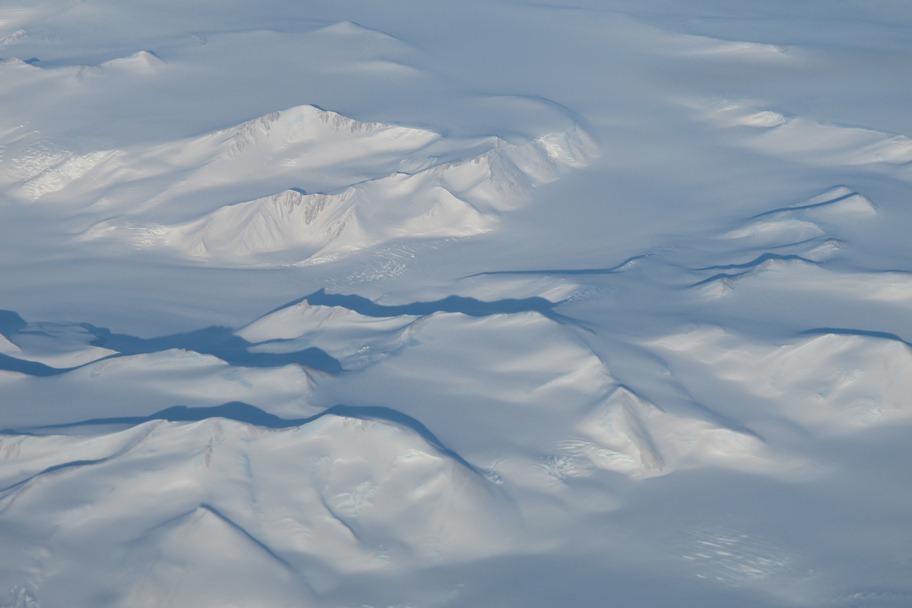
Antarctic mountains seen from the DC-8
Antarctic mountains seen from the DC-8. Credit: NASA / Donghui Yi

It was also amazing to see the spatial and temporal variability of the clouds over Antarctica, which can go from the surface to several kilometers high and can be continuous or have numerous layers. Even between the surface and a typical survey altitude of 500 meters, there can be so many layers in between, low and high. The IceBridge team and airport meteorologists did an unbelievable job predicting where clear sky regions would be, a critical part for the missions’ success. Without this critical information, the management team would not be able to make the right decisions to determine survey passes.

The flight crew and instrument engineers are wonderful people to work with and their skills and dedication to the project command our utmost respect. The firsthand experience of sea ice and ice sheet data collection is invaluable to my research. This trip itself was a bridge between a scientist and engineers.

Scientific Snapshots: Using IceBridge Data in the Field

By George Hale, IceBridge Science Outreach Coordinator, NASA Goddard Space Flight Center

Every IceBridge flight adds to a growing collection of geophysical data. Gigabytes of information on surface elevation, ice thickness and sub-ice bedrock topography are collected, but collecting the data is only the beginning of the job. After each campaign, information is downloaded from the instruments and processed to be delivered to the National Snow and Ice Data Center in Colorado, who store IceBridge data and make it freely available to the public.

Preparing data to send to NSIDC is a long and painstaking process, usually taking about six months. Before even starting data processing for the Airborne Topographic Mapper, IceBridge’s laser altimeter instrument, it’s necessary to calculate aircraft position and attitude and even mounting biases on ATM’s laser itself. “Once all the calibrations take place, the processing of all the ATM lidar data can take place,” said ATM program manager Jim Yungel. After that, processing to remove returns from clouds and ice fog and quality checking takes place. And because there are two ATM lidars, one narrow-band and one medium-band, this process is done twice and the results are compared.

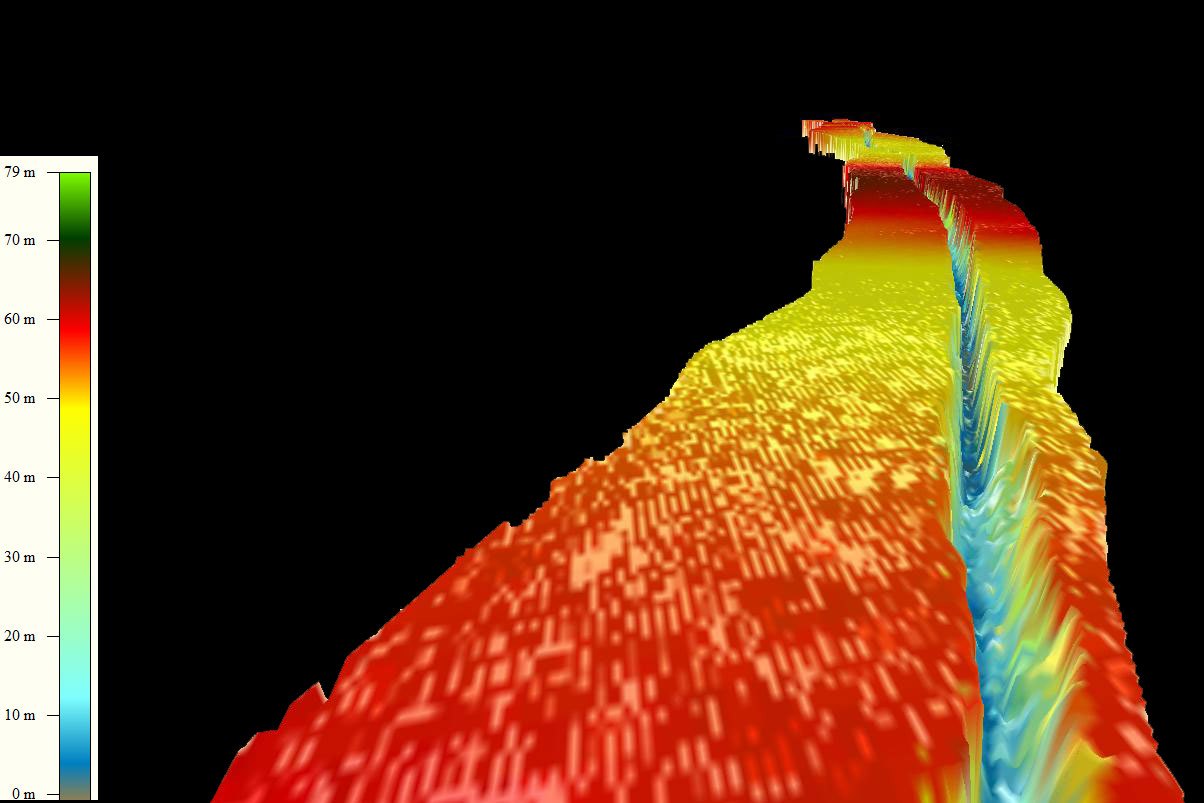
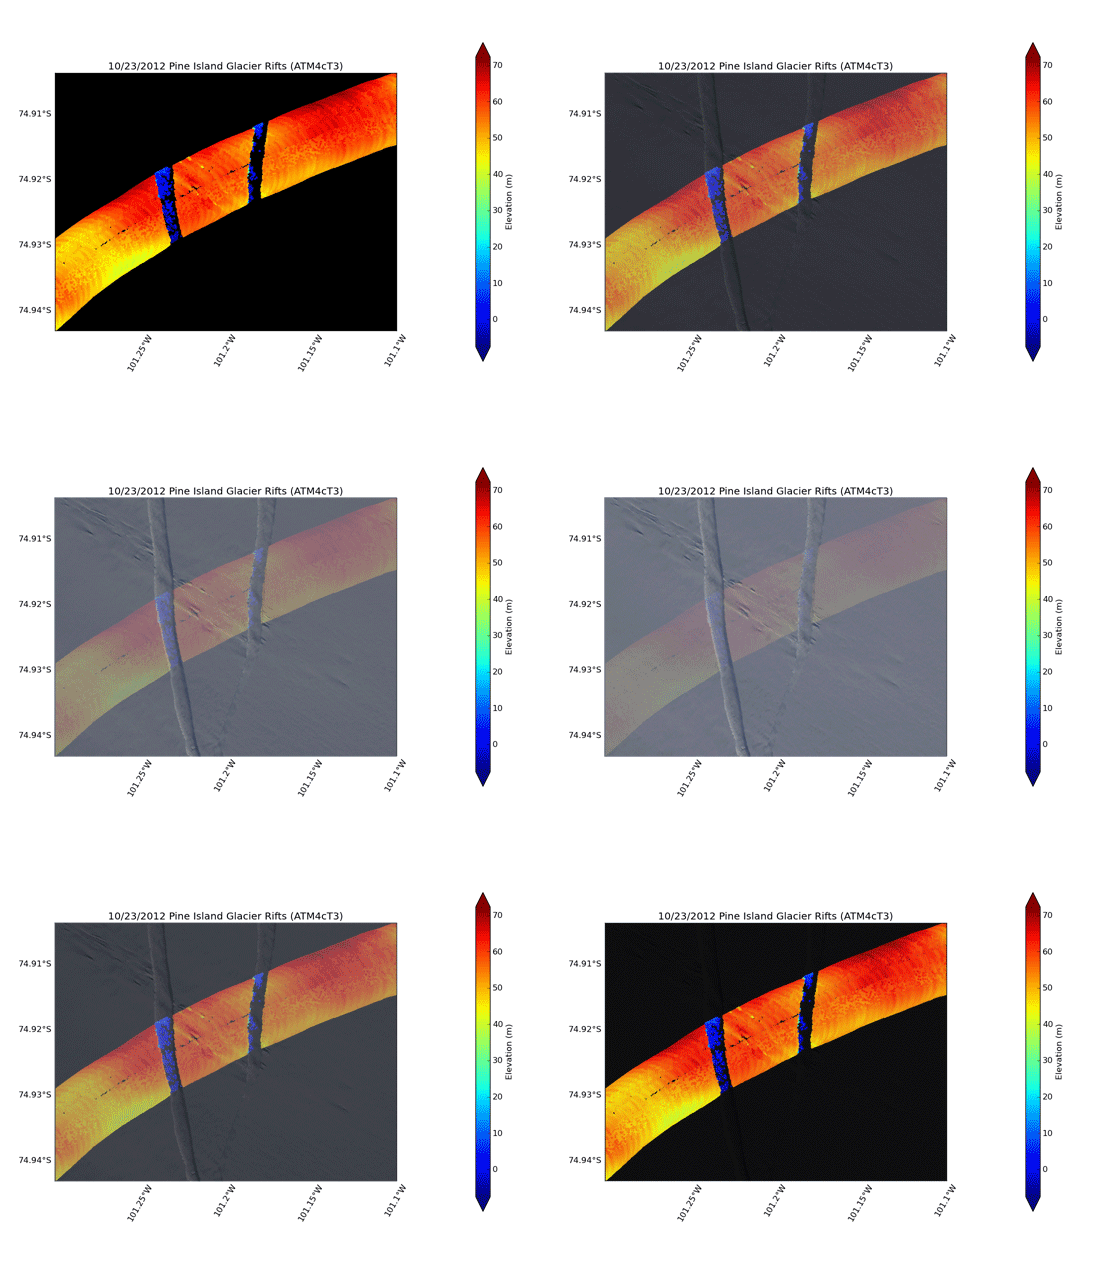
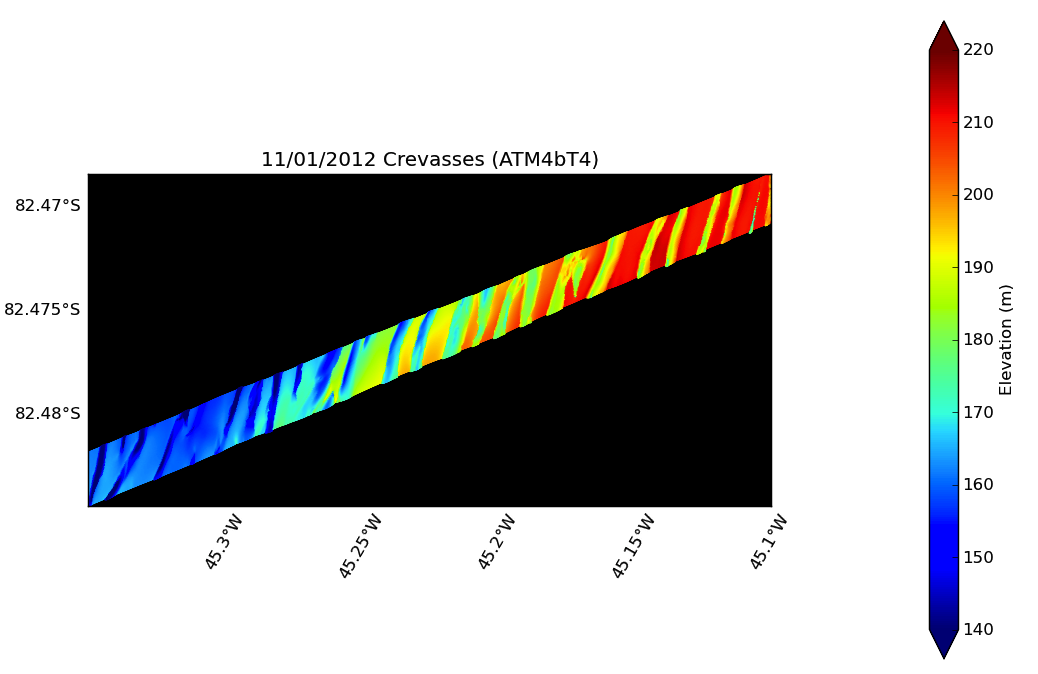
But sometimes researchers want a visual representation of something interesting in the field. By combining lidar data with rough GPS trajectories and information from the aircraft’s inertial navigation system, researchers like Yungel can use a custom-built graphics program to create visual representations of the ice. These snapshots of the surface aren’t meant to be precise, but to give IceBridge scientists a rough idea of what was seen, and when combined with images from the aircraft’s Digital Mapping System, it’s easy to see side-by-side, a representation of what information the instruments collect. Below are a few representations of features seen during 2012 Antarctic campaign flights.

A graphical representation of processed Airborne Topographic Mapper data.
A graphical representation of processed Airborne Topographic Mapper data from the 2011 Antarctic campaign showing the rift in Antarctica’s Pine Island Glacier. Credit: NASA / ATM Team


Animation showing ATM data representation of Pine Island Glacier rift and images from the Digital Mapping System
Animation showing a 2012 ATM data representation of Pine Island Glacier rift and images from the Digital Mapping System. Credit: NASA / ATM and DMS teams


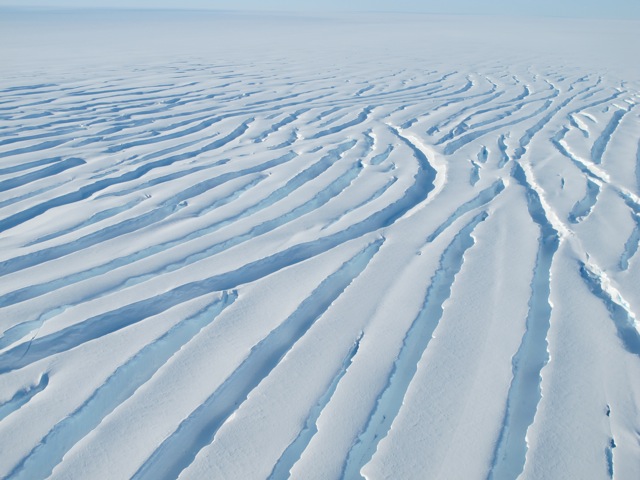
Crevasses in a glacier seen from the DC-8 near the Ronne Ice Shelf on Nov. 1.
Crevasses in a glacier seen from the DC-8 near the Ronne Ice Shelf on Nov. 1. Credit: NASA / Jim Yungel
ATM data representation of the glacier crevasses seen on the Nov. 1, 2012 flight.
ATM data representation of the glacier crevasses seen on the Nov. 1, 2012 flight. Credit: NASA / ATM

IceBridge Guests Get Behind the Scenes View

By Maria Jose Viñas, Cryospheric Sciences Laboratory Outreach Coordinator, NASA Goddard Space Flight Center

We sure had a packed plane on today’s flight, with visitors from the U.S. Embassy in Santiago, the Nathaniel B. Palmer, a Punta Arenas newspaper and two local schools. The Chilean teachers are the first to ever accompany IceBridge on an Antarctic mission (five docents had a chance to go on Arctic flights last spring). Carmen Gallardo, who teaches biology at Punta Arenas’ Colegio Alemán (German School) to kids ages 13 to 18 and Mario Esquivel, an astronomy teacher for students ages 9 to 14 at the local Colegio Francés (French School), were selected by the American Embassy in Santiago to fly on the DC-8 based on their English skills and, more importantly, on their plans to share their IceBridge experience with their classrooms and colleagues.

Visitors prior to boarding an IceBridge survey flight
Visitors to IceBridge prior to a survey flight on Nov. 1. Credit: NASA / Maria Jose Viñas

“From the point of the U.S. Government, what we want the most is to reach the Chilean youth – and we do it through their educators,” said Dinah Arnett, public affairs representative from the U.S. Embassy in Santiago.

Arnett was impressed with the enthusiasm and commitment of both teachers: they thoroughly researched the IceBridge mission beforehand and patiently went through two last-minute flight cancellations. But, as Gallardo said after yesterday’s flight was scrubbed: “Third time’s the charm!”

At the end of the almost 12-hour flight, both teachers were in awe of the sights they had enjoyed over the Antarctic Peninsula and the Ronne Ice Shelf during the Ronne Grounding Line mission. And they both thanked the researchers for their willingness to share their science. In turn, the educators plan on spreading the IceBridge word: both will be creating multimedia exhibits and giving talks to students from and beyond their schools.

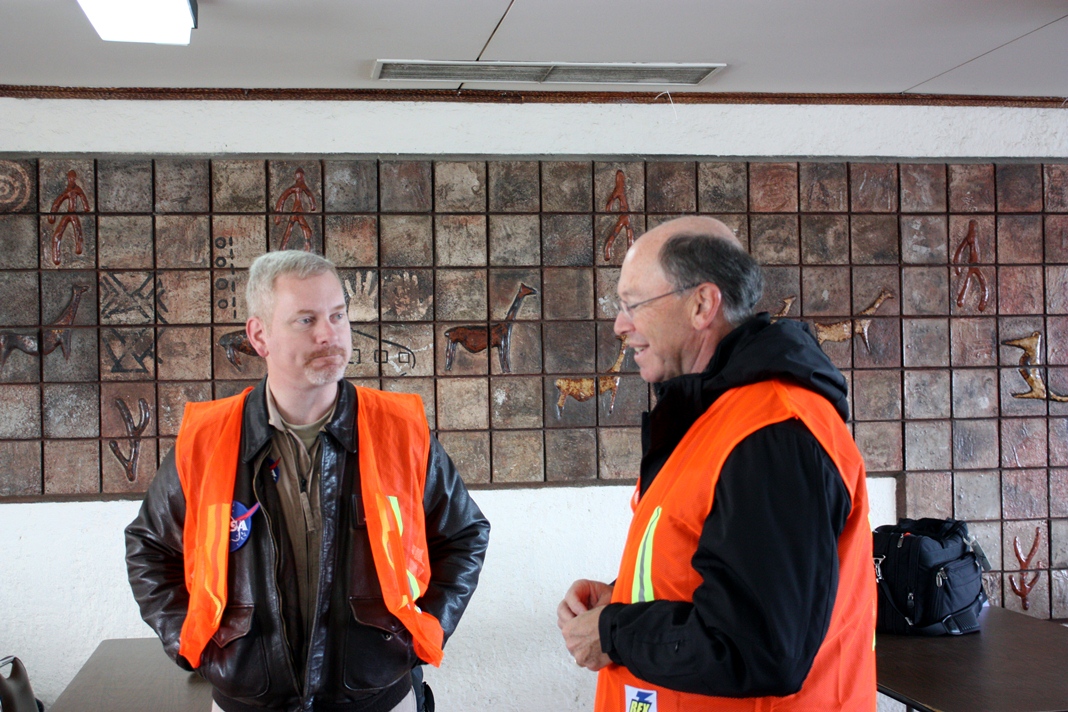
IceBridge project scientist Michael Studinger and Chilean teacher Mario Esquivel looking at a map on the NASA DC-8
IceBridge project scientist Michael Studinger and Chilean teacher Mario Esquivel looking at a map on the NASA DC-8. Credit: NASA / Jefferson Beck

Columbia University geophysicist Kirsty Tinto explains the science behind the gravimeter instrument
Columbia University geophysicist Kirsty Tinto explains the science behind the gravimeter instrument. Credit: NASA / Jefferson Beck

Port of Inquiry: IceBridge visits the Nathaniel B. Palmer

By George Hale, IceBridge Science Outreach Coordinator, NASA Goddard Space Flight Center

With its proximity to the Antarctic Peninsula, Punta Arenas, Chile, a city on the Strait of Magellan in southern South America, is a popular destination for scientists on their way to Antarctica. Not onlydoes NASA’s Operation IceBridge use the Punta Arenas airport as a home baseduring its Antarctic campaign in October and November, the city is also a base of operations for a variety of Antarctic science missions. During this year’s Antarctic campaign, the IceBridge team got to take a close up look at the United States Antarctic Program’sicebreaker Nathaniel B. Palmer, which calls Punta Arenas home.

On Oct. 24, Jamee Johnson and Chris Linden of the United StatesAntarctic Program led a group of IceBridge personnel on a guided tour of thePalmer. The research vessel is waiting in the port of Punta Arenas until lateDecember or early January, when it will carry scientists and their equipment toMcMurdo Station in Antarctica, conducting experiments along the way. Once there, passengers willoffload and a new group of people and gear will board the icebreaker for a returntrip to Punta Arenas.

IceBridge personnel standing outside the Nathaniel B. Palmer
IceBridge personnel on the dock in Punta Arenas in front of the Nathaniel B. Palmer. Credit: NASA / Christy Hanse nand USAP / Jamee Johnson

The Palmer is a 6,500 ton icebreaking research vessel thattravels to and from bases in Antarctica like United States’ McMurdo Station.The vessel sails from one of its home ports, like Punta Arenas, carrying scientists who do research along the way. During thetour, IceBridge personnel got to see some of the ship’s five labs, the galley,the infirmary and the ship’s bridge, where they met Sebastian Paoni, captain of the Palmer since2007.

Captain Sebastian Paoni talks to IceBridge people on the bridge
Palmer Captain Sebastian Paoni (right) meets visitors on the bridge. Credit: NASA / George Hale

In many ways, thePalmer is similar to other large, ocean-going research ships. There are placesfor crew and passengers to sleep, eat, relax, exercise and socialize. Withtrips to sea lasting several weeks at a time, ships like the Palmer need to beself-contained floating cities, carrying enough food, water, spare parts andother supplies needed to keep the crew and passengers safe and happy.

The big difference between the Palmer and other research vessels is that it has a reinforced hull designed to let it break through ice, opening a passage to travel through. There are limits to how thick of ice the ship can break through, so planning the ship’s route often requires satellite imagery and other data that can show where thinner ice is. Sailing through ice is a slow and often noisy process, but when your path is blocked by sea ice, slow and noisy beats not atall.

Science By Air and Sea

The Palmer and IceBridge’s aircraft both gather geophysical data, and despite the different nature of these platforms the instruments have some similarities. In the labs, Linden, a senior systems analystaboard the Palmer, showed IceBridge team members several different instruments, such as including a gravimeter and a sonar system used to map the ocean floor. Thesonar uses a technique to create swaths of data that resemble theswaths of elevation data produced by IceBridge’s Airborne Topographic Mapperinstrument. 

Probably the biggest similarities are dealing with motion and the changing array of instruments used. Scientists need to counteract motion from either a rolling ship or vibrating airplane, which is handled in both cases by referencing the instruments with data from GPS and inertial guidance systems. Also, much like on NASA’s aircraft, the instruments on the Palmer change depending on what is being studied. Changing the configuration of the ship’s equipment is something Johnson said is one of the most interesting parts of the job.

In return for graciously taking visitors on a tour of the ship, IceBridge invited some Palmer personnel to come along on a survey flight. People working on icebreakers rely on information about sea ice to plan their routes and although IceBridge data isn’t directly used, flying along will give them a chance to see how the mission measures ice from the air.

Palmer visitors stand on the helipad on the Palmer's stern
Palmer visitors stand on the helipad on the Palmer’s stern. Credit: NASA / Christy Hansen and USAP / Jamee Johnson

For more information about the Nathaniel B. Palmer, visit: http://www.usap.gov/usapgov/vesselScienceAndOperations/index.cfm?m=4

A Diplomatic Visit for IceBridge

By George Hale, IceBridge Science Outreach Coordinator, NASA Goddard Space Flight Center

On Oct. 25, IceBridge was joined by U.S. Ambassador to Chile Alejandro Wolff and his Secretary for Economic Affairs Josanda Jinnette. Ambassador Wolff and Ms. Jinnette traveled from Santiago on Oct. 24 and attended IceBridge’s evening science meeting that day. The following morning, they sat in on the morning pre-flight meeting and after a short safety briefing they boarded the DC-8 for an 11-hour-long survey of the Ferrigno and Alison ice streams that empty into the Bellingshausen Sea.

In addition to being a distinguished career diplomat, Wolff is interested in science, particularly in international scientific collaboration. “Science cooperation is an important part of the U.S. – Chile relationship,” Wolff said. Although this was his first flight with IceBridge, this wasn’t the ambassador’s first trip to Antarctica. He visited Palmer Station years ago and says that while flying over the continent isn’t the same as being on the ground, it does give a better sense of its dimensions.

U.S. Ambassador to Chile Alejandro Wolff in the IceBridge operations center at the Punta Arenas airport on the morning of Oct. 25.

U.S. Ambassador to Chile Alejandro Wolff in the IceBridge operations center at the Punta Arenas airport on themorning of Oct. 25. Credit: NASA / George Hale

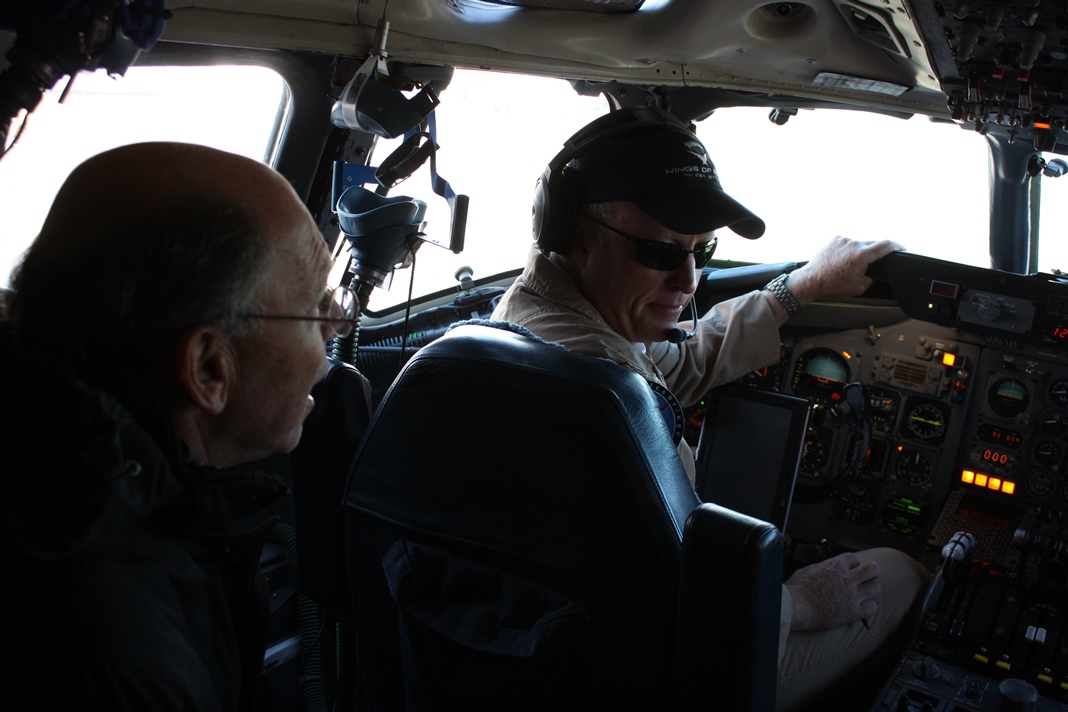
Ambassador Wolff in the DC-8 cockpit shortly after takeoff on Oct. 25.

AmbassadorWolff in the NASA DC-8 cockpit shortly after takeoffon Oct. 25. Credit: NASA / George Hale

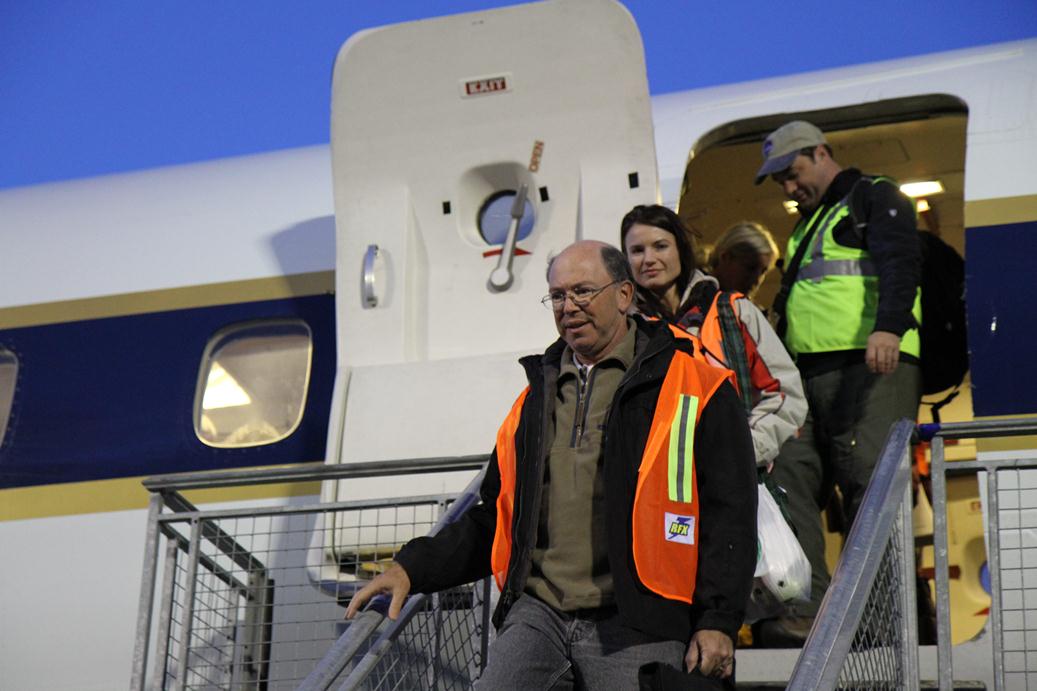
The ambassador and Ms. Jinnette exiting the DC-8 after another successful IceBridge survey flight.

Ambassador Wolff and Ms. Jinnette exiting the DC-8 after another successful IceBridgesurvey flight. Credit: NASA / Jefferson Beck

To the Ends of the Earth

By Christy Hansen, IceBridge Project Manager, NASA Goddard Space Flight Center

If somebody had told me that 2012 would bring with it a deployment to Greenland, Chile, and possibly Antarctica, I never would have believed them. But here I am reflecting back on my three weeks in Kangerlussuaq, Greenland, as I pack for Punta Arenas, Chile. These experiences have been made possible by my new assignment as the project manager of a NASA airborne geophysical project called Operation IceBridge (OIB).

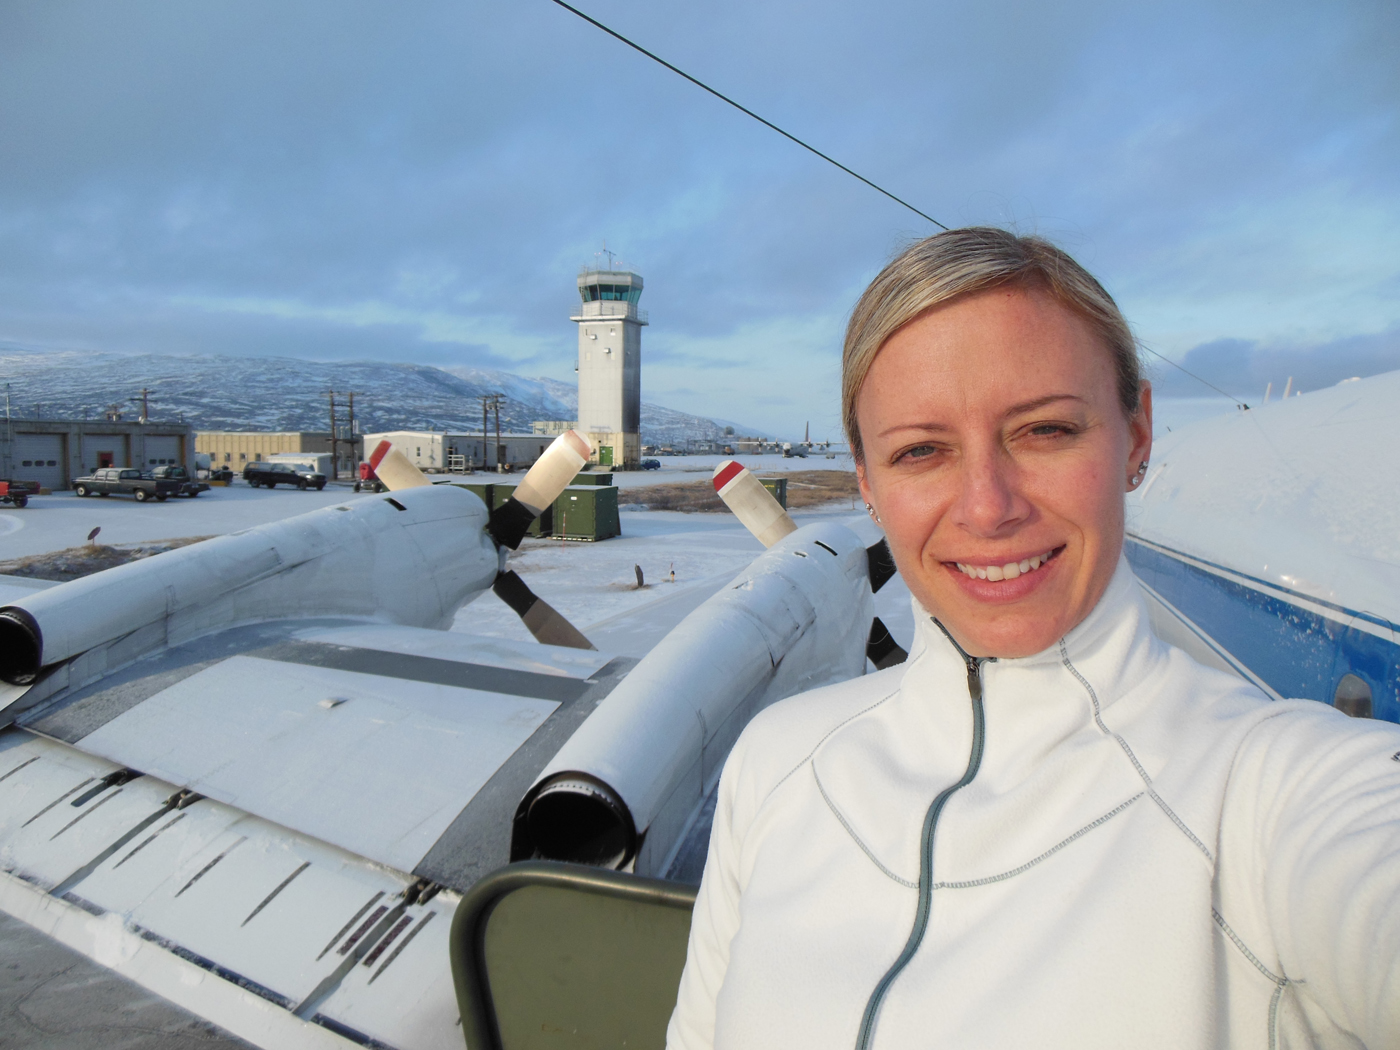
Christy Hansen in Kanger, Greenland, after one of Operation IceBridge’s science flights. Behind her is the air traffic control tower, as well as the P-3B propellers.
Christy Hansen in Kanger, Greenland, after one of Operation IceBridge’s science flights. Behind her is the air traffic control tower, as well as the P-3B propellers. Credit: Christy Hansen

I started full-time work with OIB this past March. What I truly enjoy about this project is the remarkably talented and extensive team I work with. As the project manager, I must coordinate and help lead a vast team of experts spread out across the country. This team includes polar scientists, instrument engineers, educational/outreach teams, logistics teams, data centers, and aircraft offices. I have to utilize good leadership and communications skills to help my integrated team work together smoothly to achieve a common goal and meet all of our science objectives.

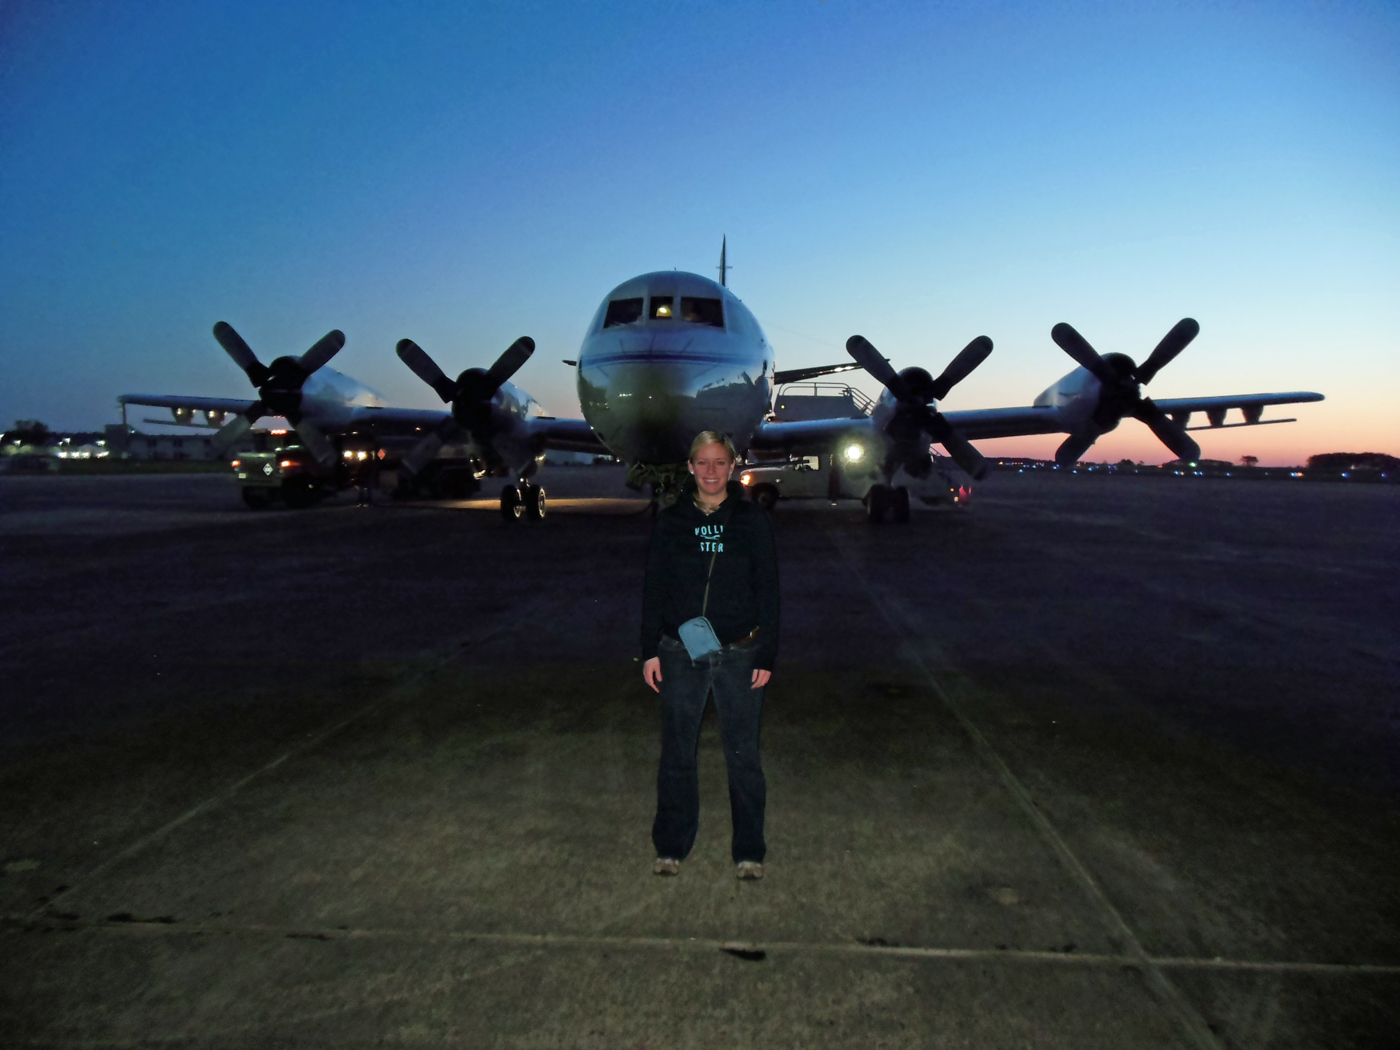
Christy Hansen stands in front of an airplane at Wallops Flight Facility in Virginia. This plane took her to Greenland this past April.
Christy Hansen stands in front of an airplane at Wallops Flight Facility in Virginia. This plane took her to Greenland this past April. Credit: Matt Linkswiler

Twice a year, the OIB team travels to Earth’s polar regions to collect data on the changing ice sheets, glaciers, and sea ice. For the Arctic campaign, we use the P-3B 4-engine turbo-prop airplane at NASA Goddard Space Flight Center’s Wallops Flight Facility. It has been modified to carry nine different science instruments, including laser altimeters, which measure the different heights of the terrain from aircraft, and various types of radar systems that can actually penetrate the thick ice sheets.

Just four weeks after I started as project manager, I found myself landing in a small Southwestern Greenlandic town called Kangerlussuaq. There was snow on the runway and everyone was bundled in coats. The majority of the buildings looked like military barracks. Most of the OIB team was already there, and they greeted me at the plane. At the time, I knew only one person, the project scientist, and we had only spoken a few times! What an adventure awaited me!

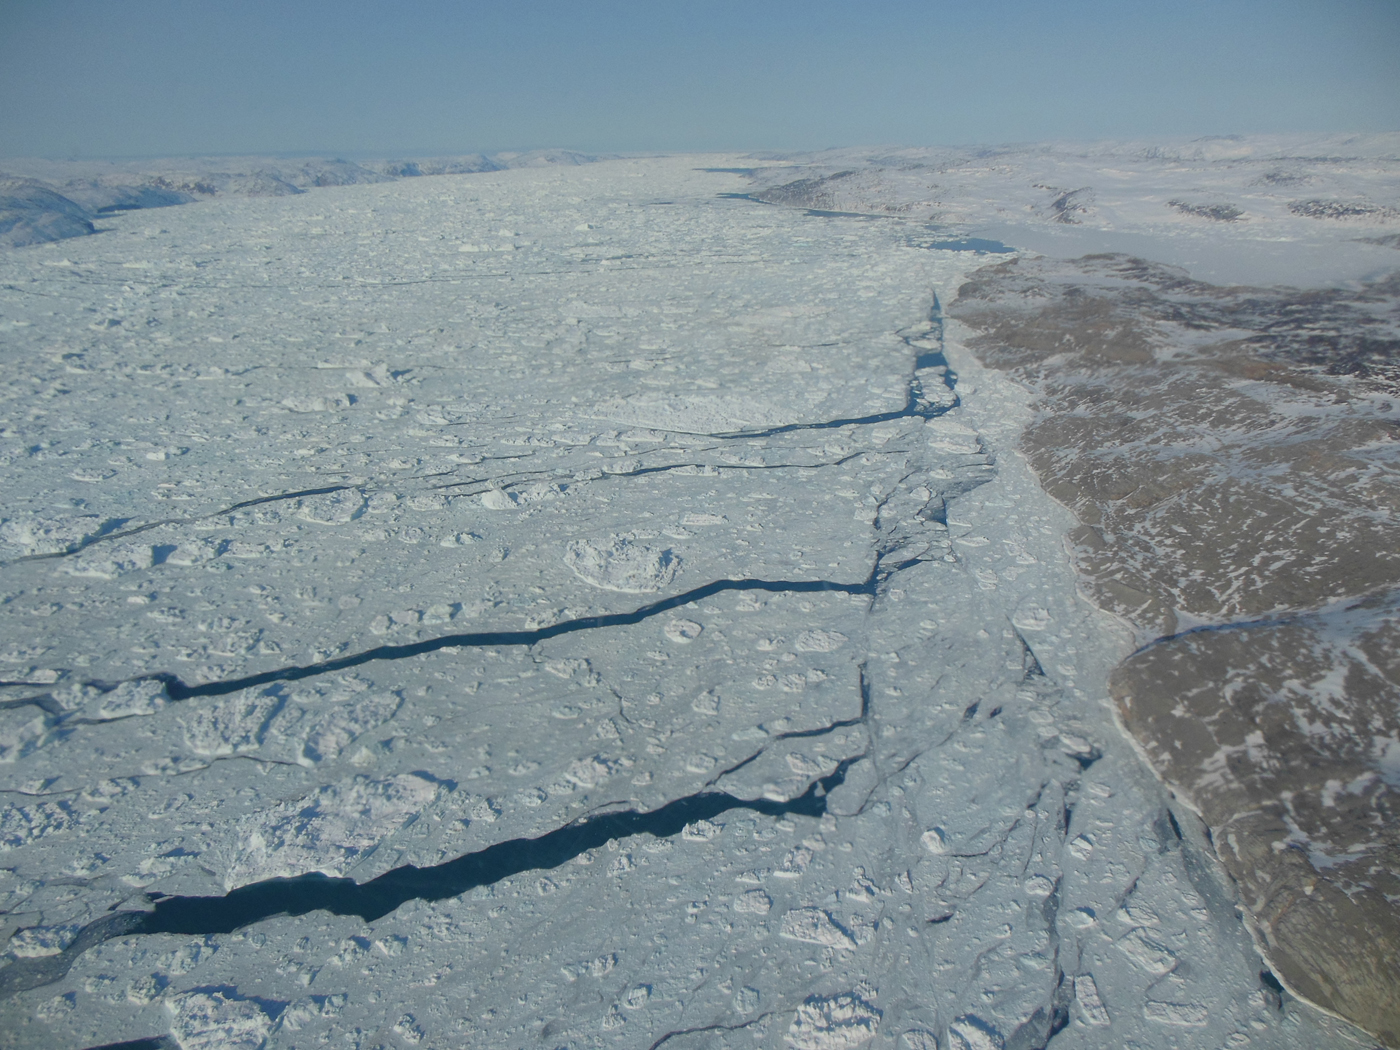
A view of sea ice with open leads of water.
A view of sea ice with open leads of water. Credit: Christy Hansen

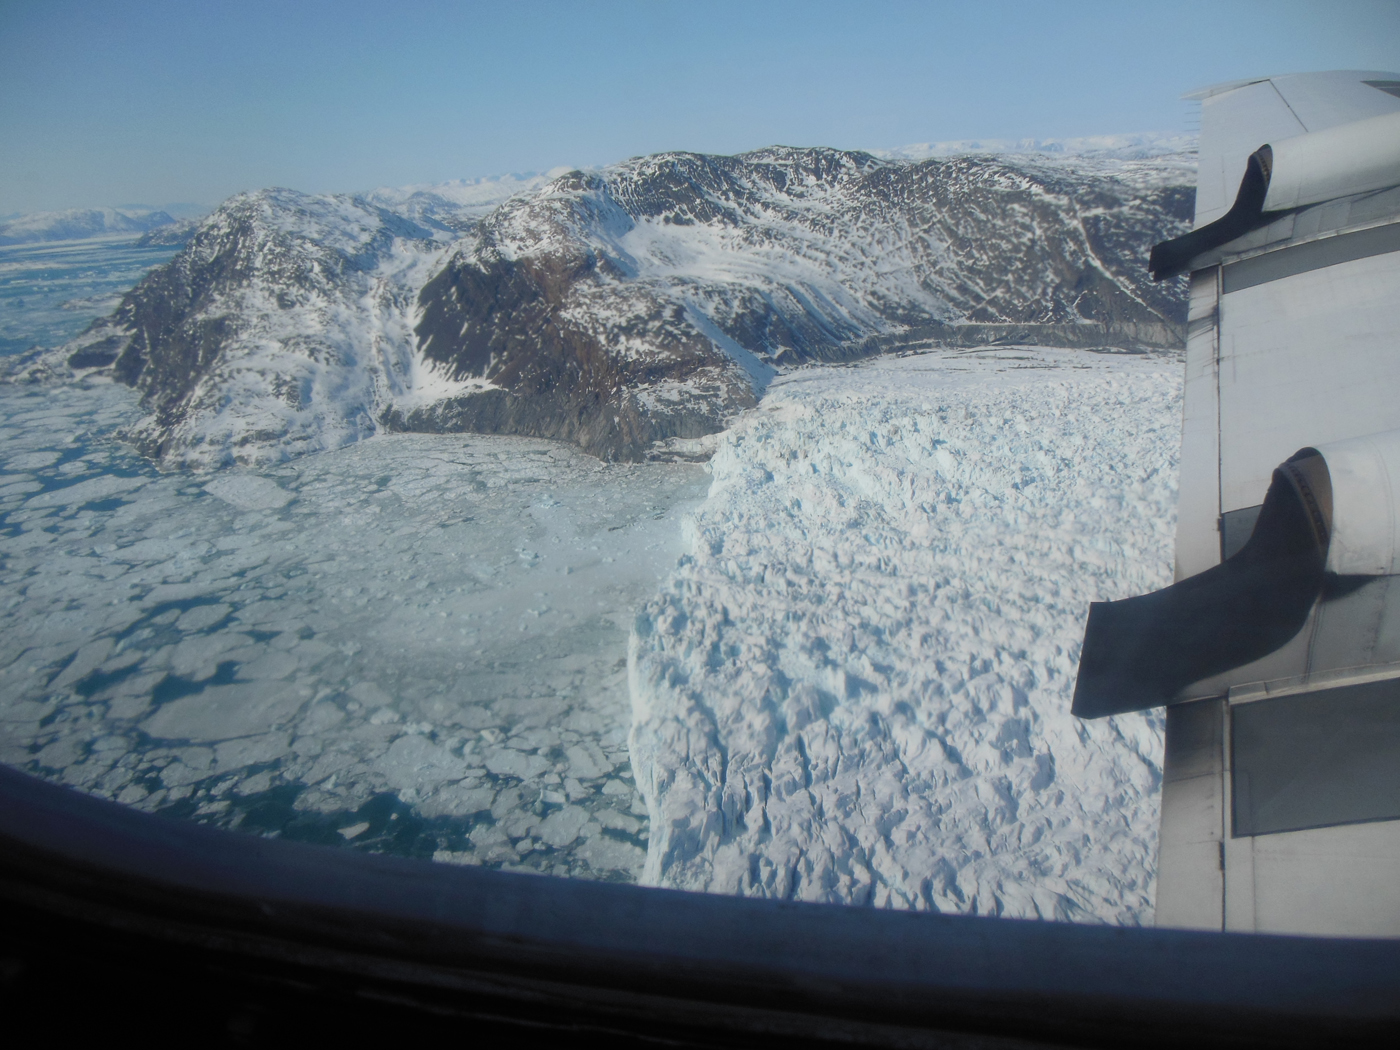
An image of a glacier’s calving front, where it flows and loses ice to the sea.
An image of a glacier’s calving front, where it flows and loses ice to the sea. Credit: Christy Hansen

Each day, we flew at 1500 feet, seemingly scraping the surface of the massive Greenland ice sheet. I felt as though I could have touched it with my fingers if I had just stretched out my hand. It was beautiful.

Watching the team work together like a well-oiled machine, for almost 8 hours at a time, was simply awesome. The pilots, the aircraft maintenance team, and the instrument experts, who collect gigabytes and terabytes of data per flight, collect the invaluable data that tells us what is happening at our poles, and how much the ice is changing each year.

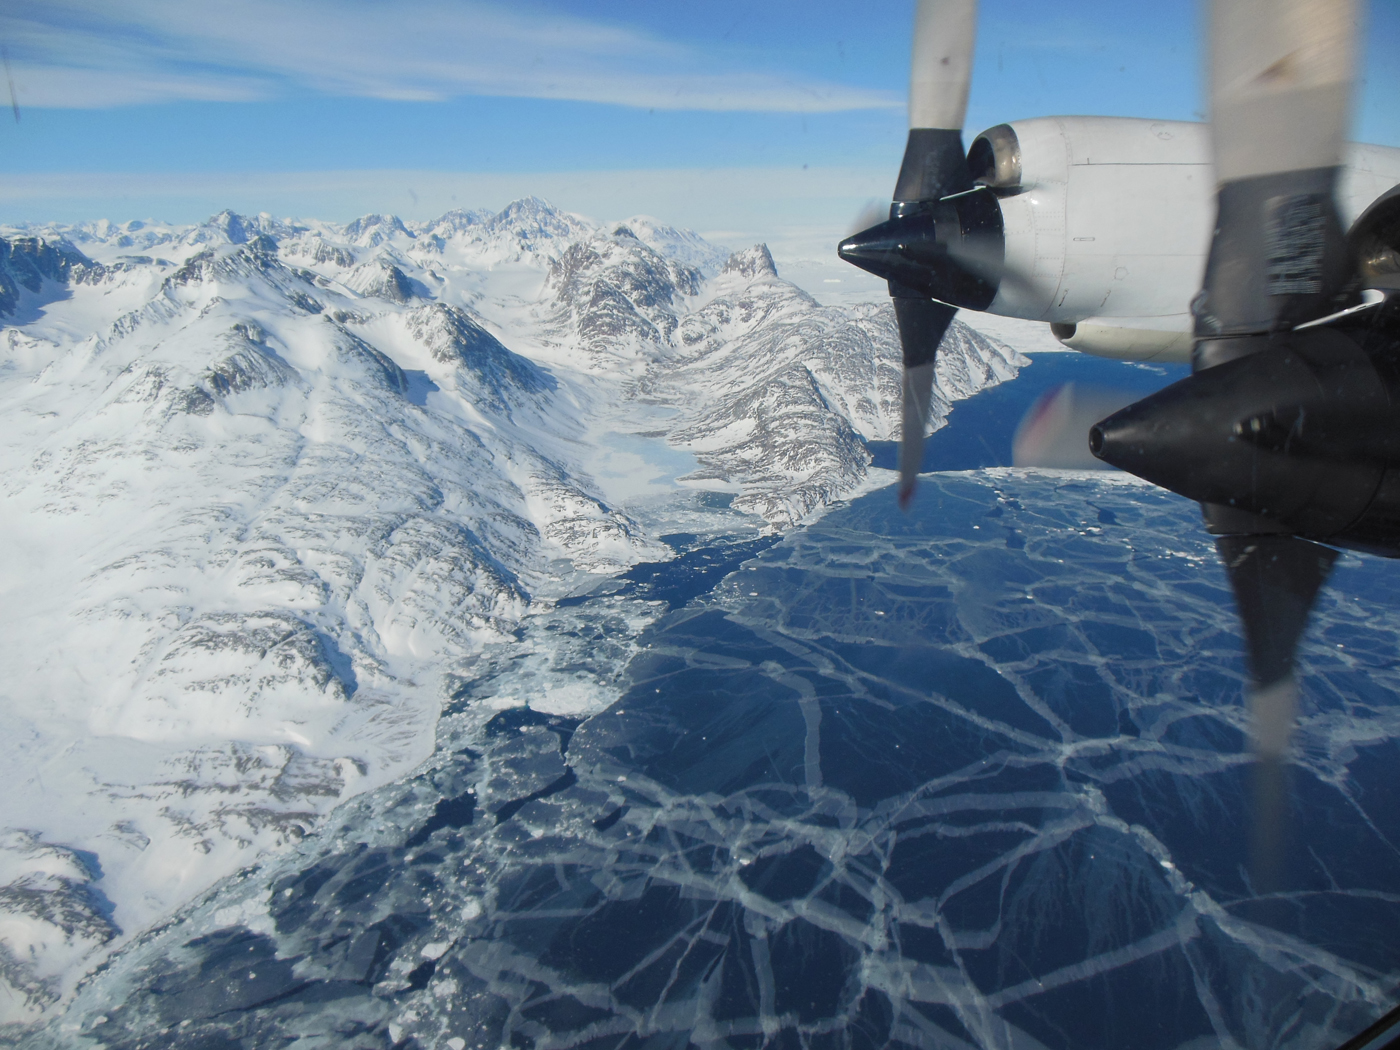
The plane flies over sea ice. The P-3B propeller can be seen out the window of the plane.
The plane flies over sea ice. The P-3B propeller can be seen out the window of the plane. Credit: Christy Hansen

Christy Hansen sits on a toolbox while she working on the Operation IceBridge flight. She is surrounded by various scientific instruments.
Christy Hansen sits on a toolbox while she working on the Operation IceBridge flight. She is surrounded by various scientific instruments. Credit: Christy Hansen

My second trip to collect data with the OIB team began last September. For the Antarctic campaign, we use NASA Dryden Flight Research Center’s DC-8 aircraft and operate out of Punta Arenas, Chile. During this Chilean campaign, we will actually fly from Chile, over specific science target regions in Antarctica, and then land back in Chile! That’s an 11-hour round trip flight almost every day!

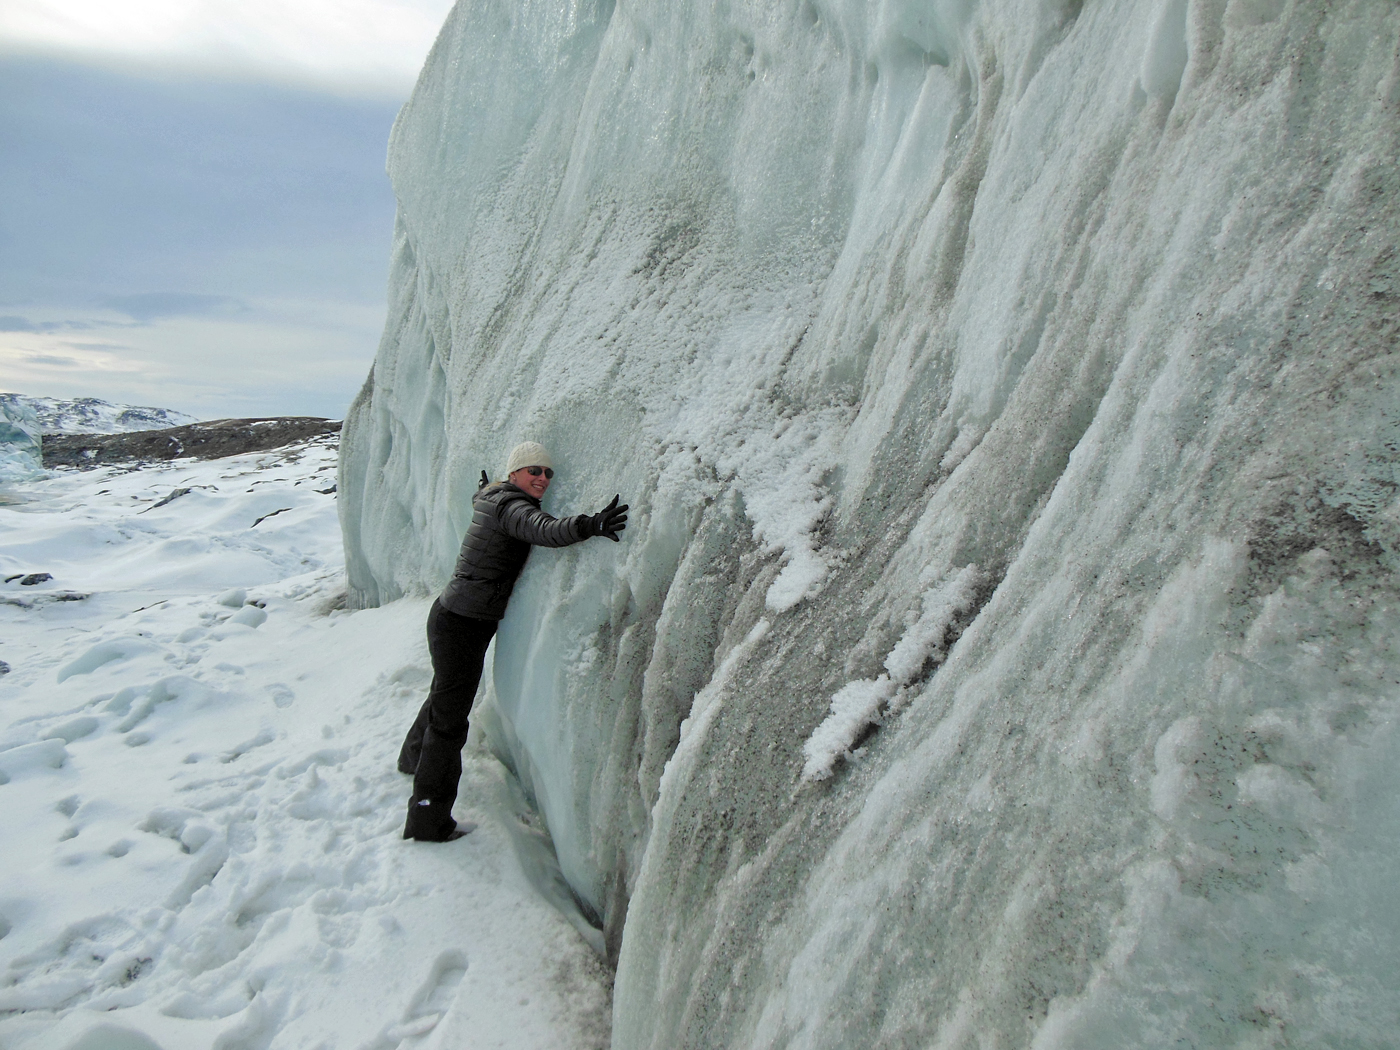
Christy Hansen hugs the Russell glacier, part of the Greenland Ice Sheet.
Christy Hansen hugs the Russell glacier, part of the Greenland Ice Sheet. Credit: Christy Hansen

Isn’t this exciting? If you want to learn more about what I do and Operation IceBridge’s current Antarctic campaign, join my Google+ Hangout on Wednesday, October 17th from 1-2pm EST. I look forward to talking to you from Chile.

Editors note: This feature was originally posted on NASA’s Earth Science Week Blog


IceBridge Over the Desert

By Claire Saravia, NASA Goddard Space Flight Center Office of Communications


Before the instruments aboard NASA’s Operation IceBridge fly over Antarctica in October to collect polar ice data, they will be tested over an unlikely ice substitute: a series of sites in the Mojave Desert.

The instruments that are part of IceBridge—a six-year flight mission designed to study ice at the Earth’s poles and bridge the gap between the two ICESat missions —are put through test flights every year to ensure they’re functioning properly.

This year, instruments like the Airborne Topographic Mapper (ATM) will use three separate sites in the California desert as a dress rehearsal for one of the real mission flights.

View of the Mojave Desert from the DC-8
View of the Mojave Desert from the DC-8. Credit: NASA/J. Yungel

While it might seem counterintuitive to use a desert to simulate land filled with ice, ATM scientist John Sonntag said the area’s land features and reflective sand produce a similar landscape.

“The variety of terrain and surface reflectance over these lines will allow us to adjust the ATM for a wide variety of targets, thus increasing the reliability of the system once we get over Antarctica,” Sonntag said.

The IceBridge mission scientists aren’t the first to use the dry, sandy area to portray its icy counterpart. Sonntag said the test flight would be using some of the same tracks used during test flights of the ICESat mission as a way to compare measurements.

“We continue to overfly these tracks as part of ATM calibrations because we can compare the results with over flights of those same targets in previous years,” Sonntag said. “These comparisons will allow us to adjust the calibration parameters of the ATM with great precision.”

One of the desert features that will be used in the test flight is the El Mirage dry lake, which Sonntag said is frequently featured as a scenic backdrop in both movies and car commercials.

“El Mirage is a nearly ideal site for doing these laser calibrations because it is large, relatively flat, completely unobstructed by overhead features such as power lines and light poles, and has a bright laser reflectance similar to snow and ice,” Sonntag said.

The El Mirage dry lake in the Mojave Desert
The El Mirage dry lake in the Mojave Desert. Credit: NASA/J. Yungel

While it would be more ideal to use actual snowy surfaces to test the instruments, ATM program manager James Yungel said the easy access to sand regions outside both the NASA Wallops Flight Facility and the Dryden Flight Research Center made it the next best thing.

“Finding snow near Wallops or Dryden when we install on the aircraft can be difficult, but both NASA home airports have sand beaches or sand desert regions that are fairly close to snow reflectivity,” Yungel said. “These sandy sites allow us to tune the ATM systems for actual snow targets.”

IceBridge project scientist Michael Studinger said the fact that the scientists know the desert sites well makes them a popular spot for adjusting the instruments to measure ice.

“This is necessary so that we can collect high quality data over unknown targets like the Antarctic ice sheet and be confident that we have an extremely precise measurement of the ice surface elevation,” Studinger said. “It’s not about the precise location, but calibrating the radar for the signal that is transmitted from the antennas and then reflected back from the layers in the ice sheet and glaciers.”

IceBridge conducted two equipment checkout flights, one over the Pacific Ocean on Oct. 2 and one over the Mojave Desert on Oct. 3. The IceBridge Antarctic campaign is scheduled to begin with its first science flight on or about Oct. 11, 2012.

Preparing the DC-8 for Antarctica 2012

By George Hale, IceBridge Science Outreach Coordinator, NASA Goddard Space Flight Center

Over the next few weeks the IceBridge team will prepare NASA’s DC-8 airborne laboratory for the 2012 Antarctic campaign. Long hours in the hangar at NASA’s Dryden Flight Research Facility mean that the MCoRDS antenna and Airborne Topographic Mapper have been installed and all ground tests for ATM are complete. Next week, the radar and gravimeter teams will begin their preparation work.

IceBridge DC-8 preparing for outdoor ATM ground test

IceBridge DC-8 preparing for outdoor ATM ground test. Credit: NASA / Tom Tschida

MCoRDS antenna installed on the DC-8

MCoRDS antenna installed on the DC-8. Credit: NASA / Tom Tschida
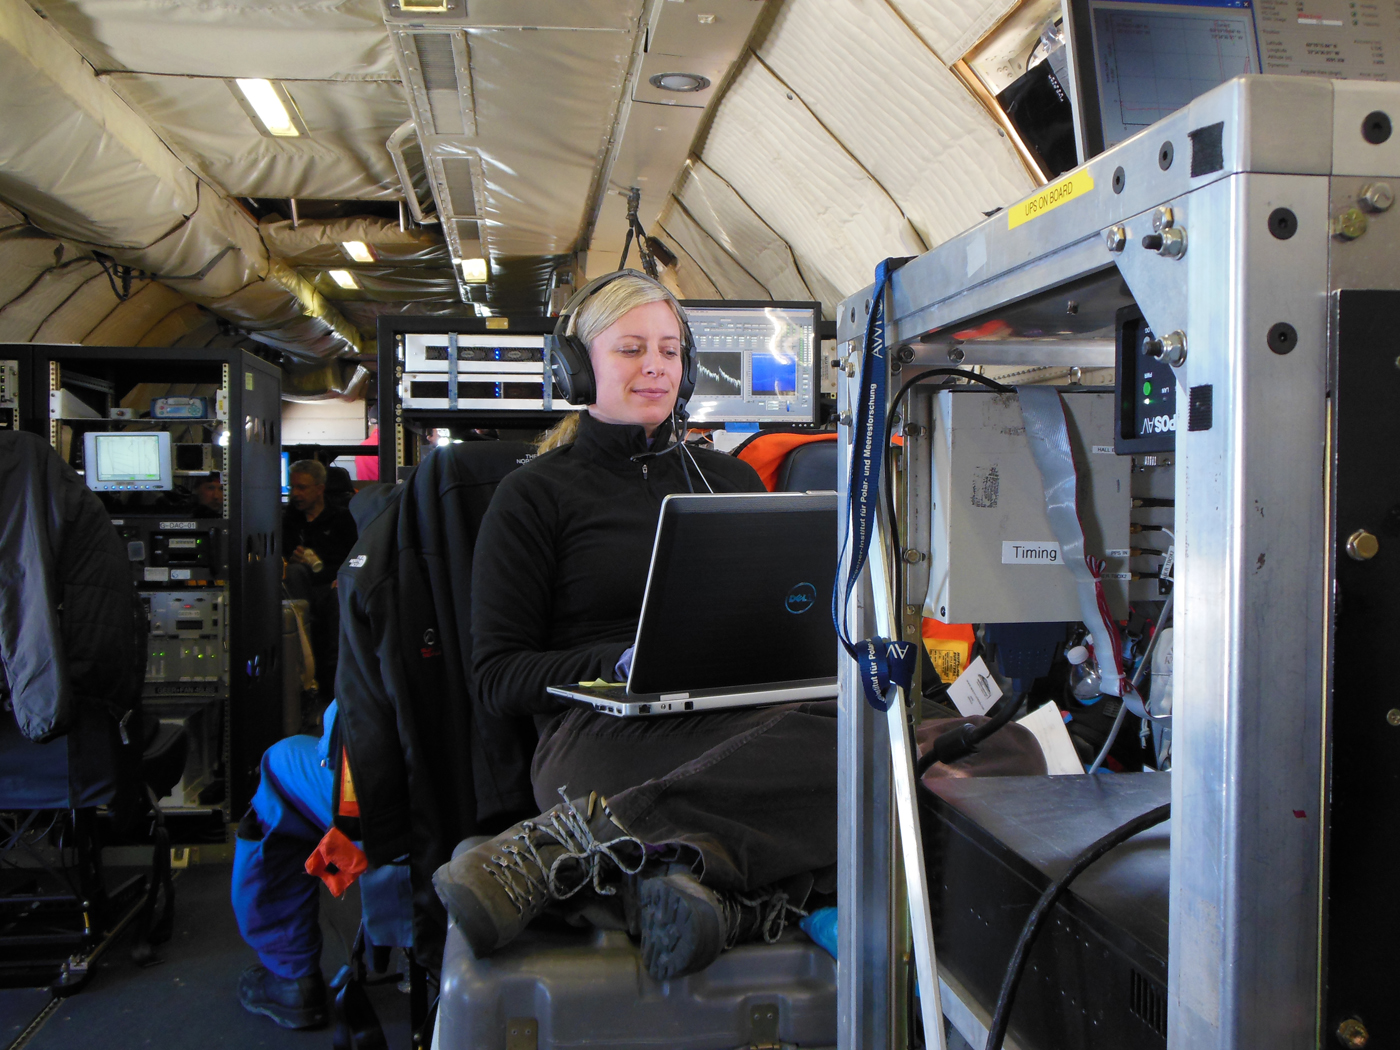
Airborne Topographic Mapper instrument installed inside the DC-8
ATM instrument installed inside the DC-8. Credit: NASA / Tom Tschida
ATM team member Jim Yungel (front) and Matt Linkswiler make last minute adjustments to the instrument

ATM team member Jim Yungel (front) and Matt Linkswiler finish installing the ATM instrument assembly. Credit: NASA / Tom Tschida

ATM consoles installed in DC-8 cabin
ATM team members (left to right) Matt Linkswiler, Robert Harpold and Brad Grantham carry out ATM functional tests. Credit: NASA / Tom Tschida

ATM laser trace on hangar floor
ATM laser trace on hangar floor. Credit: NASA / Tom Tschida

The end of a successful ATM ground test. Pictured left to right: Kevin Mount, Robert Harpold, Jim Yungel,Lorenzo Sanchez, Joe Niquette and Matt Linkswiler. Credit: NASA / Tom Tschida

Weather and Operation IceBridge

By John Sonntag, OIB Instrument Team Lead, NASA

If you know the saying “make hay while the sun shines”, you’ve already got a pretty good idea of how weather affects flight operations for Operation IceBridge. Generally speaking, our flights require clear skies over the area in which we are operating on any given day. There are two good reasons for this. First, some of our sensors, including the Airborne Topographic Mapper and the Digital Mapping System, are optical instruments and need the sky between the aircraft and the ground to be cloud-free to obtain their measurements. Second, since we usually fly low and close to terrain (and sometimes amongst mountain peaks), our pilots need clear skies in order to see and avoid the terrain for flight safety reasons. These requirements mean that weather largely governs what we do on any given day, and makes it necessary for OIB project scientist Michael Studinger and myself to remain immersed in the minutiae of polar weather every day while we are in the field. On every potential flight day, we must make a decision about whether to fly and where to fly, and if we make the wrong decision we might face the mortifying prospect of returning from an expensive taxpayer-funded flight without science data to show for it. So far in the 3-year history of OIB, that has not happened, and Michael and I very much want to maintain that record.

Michael and I typically start studying the current weather patterns governing our operating areas at least a week prior to our deployment. It is helpful to develop a sense of context and a feeling for the current weather systems and their movements before we must begin making decisions on flight days. Our primary tools for this, and for all of our weather analysis tasks, are satellite imagery in several wavelengths, meteorological forecast models and point observations of current weather conditions from observers on the ground.

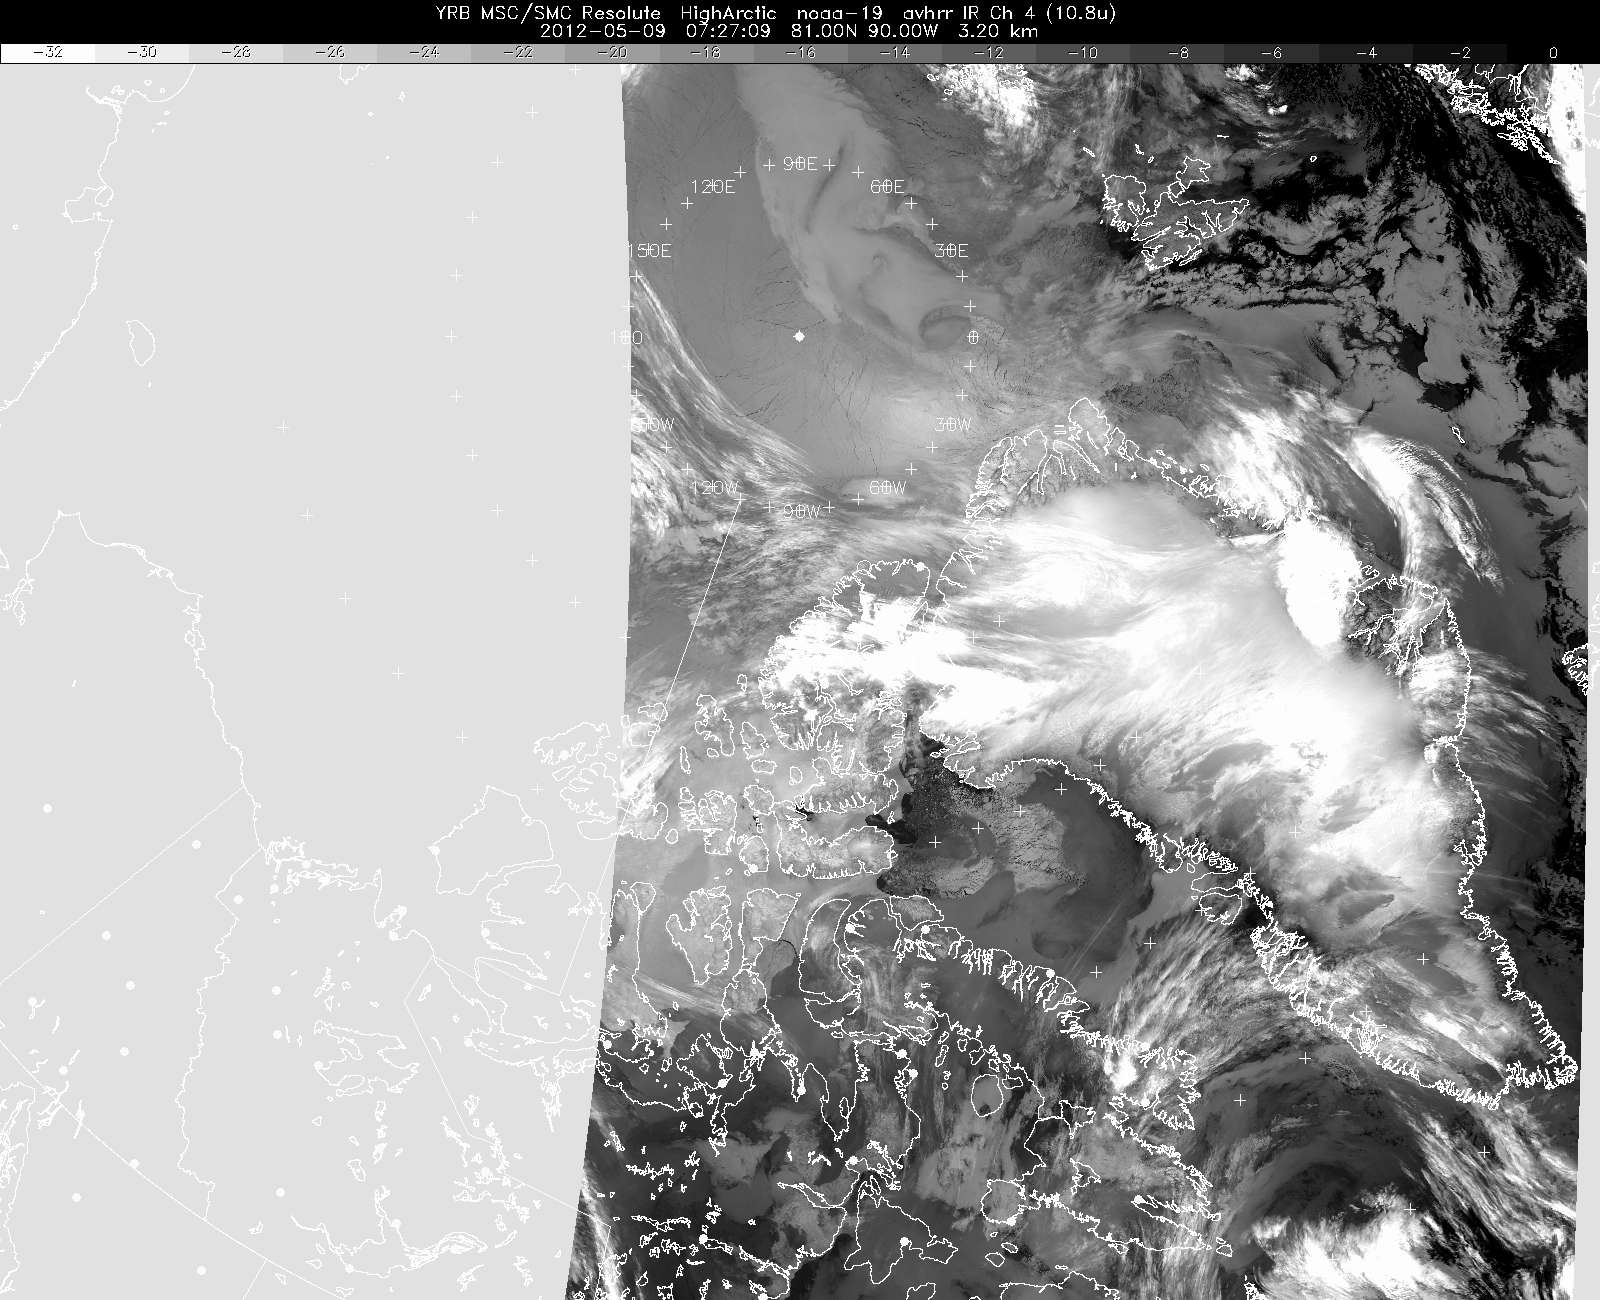
An early morning weather satellite image of Greenland and Arctic Canada, taken on 9 May 2012.

An early morning weather satellite image of Greenland and Arctic Canada, taken on 9 May 2012. This image is an infrared image from a NOAA polar orbiter, and while it shows significant cloud cover at several altitudes over western Greenland, we chose to fly a mission along a narrow corridor along the northwest coast of Greenland where the weather was clear. Credit: NOAA

Satellite imagery, most of which is provided by NOAA polar-orbiting satellites in our case, gives us a snapshot of the clouds over an area of interest. Imagery in the infrared band shows us not only the extent of the clouds over an area but also suggests the altitude of the cloud tops, since the infrared band is sensitive to temperature, and cloud temperatures are dependent on their altitude. Basically, bright white clouds are high, gray clouds are medium or low, and ground fog can sometimes be almost indistinguishable from the ice surface as their temperatures are similar. Visible imagery is better at showing us texture, which helps us distinguish between ice surface and fog, estimate the thickness and density of the cloud cover and determine the distance between cloud bases and the terrain beneath by virtue of the shadow they cast on the surface, especially when the sun angle is low. Another type of imagery we sometimes use is known as the “3 micron” band for its wavelength. This type is particularly sensitive to the amount of water vapor present in cloud masses.

We often refer to ground observations to help us refine our interpretation of satellite imagery, primarily because they provide a reliable measurement of the distance between the ground and the cloud bases. Sometimes the clouds are high enough and the terrain sufficiently benign that we are able to fly below the cloud bases, and point observations occasionally allow us to make such a judgment with some confidence we might not otherwise have. We must be careful, however, to remember that these observations are valid at one point only, while our flights cover large distances.

But for forecasting weather into the future, we are highly dependent on computer meteorological models, which predict what the weather may be like later in a day, or into the next day or beyond. Such information is critical for planning and optimizing our flight selections. For example, we might examine satellite imagery early on a potential flight morning and conclude the weather over our target is clear, but if a forecast model shows that the weather there will deteriorate by mid-day we would probably choose not to fly there. Sometimes the reverse occurs, where morning imagery might show marginal conditions over a target area but the forecast models confidently predict quick improvement. In such a case we might choose to launch a flight into the area, if our confidence in the model predictions is sufficient.

A typical flight day for me (and probably Michael as well) literally starts with weather as soon as I roll out of bed. The first thing I do every morning, even before brushing my teeth, is to open up my laptop and download a few satellite images to get a sense of cloud cover. That way I can mull it over while I get showered and into my flight suit and have breakfast. After breakfast, Michael and I, and our pilots, head to the local airport’s weather office to get their take on the weather where we are going. I cannot stress enough the importance we place on our discussions with these professional meteorologists, nor can I praise them enough for the help they invariably give us. Most of them seem to genuinely enjoy the professional challenge we bring to them, since the kind of flying we do, and the weather we are dependent on, are so different from those of the flight crews they normally deal with. In this morning weather briefing, we go over everything they have available, including satellite imagery, model predictions, point observations, and their own professional and experientially-derived “feel” for the conditions. Once we have gathered all the information available, it is decision time. We always remember that when we launch a flight, we are committing the U.S. taxpayer to pay many thousands of dollars to operate a big, expensive aircraft that day. So we take this decision very seriously, and at times it can be a rather nerve-wracking process.

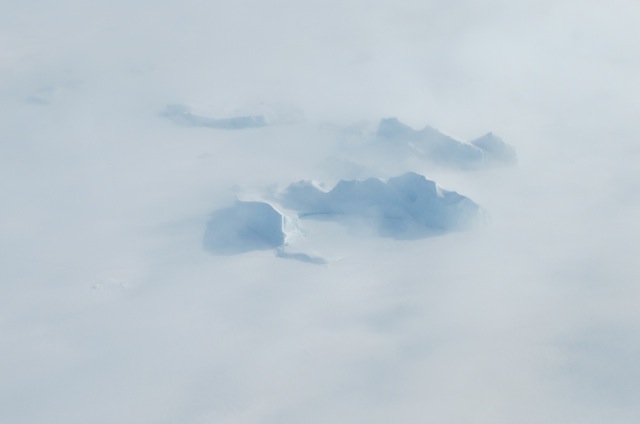
Icebergs in a northwest Greenland fjord shrouded in fog.

Icebergs in a northwest Greenland fjord shrouded in fog. Credit: NASA/Jim Yungel.

Once in the air we constantly monitor the weather to see if it was as we expected, based on the morning weather briefing. It usually is, though the exact locations of cloud boundaries and ceilings are sometimes slightly different from what was predicted, and occasionally ground fog might exist where we did not expect it. We find that ground fog is consistently the most difficult aspect of polar weather to predict, although it has never adversely affected a flight to a serious degree. We also monitor the winds and compare these to the forecasts, which is important because winds can create turbulence under certain conditions, and turbulence can create a variety of problems for us.

Once we land, Michael and I immediately head back to weather office to get a forecast for the next day. Next, based on what I heard at this post-flight briefing and on further information I obtain from the internet, I prepare a weather briefing for the entire field team, which I give at our nightly science meeting. This briefing usually has two parts. First is a quick retrospective analysis of the day’s mission, comparing the weather we expected with what we actually encountered. Doing this on a daily basis helps us fine-tune our understanding of the performance of various weather models, our interpretation of imagery and our general decision-making process. Next I give an overview of our expectation of the next day’s weather and which flights might be best-suited for it. This enables the flight crew and the instrument operators to prepare for the next day’s activities.

The next morning, the process starts all over again. By the time we end a long deployment (the current one will be 11 weeks long), I look forward to spending entire days without looking at a weather image. But to be honest, I am at heart a weather geek, and after being back home for a while I miss the sense of connectedness I had to the natural world from remaining so immersed in meteorology for such a long time.

I have found that the key to successful weather-based decision-making is to consult as wide a variety of sources as possible, diligently calibrate oneself to the strengths and shortcomings of all weather models and other sources of data, and probably most importantly, simply stay on top of the weather situation multiple times each day. By doing this we can develop an almost intuitive sense for the evolving weather regime, which helps us quickly digest new information and interpret it correctly. Finally, I think it’s important to cultivate a sense of humility with regards to weather forecasting. Meteorology is a complex business and there is much we do not know. This is particularly true in the polar regions, because in contrast to places such as the continental US, the measurements that feed weather prediction tools are extremely sparse. In practice this sense of humility translates into keeping an open mind about the weather, avoiding coming to hasty conclusions before consulting every possible source and having contingency plans ready in case things do not work out exactly as we thought.