Isolation

From: Kathryn Hansen, NASA’s Earth Science News Team/Cryosphere Outreach Specialist

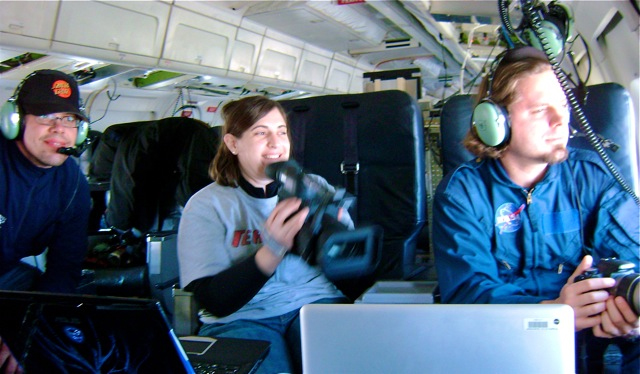
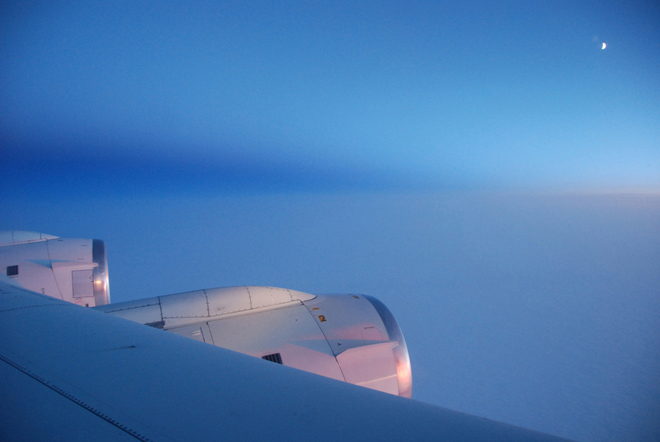
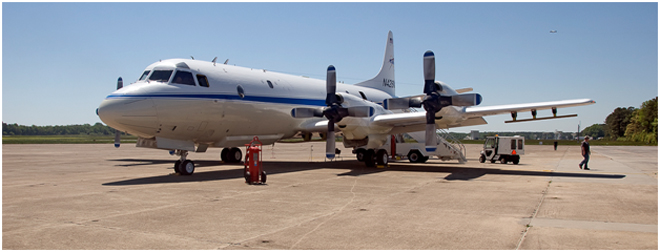
KANGERLUSSUAQ — There was a rumor that the flight on Friday, May 10, would be among the most scenic of the 2010 Arctic campaign. The high-priority flight along Greenland’s southeast coast required clear weather for pilots to maneuver along the sinuous glaciers at low altitudes. We were fortunate. The first opportunity to fly from Kangerlussuaq with the P-3 on this Arctic 2010 campaign turned up clear skies and relatively balmy temperatures, and we lifted off for Geikie Plateau shortly after 8 a.m.

Why Geikie? The plateau is “dynamically isolated” from the rest of the ice sheet. That means what happens to the main ice sheet is not necessarily also happening to Geikie. So, IceBridge scientists want to collect Geikie’s vitals — ice thickness, surface elevation, bedrock profile — and compare them with the rest of the ice sheet. “They’re potentially doing very different things, which can tell you something about climate’s impact on the region,” said John Sonntag, Senior Scientist with the ATM laser instrument and IceBridge management team member.

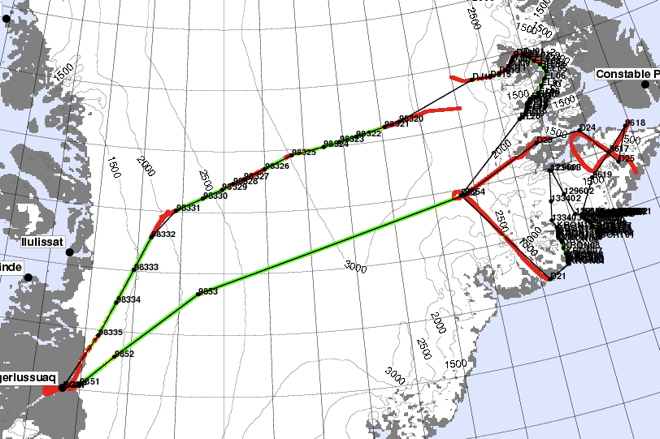
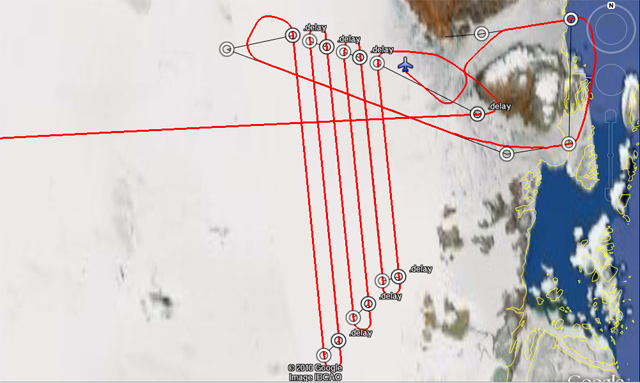
The survey of Geikie Plateau called for about eight hours of total flight time. Credit: NASA/John Sonntag

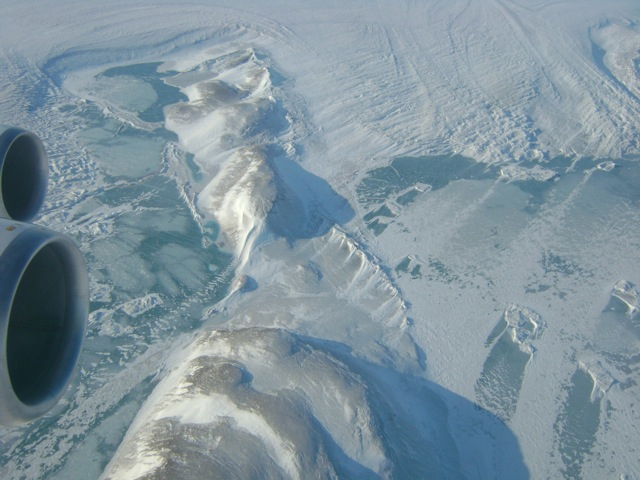
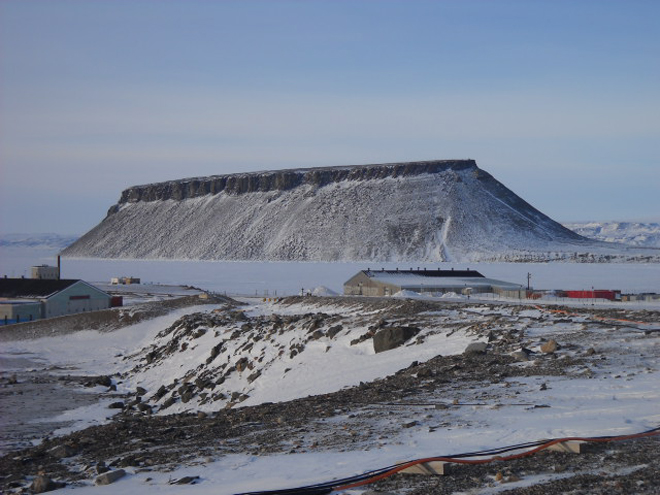
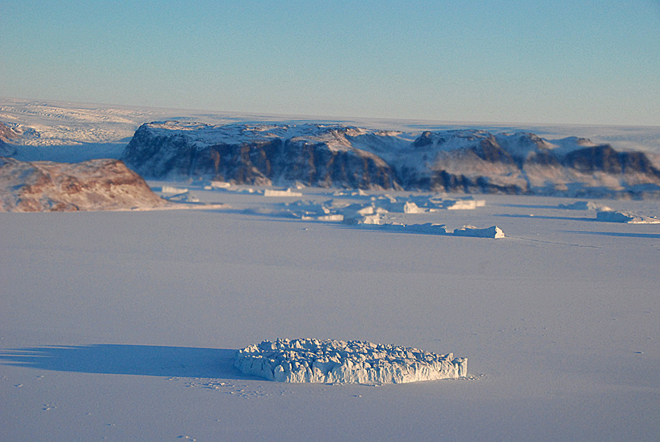
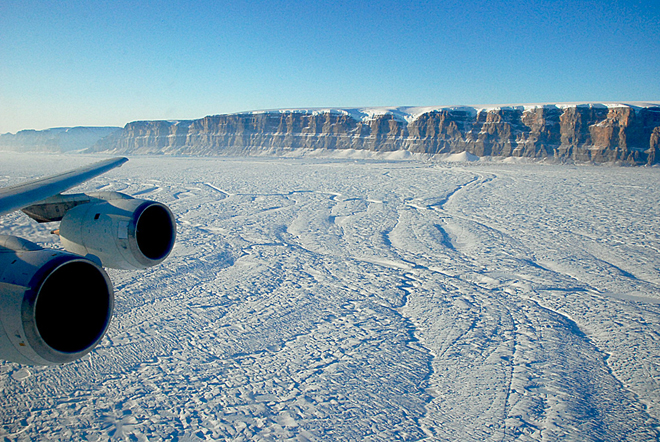
Observing from one of the P-3’s few windows, I was struck by the scale of the landscape. As we closed in on the southeast coast, the flat barren ice sheet soon mingled with occasional hills and then steep mountains with sharp peaks. Ice appeared to be making its escape, flowing down valleys and merging with the glacial superhighway. Some glaciers terminated in cliffs half a mile high. For others, all that remained were the brown, silty remnants.

Ice works its way down between mountains before joining a larger glacier. Credit: NASA

At the same time that I was making my visual inspection, however, IceBridge instruments were collecting a more scientific type of information. Lasers mapped the surface while radars dove down for a look below. Will scientists find that Geikie indeed acts in isolation? They’ll have a better idea after deciphering and analyzing the data. In the meantime, the IceBridge team is plotting to visit a few other isolated ice sheets throughout the mission — if time and weather permit.

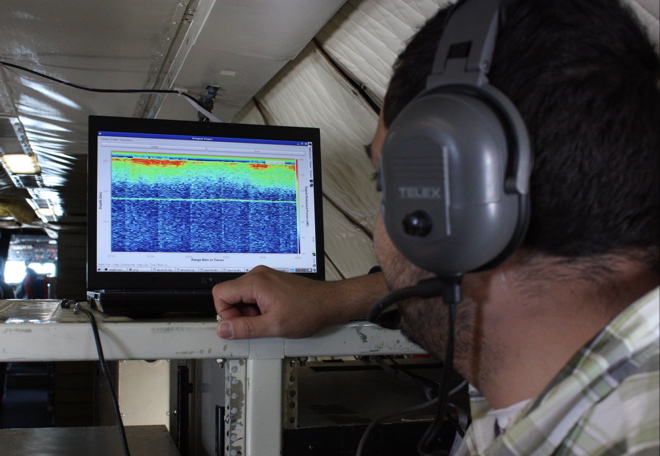
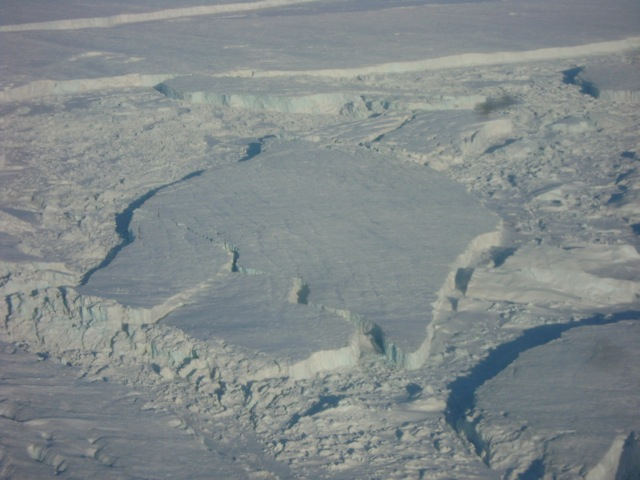
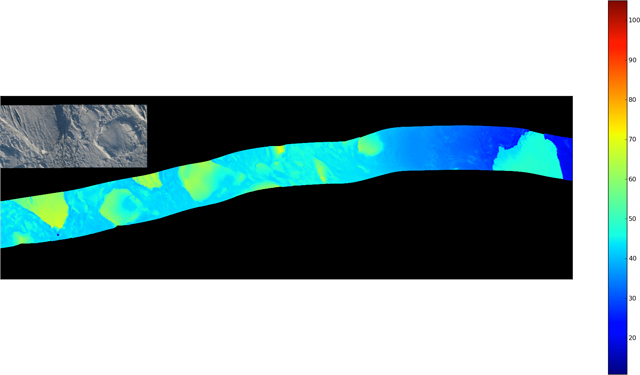
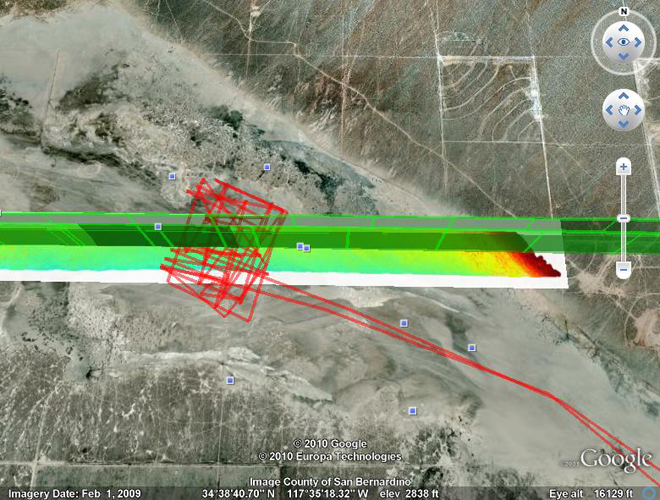
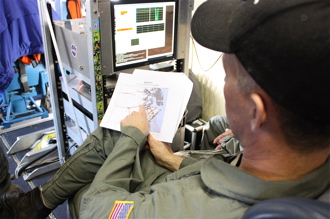
The Multichannel Coherent Radar Depth Sounder instrument shows ice characteristics at depth and also the shape of the bedrock below (thin green line). Credit: NASA

Fasten Your Seat Belts: Mid-Mission Test Flights Complete


From: Michael Studinger, IceBridge project scientist, Goddard Earth Science and Technology Center at the University of Maryland

NASA Wallops Flight Facility, Virginia — During the past week, Operation IceBridge teams have worked at NASA’s Wallops Flight Facility on the eastern shore of Virginia, transferring the science instruments from the DC-8 onto a NASA P-3 Orion aircraft that we will use for the second half of our Greenland campaign. NASA’s fleet of research aircraft allows us to choose the aircraft that is best suited for the science goals that we want to accomplish with IceBridge. We began our work in Greenland with the DC-8 because of its range, load carrying capability, and its ability to fly very high. With the DC-8 we have surveyed the sea ice in the Arctic Ocean and numerous glaciers in northern Greenland. For the second half of the Greenland campaign we will focus on mapping glaciers in southern Greenland using the NASA P-3. The aircraft’s range and maneuverability are ideally suited for low-altitude glacier flying.

The inside of NASA’s P-3 Orion aircraft during installation of Operation IceBridge science instruments at NASA’s Wallops Flight Facility. Credit: Michael Studinger

During the past three months, IceBridge teams from the Center for Remote Sensing of Ice Sheets (CReSIS) at the University of Kansas and Wallops have worked hard to make the impossible possible: designing and manufacturing a complex array of 16 ice-penetrating radar antennas mounted under the wings and the belly of the P-3 and installing and test flying it in only three months! The array of radar antennas is a new development that has never been flown before, allowing us to map heavily crevassed outlet glaciers in unprecedented detail. We will collect several Terabytes of data during each flight that will be processed on a supercomputer at CReSIS when we are back home. The complex array of antennas will allow IceBridge teams to distinguish between radar clutter from surface crevasses and the very weak echo reflected from the base of the glacier of interest. 

NASA’s P-3 research aircraft waits on the ramp at Wallops shortly before taking off for a test flight. The antennas for the ice-penetrating radar system are mounted under the wings. Credit: Michael Studinger

We have now completed a series of mandatory test flights at Wallops to verify the antenna installation and aircraft performance during flight and to check out our science equipment before we leave for Greenland. Research flying has not much in common with everyday air travel. One of the maneuvers that we do during the test flights is to fly the aircraft at a 90° roll angle with the wings perpendicular to the horizon. Fasten your seat belts! You will never experience something like this on a commercial flight. If you do, you might want to consider using a different airline next time.

NASA’s P-3 aircraft during a test flight over Wallops Island, Va. The ice-penetrating radar antennas for Operation IceBridge are mounted under the wings and the belly of the aircraft. Images are courtesy of Rick Hale, CReSIS.

One of the major science goals of Operation IceBridge is to understand the contributions of the Greenland and Antarctic ice sheets to global sea-level rise. During one of the test flights we use the Airborne Topographic Mapper laser system and high resolution aerial photography to map beach erosion on Wallops Island, the location of NASA’s rocket launch facility. Here, at the coast of Wallops Island, rising sea-levels and increased beach erosion are real and need to be considered in long-term planning for the launch facility.

We have now completed all our test flights here at Wallops and are ready to go back to Greenland where we hope to map many of the outlet glaciers and contribute to our understanding and knowledge of future sea-level rise.

Moment of Truth at Summit Camp

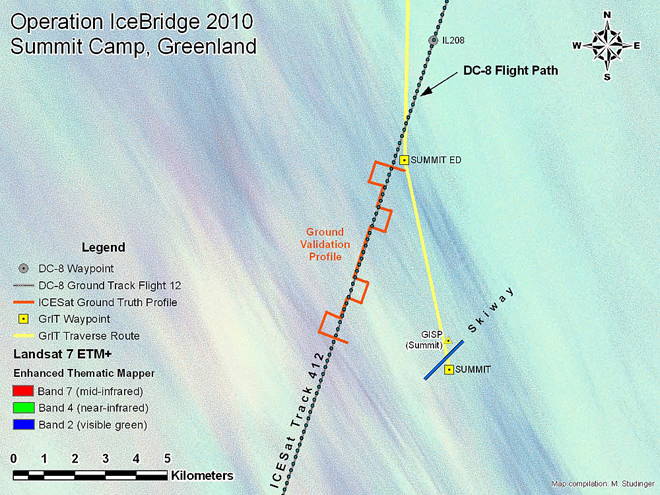
IceBridge mission planners plot some flight lines to match the location — and sometimes the timing — of measurements collected on the ground or from satellites. This “ground-truthing” technique helps scientists calibrate and interpret air- or space-based measurements. On April 14, IceBridge flew along a previous track from the Ice, Cloud, and land Elevation Satellite (ICESat), while at the same time scientists at Summit Camp collected ground-based data. Christina Hammock and Sonja Wolter share some images from the event, and provide a look inside the life of a “Summit Camp techie.”

We had been anticipating this flight for almost a month because we were timing some ground-truthing measurements to coordinate with the flight (more below). We had near-daily contact with John Sonntag for a few weeks prior to the flight over Summit Camp. It took a while, but both the weather and the logistics finally came together for the flight on Wednesday, April 14.

Sonja Wolter(right) from Summit Camp in Greenland was working in the field when NASA’s DC-8 passed overhead. Credit: Christina Hammock

Summit Camp is a research station dedicated mainly to atmospheric and climate research. There are only five people on station during the winter months, which is divided into three phases, late August to early November, early November to early February, and early February to late April. During the summer (late April to late August), the station population goes up to 25-50 researchers and support staff (starting a week from today with the arrival of an LC-130 bringing about 25 people – ack!)

Our crew includes a Station Manager — Ken Keenan; a heavy equipment operator — Geoff Miller; a power plant mechanic — Luke Nordby; and the two of us — the Summit science technicians. When we have an involved task like the IceBridge coordination, everyone helps get us out the door.

Gear for the IceBridge and ICESat transect at Summit Station included two snowmobiles, an emergency snow camper, a GPS system and a bamboo pole to make the measurement. Credit: Sonja Wolter

As science techs, we carry out and maintain all the ongoing experiments at or near camp. One of these experiments is the ICESat transect, which is (or was) a ground-truthing measurement for the now-defunct ICESat. The Summit ICESat transect is a zigzagging path of bamboo poles that underlies one of the swaths of the icecap that an ICESat overpass used to include. Once per month, we manually measure the snow depth at the poles and also get exact GPS coordinates at these spots.

To do this, we drive two snowmobiles out and cruise (well, putt putt) along the line poles (at -35 F this week). We don’t know for sure, but we’re guessing the round trip is about 8 miles, and it takes us 2.5 to 3 hours. Although the ICESat instruments are no longer working, we have carried on with the transect measurements to continue the data set for this snow accumulation study. This month’s measurements had the extra bonus of being coordinated with IceBridge for verification of their measurements.

During the winter, the last brush with the outside world (not including the world wide web and telephone, that is) is the Twin Otter flight that comes to pick up the outgoing crew after a week of turnover. So, seeing the NASA DC-8 plane was the first reassurance that people are in fact still out there. Maybe we are geeks, but it was exciting and fun for us to be a part of the IceBridge project.

On April 14, 2010, NASA’s DC-8 flew over Summit Camp, Greenland. Credit: Christina Hammock

When not on the ice, Sonja Wolter works full-time as the operations coordinator for NOAA’s Carbon Cycle/Greenhouse Gases group in Boulder, Colo. Christina Hammock works in Space Science Instrumentation at the Johns Hopkins Applied Physics Lab in Laurel, Md., and formerly worked in the Laboratory for High Energy Astrophysics at NASA’s Goddard Space Flight Center. 

The downward-looking Digital Mapping System camera captured an image of what scientists think is the ground crew from Smmit Camp.Credit: NASA

Notes from the Shack: On Receivers and Data Processing

From: Colleen McIntosh, data analyst/programmer, Sigma Space/NASA’s Goddard Space Flight Center

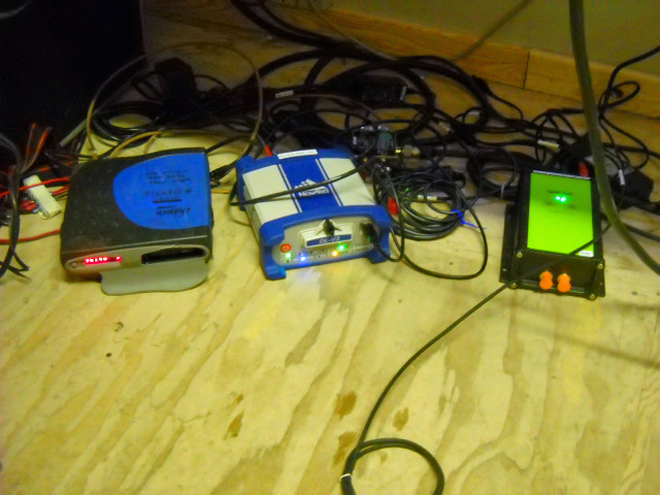
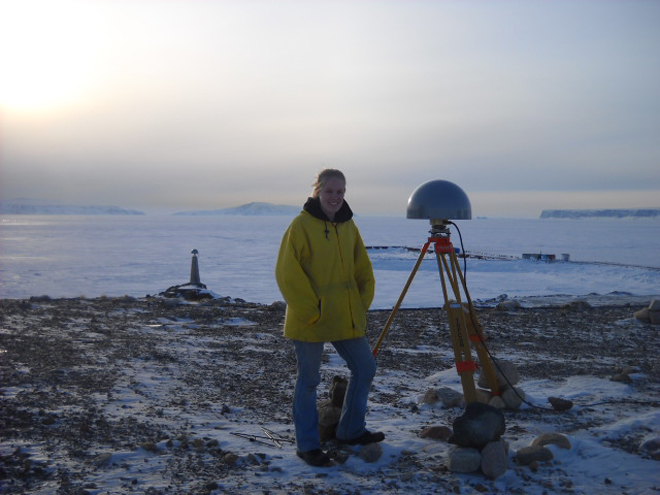
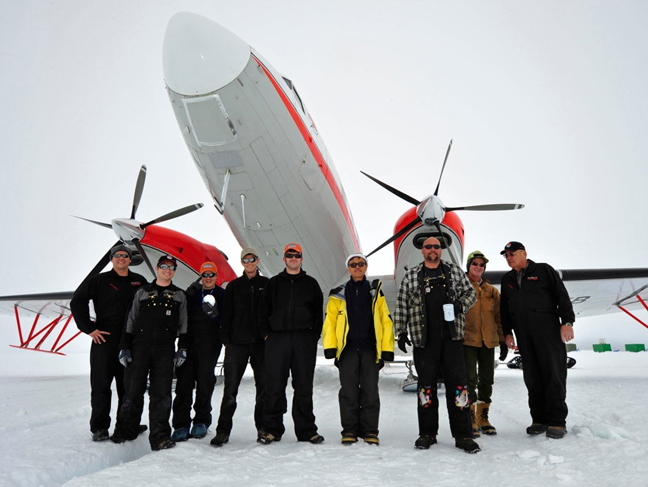
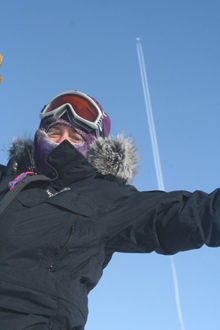
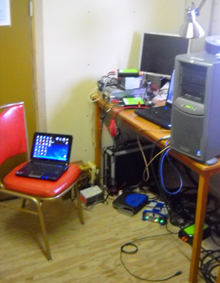
Staying on the ground as part of the GPS base station crew, there isn’t a whole lot to do as far as maintaining the receivers. The Land, Vegetation, and Ice Sensor (LVIS) team has three receivers, all different. We have a Javad which records data at 20 hertz, a Novatel which records data at 10 hertz and an Ashtech which records data at 2 hertz. These receivers are running all day every day.

Running receivers at different frequencies is somewhat of an experiment. The higher the frequency the more data points you get and, theoretically, the better the results. We are just testing that theory to figure out the best rate for LVIS.

I check on the receivers twice a day: once in the morning before the flight takes off, and then again an hour after the plane lands. The most important data, of course, is taken while the plane is in flight. The remaining data is used to get the most accurate position of our base station possible. Inside the collected data file are coordinates, which should be the same from day to day, but nothing is perfect, so they are slightly different. We take an average of the coordinates, and I use those values when processing the data.

It may seem that I only do something before and after the flight, but while the plane is in flight I process the data collected from previous days. The internet is rather slow up here, so sometimes processing can take some time.

Zachariae and 79 North

The IceBridge flight on Tuesday, March 30, marked the first of a four-flight series to measure the Zachariae and 79 North glaciers in northeast Greenland. The flight made six parallel passes up and down the uppermost, inland portion of the glaciers. The beds of these glaciers are below sea level, which has implications for how the glaciers interact with ocean water and how they lose ice. The planned part of the survey concluded early, so the crew decided on-the-fly to add two extra flight lines — one pass down the middle of each glacier. Jim Yungel, of NASA’s Wallops Flight Facility, captured a series of photos throughout the low-altitude flight:

The actual flight path, including two extra flight lines down the middle of the glaciers. 

Thule plow and sweeper clear the ramp and taxiway before the flight. Credit: Jim Yungel/NASA’s Wallops Flight Facility

Nunataks — hills or mountains encircled by a glacier — are seen among the ice. Credit: Jim Yungel/NASA’s Wallops Flight Facility

Glacial blocks are seen near Zachariae Glacier. Credit: Jim Yungel/NASA’s Wallops Flight Facility

A close up view shows details within glacial blocks seen near Zachariae Glacier. Credit: Jim Yungel/NASA’s Wallops Flight Facility

The science team and a NASA video producer watch the glacier. Credit: Jim Yungel/NASA’s Wallops Flight Facility

Preliminary data from the Airborne Topographic Mapper (ATM) show the topography around the Zachariae Glacier calving front region. The image contains preliminary data and is not for scientific analysis. Credit: Rob Russell/ATM team

Notes from The Shack


From: Colleen McIntosh, data analyst/programmer, Sigma Space/NASA’s Goddard Space Flight Center


Colleen McIntosh stands by the ground-based GPS antenna for the airborne Land, Vegetation, and Ice Sensor. Credit: Image courtesy of Colleen McIntosh

I am the GPS processor for the Land, Vegetation, and Ice Sensor (LVIS) team, along with Michelle Hofton. After arriving in Thule, Greenland, Michelle showed me the GPS Shack, which is where I will be working during the IceBridge mission. That’s where the ground-based GPS antennas and receivers for both the airborne LVIS and Airborne Topographic Mapper (ATM) instruments are located.

“The Shack,” as we call it, happens to be on the opposite side of the base from rest of the buildings. It is very small — just big enough for a couple computers, receivers, and some chairs. Just outside the Shack is the pier in the North Star Sea. There is also a great view of Dundas Mountain, which we may be able to climb if it gets warm enough while we are here.

The view of the North Star Sea as seen from just outside the GPS Shack. Credit: Image courtesy of Colleen McIntosh

The view of Dundas Mountain as seen from the GPS Shack. Credit: Image courtesy of Colleen McIntosh

While at the Shack, both the ATM GPS person and I check on the height of our antennas as well as replace data cards and download the GPS data from our receivers. The winds always seems to pick up once we get to the Shack since we are right on the frozen water, so measuring the height of the antenna can be rather difficult. As you can see in the picture we have several rocks weighing the antenna’s tripod down so it does not blow over.

Over the years and several trials later, the LVIS group has, I believe, come up with the best standing position for our tripod set up, so the wind doesn’t blow it over and so it doesn’t sink into the ground too much. The antenna is checked and the data is downloaded about twice a day, usually before and after a flight. But we also leave the receivers running on days we don’t fly to collect as much data as possible. This allows us to get the best position possible for the antenna, which in turns gives us an accurate position when we combine it with the flight GPS data.

Once the GPS data is collected, then the processing fun begins. Collecting data is a daily job for the GPS ground crew, and at the end of a mission, boy do we have a lot of data to process!

Calibrating in California

Before the IceBridge crew flew to Thule, Greenland, they performed a test flight on March 17 in California to calibrate the aircraft’s science instruments.


From: John Sonntag, senior scientist with the IceBridge management team, URS Corporation in Wallops Island, Va.

This Google Earth image graphically illustrates one of the many techniques the Airborne Topographic Mapper (ATM) team utilizes to calibrate and validate our instrument.

The image shows El Mirage Dry Lake, about 25 miles east of Palmdale, Calif. We overflew the lakebed three times on the March 17 test flight — the flight paths are shown in green. The extremely detailed elevation measurements made by the ATM are depicted by the multi-colored swath, with warm colors depicting topographic “highs” and cool colors depicting lows. The red path is a survey we conducted of the lake surface with a GPS-equipped vehicle.

By comparing the ATM laser swath measurements with the surface measurements we made using the GPS-equipped vehicle, we can derive a variety of calibration measurements for the ATM, which we use to improve its accuracy and precision, ultimately to the level of a few centimeters. This process has just begun and will be supplemented by many other datasets as we proceed with the campaign.

Another aspect this image illustrates is the extremely high precision of our navigation systems, which are also part of the ATM system. The flight crew “coupled” their autopilot to our precise navigation system for all three of these passes. The result was that all three passes were within just a few meters of each other — pretty impressive when we’re flying at 250 knots!

NASA Readies for Spring 2010 Ice Bridge Campaign

From: Kathryn Hansen, Science Writer, NASA’s Earth Science News Team


Credit: John Sonntag/Wallops Flight Facility

In August 2008, NASA scientist John Sonntag, of NASA’s Wallops Flight Facility in Wallops Island, Va., captured this view of a small iceberg as it moved down the Narsarsuaq fjord in southern Greenland. “I spent about half an hour watching that little berg, which was in the process of disintegrating during the time I was watching,” Sonntag said. “It went from a complete, small berg to a collection of floating ice rubble within that small span of time. The place was so quiet that the noise of the berg softly coming apart was the only sound present.”

Sonntag’s observation took place during the 2008 NASA and Center for Remote Sensing of Ice Sheets (CReSIS) airborne deployment in Greenland. This spring, Sonntag and other scientists return to the Arctic for big picture and little picture views of the ice as part of NASA’s six-year Operation Ice Bridge mission — the largest airborne survey of Earth’s polar ice ever flown — now entering its second year. The project team is finalizing flight paths over Greenland’s ice sheet and surrounding sea ice, where scientists will collect measurements, maps and images from a suite of airborne instruments. Such information will help scientists extend the record of changes to the ice previously observed by NASA’s Ice, Cloud, and land Elevation Satellite (ICESat), while uncovering new details about land-water-ice dynamics.

NASA aircraft have made numerous science flights over Greenland, most recently during the spring 2009 Ice Bridge campaign and also in 2008 as part of the NASA/CReSIS deployment. Smaller-scale airborne surveys have been made by William Krabill, of NASA Wallops, and colleagues nearly every spring since 1991.

Visit the Operation Ice Bridge Web page throughout the spring 2010 campaign for news, images, and updates from the field. Flights from Greenland are scheduled to begin no sooner than March 22.


Operation IceBridge Off to a Successful Start in Greenland

From: Michael Studinger, IceBridge project scientist, Goddard Earth Science and Technology Center at the University of Maryland

Hello and a warm welcome to all blog readers from the IceBridge team here at Thule Air Base in northern Greenland. After taking off on Sunday night from NASA Dryden’s Aircraft Operations Facility in Palmdale, Calif., the NASA DC-8 arrived at Thule Airbase on Monday afternoon. Both the aircraft and science teams have done an incredible job in setting up operations in record time here in Thule. 


The moon and sunrise are visible over the Arctic Ocean during the flight from Palmdale, Calif., to Thule, Greenland. Credit: Michael Studinger

We were able to take off for an eight-hour science flight on Tuesday morning to survey the sea ice in the Arctic Ocean north of Ellesmere Island. Wednesday’s science flight was targeted at several glaciers north of Thule. Some of the glaciers have been surveyed for the first time last year and we are back this year to monitor the changes that have occurred since last spring. We begin the day with flying over a small glacier called Heilprin Glacier. We are very early in the season and the sun is just above the horizon in the morning hours, illuminating the coast of Greenland with its frozen fjords, icebergs and glaciers in a beautiful light. 


The sun is very low and only barely above the horizon at the beginning of the third science flight, creating beautiful illumination of the cost of Greenland with its frozen fjords, icebergs and glaciers. Credit: Michael Studinger

After an hour of flying we begin to fly a grid pattern in the catchment area of Petermann Glacier to measure the thickness of the ice with a radar system from the University of Kansas. These data will be used as input for computer models that will allow us to better predict how the Greenland ice sheet will respond to environmental changes in the Arctic.

We continue our flight by repeating two survey lines along Petermann Glacier that have been surveyed several years before. The scenery with the steep sidewalls is spectacular. We can see huge meltwater channels on the surface that will be filled with water running down the glacier when the Arctic melt season starts in a few months. 


The IceBridge crew fly down Petermann Glacier in northern Greenland with NASA’s DC-8 aircraft. Credit: Michael Studinger

After completing the flight lines over the Petermann Glacier we turn back towards Thule Air Base and measure the ice surface elevation with a laser altimeter along a track that has been measured many times by NASA’s ICESat satellite. We are heading back to Thule Airbase to land before the tower and airfield close for the day. 


At the end of a day of glacier flying, Dundas Mountain — a major Greenland landmark — can be seen during the approach to Thule Air Base. Credit: Michael Studinger

We have had an incredibly successful start of the 2010 Arctic campaign. We have been able to collect LVIS laser data along the transit from California to Greenland and have been flying 3 days in a row collecting huge amounts of data. A storm system here in Thule has forced us today to stay on the ground and everyone is catching up with sleep and data processing. With a little bit of luck we hope to fly the DC-8 again on Friday. Thanks to all the aircraft and science teams, the staff at Thule Air Base, and many people back home who have made such an incredible start of the IceBridge 2010 campaign possible!


ICECAP Investigates East Antarctica


From: Kathryn Hansen, Science Writer, NASA’s Earth Science News Team

Operation Ice Bridge scientists and crew completed 21 successful flights over West Antarctica and returned home in time for Thanksgiving. Still flights over the icy continent continue. Scientists with another field campaign — Investigating the Cryospheric Evolution of the Central Antarctic Plate, or simply ICECAP — are making ongoing airborne investigations over East Antarctica.


The ICECAP Casey/DDU survey team at Casey from left to right: Dean Emberley (KBA), Jamin Greenbaum (Texas), Jorge Alvarez (Texas), Andrew Wright (Edinburgh), Duncan Young (Texas), Young Gim (JPL), Dave Meyer (KBA), Noel Paten (AAD), Ray Cameron (KBA); not pictured Glenn Hyland (AAD). Credit: Todor Iolovski (Bureau of Meteorology)


ICECAP, for which NASA’s Ice Bridge is funding some of the flights, is an international collaboration with principal investigators from University of Texas at Austin’s Jackson School of Geosciences, the University of Edinburgh, and the Australian Antarctic Division. The goal is to use airborne instruments to chart ice-buried lowlands, which could show how Earth’s climate changed in the past and how future climate change will affect global sea level.

Where have they flown and what have they observed? ICECAP’s University of Texas researcher Duncan Young provided some updates from the field:

Dec. 8, 2009

Right now we are preparing to begin our shift from McMurdo to Australia’s Casey Station via the joint French-Italian base on top of the ice sheet, Concordia, after completing our ICECAP flights out of McMurdo today with Flight 16, right down the maw of Byrd Glacier. Tomorrow we will use our survey plane to move people and cargo to Concordia, surveying all the way, and then return to McMurdo. On Wednesday we will move the rest of our people using our aircraft all the way to Casey from McMurdo. It is a complex multinational ballet, where the timing of weather at locations over 1,250 miles (2,012 kilometers) apart is critical. Then we will begin our ICECAP/Ice Bridge operations out of Casey Station with our Australian colleagues.

Dec. 22, 2009

Using an upgraded DC-3, we have completed five flights, each about seven hours long out of Casey Station, in addition to the 20 flights we completed out of McMurdo Station. Three of these Casey based flights have flown over 2,330 miles (3,750 kilometers) of ICESat tracks, over the rapidly lowering Totten and Denman Glaciers.


Denman Glacier; Credit: Jamin Greenbaum, University of Texas at Austin


T
oday we are conducting an ambitious 10-hour flight to finish off our Casey work for this season. We will be flying to Concordia Station in the center of the ice sheet, picking up fuel and base GPS data we have been gathering over the past ten days to help improve our aircraft positions, and thus the surface elevations we have been measuring.

Then we will fly along a ‘tie-line’ to connect several transects we flew last season to the Dome C ice core. By tracking ice layers in the radar data, we have a chance to find where some of the oldest ice in Antarctica might lie, perhaps more than a million years old. This old ice would contain greenhouse gasses from the past, leading to a better understanding of climate change if it is drilled. The aircraft will then return to Casey station along our last targeted ICESat line along Totten Glacier.

After this flight, we plan to move to Dumount d’Urville Station in time for a French Christmas dinner — if the katabatic winds there allow it …