IceBridge the subject of interest at two meetings

By George Hale, Science Outreach Coordinator, NASA Goddard Space Flight Center

Operation IceBridge has been a subject of interest over the past two weeks in different parts of the world, with a presentation in Copenhagen on the mission’s recent work and the Antarctic campaign science operations meeting in Seattle.

At a meeting of the U.S.-Denmark-Greenland Joint Committee in Copenhagen on June 13, U.S. Embassy public affairs officer Robert Kerr delivered a presentation on the cooperative education and outreach efforts that took place during the 2012 Arctic campaign. During his presentation, Kerr talked about the joint effort between NASA, embassy personnel, and people from the Danish and Greenlandic education ministries to provide a research experience for Danish and Greenlandic teachers. He also spoke on their work getting journalists on board the NASA P-3B and showed examples of upcoming articles by a Danish reporter.

The IceBridge science and instrument teams held their 2012 Antarctic campaign planning meeting in Seattle from June 20-22. The meeting featured speakers from the IceBridge science and instrument teams, the Cryospheric Sciences Laboratory at the NASA Goddard Space Flight Center and from NASA headquarters. There were also planning sessions for the upcoming Antarctic campaign. Speakers talked about the various IceBridge instruments, the 2012 Arctic campaign, NASA’s overall vision for IceBridge, the future of the mission and the status of ICESat-2, scheduled for launch in early 2016.

Science and instrument team members at the Antarctic campaign planning meeting at the University of Washington in Seattle.

IceBridge science and instrument team members at the Antarctic campaign planning meeting at the University of Washington in Seattle. Credit: Hajo Eiken/ University of Alaska – Fairbanks.

During the breakout planning sessions, team members summarized the collected mission plans for Antarctica, identified the need for additional missions and discussed future directions and potential new measurement requirements. The IceBridge science meeting is one of many steps on the way to the Antarctic campaign scheduled to start later this year.

IceBridge at the 2012 Goddard Science Jamboree

By George Hale, IceBridge Science Outreach Coordinator, NASA Goddard Space Flight Center

Operation IceBridge personnel participated in this year’sGoddard Science Jamboree on June 5. The yearly event is an opportunity forscientists and engineers at Goddard to share information about their meetingswith each other. This year’s Science Jamboree featured displays from a varietyof Goddard’s science missions, career panel talks, Hyperwall demonstrations,information sessions and a special lecture by Goddard Chief Scientist JimGarvin.

IceBridge project scientist Michael Studinger (left) and project manager Christy Hansen (right) at the Operation IceBridge display table

IceBridgeproject scientist Michael Studinger (left) and project manager Christy Hansen(right) at the Operation IceBridge display table. Credit: NASA/George Hale

Members of the Airborne Topographic Mapper (ATM) and Land,Vegetation and Ice Sensor (LVIS) instrument teams ran display tables with posters,photos and videos alongside a general IceBridge information display, adding awealth of information about the airborne polar mission. IceBridge scientistsand engineers answered questions about polar science, IceBridge’s instrumentsand the experience of surveying Arctic and Antarctic ice from the air. With thecompletion of a record-breaking Arctic campaign and several weeks of intenseAntarctic campaign planning ahead, the Science Jamboree was a good chance formembers of the IceBridge team to get together and show off all of their hardwork. Special thanks go out to all the people who took time out of their busy days to make the IceBridge presence at this year’s jamboree a success. 

Matt Beckley presented information on the LVIS instrument

Matt Beckley presented information on the LVIS instrument. Credit: NASA/George Hale

Weather and Operation IceBridge

By John Sonntag, OIB Instrument Team Lead, NASA

If you know the saying “make hay while the sun shines”, you’ve already got a pretty good idea of how weather affects flight operations for Operation IceBridge. Generally speaking, our flights require clear skies over the area in which we are operating on any given day. There are two good reasons for this. First, some of our sensors, including the Airborne Topographic Mapper and the Digital Mapping System, are optical instruments and need the sky between the aircraft and the ground to be cloud-free to obtain their measurements. Second, since we usually fly low and close to terrain (and sometimes amongst mountain peaks), our pilots need clear skies in order to see and avoid the terrain for flight safety reasons. These requirements mean that weather largely governs what we do on any given day, and makes it necessary for OIB project scientist Michael Studinger and myself to remain immersed in the minutiae of polar weather every day while we are in the field. On every potential flight day, we must make a decision about whether to fly and where to fly, and if we make the wrong decision we might face the mortifying prospect of returning from an expensive taxpayer-funded flight without science data to show for it. So far in the 3-year history of OIB, that has not happened, and Michael and I very much want to maintain that record.

Michael and I typically start studying the current weather patterns governing our operating areas at least a week prior to our deployment. It is helpful to develop a sense of context and a feeling for the current weather systems and their movements before we must begin making decisions on flight days. Our primary tools for this, and for all of our weather analysis tasks, are satellite imagery in several wavelengths, meteorological forecast models and point observations of current weather conditions from observers on the ground.

An early morning weather satellite image of Greenland and Arctic Canada, taken on 9 May 2012.

An early morning weather satellite image of Greenland and Arctic Canada, taken on 9 May 2012. This image is an infrared image from a NOAA polar orbiter, and while it shows significant cloud cover at several altitudes over western Greenland, we chose to fly a mission along a narrow corridor along the northwest coast of Greenland where the weather was clear. Credit: NOAA

Satellite imagery, most of which is provided by NOAA polar-orbiting satellites in our case, gives us a snapshot of the clouds over an area of interest. Imagery in the infrared band shows us not only the extent of the clouds over an area but also suggests the altitude of the cloud tops, since the infrared band is sensitive to temperature, and cloud temperatures are dependent on their altitude. Basically, bright white clouds are high, gray clouds are medium or low, and ground fog can sometimes be almost indistinguishable from the ice surface as their temperatures are similar. Visible imagery is better at showing us texture, which helps us distinguish between ice surface and fog, estimate the thickness and density of the cloud cover and determine the distance between cloud bases and the terrain beneath by virtue of the shadow they cast on the surface, especially when the sun angle is low. Another type of imagery we sometimes use is known as the “3 micron” band for its wavelength. This type is particularly sensitive to the amount of water vapor present in cloud masses.

We often refer to ground observations to help us refine our interpretation of satellite imagery, primarily because they provide a reliable measurement of the distance between the ground and the cloud bases. Sometimes the clouds are high enough and the terrain sufficiently benign that we are able to fly below the cloud bases, and point observations occasionally allow us to make such a judgment with some confidence we might not otherwise have. We must be careful, however, to remember that these observations are valid at one point only, while our flights cover large distances.

But for forecasting weather into the future, we are highly dependent on computer meteorological models, which predict what the weather may be like later in a day, or into the next day or beyond. Such information is critical for planning and optimizing our flight selections. For example, we might examine satellite imagery early on a potential flight morning and conclude the weather over our target is clear, but if a forecast model shows that the weather there will deteriorate by mid-day we would probably choose not to fly there. Sometimes the reverse occurs, where morning imagery might show marginal conditions over a target area but the forecast models confidently predict quick improvement. In such a case we might choose to launch a flight into the area, if our confidence in the model predictions is sufficient.

A typical flight day for me (and probably Michael as well) literally starts with weather as soon as I roll out of bed. The first thing I do every morning, even before brushing my teeth, is to open up my laptop and download a few satellite images to get a sense of cloud cover. That way I can mull it over while I get showered and into my flight suit and have breakfast. After breakfast, Michael and I, and our pilots, head to the local airport’s weather office to get their take on the weather where we are going. I cannot stress enough the importance we place on our discussions with these professional meteorologists, nor can I praise them enough for the help they invariably give us. Most of them seem to genuinely enjoy the professional challenge we bring to them, since the kind of flying we do, and the weather we are dependent on, are so different from those of the flight crews they normally deal with. In this morning weather briefing, we go over everything they have available, including satellite imagery, model predictions, point observations, and their own professional and experientially-derived “feel” for the conditions. Once we have gathered all the information available, it is decision time. We always remember that when we launch a flight, we are committing the U.S. taxpayer to pay many thousands of dollars to operate a big, expensive aircraft that day. So we take this decision very seriously, and at times it can be a rather nerve-wracking process.

Icebergs in a northwest Greenland fjord shrouded in fog.

Icebergs in a northwest Greenland fjord shrouded in fog. Credit: NASA/Jim Yungel.

Once in the air we constantly monitor the weather to see if it was as we expected, based on the morning weather briefing. It usually is, though the exact locations of cloud boundaries and ceilings are sometimes slightly different from what was predicted, and occasionally ground fog might exist where we did not expect it. We find that ground fog is consistently the most difficult aspect of polar weather to predict, although it has never adversely affected a flight to a serious degree. We also monitor the winds and compare these to the forecasts, which is important because winds can create turbulence under certain conditions, and turbulence can create a variety of problems for us.

Once we land, Michael and I immediately head back to weather office to get a forecast for the next day. Next, based on what I heard at this post-flight briefing and on further information I obtain from the internet, I prepare a weather briefing for the entire field team, which I give at our nightly science meeting. This briefing usually has two parts. First is a quick retrospective analysis of the day’s mission, comparing the weather we expected with what we actually encountered. Doing this on a daily basis helps us fine-tune our understanding of the performance of various weather models, our interpretation of imagery and our general decision-making process. Next I give an overview of our expectation of the next day’s weather and which flights might be best-suited for it. This enables the flight crew and the instrument operators to prepare for the next day’s activities.

The next morning, the process starts all over again. By the time we end a long deployment (the current one will be 11 weeks long), I look forward to spending entire days without looking at a weather image. But to be honest, I am at heart a weather geek, and after being back home for a while I miss the sense of connectedness I had to the natural world from remaining so immersed in meteorology for such a long time.

I have found that the key to successful weather-based decision-making is to consult as wide a variety of sources as possible, diligently calibrate oneself to the strengths and shortcomings of all weather models and other sources of data, and probably most importantly, simply stay on top of the weather situation multiple times each day. By doing this we can develop an almost intuitive sense for the evolving weather regime, which helps us quickly digest new information and interpret it correctly. Finally, I think it’s important to cultivate a sense of humility with regards to weather forecasting. Meteorology is a complex business and there is much we do not know. This is particularly true in the polar regions, because in contrast to places such as the continental US, the measurements that feed weather prediction tools are extremely sparse. In practice this sense of humility translates into keeping an open mind about the weather, avoiding coming to hasty conclusions before consulting every possible source and having contingency plans ready in case things do not work out exactly as we thought.

Airborne education: Science teachers in Kangerlussuaq

By George Hale, IceBridge Science Outreach Coordinator, NASA Goddard Space Flight Center

This year’s Arctic campaign distinguishes itself from previous ones by welcoming visiting teachers from the United States, Denmark and Greenland. Through cooperation with the U.S. Embassy in Copenhagen, the Danish Ministry of Education and the National Science Foundation’s PolarTREC program, five teachers—two from Denmark, two from Greenland and one from the United States—were chosen to join Operation IceBridge in April.

These teachers will be embedded with the IceBridge team for several days, staying with IceBridge personnel in the KISS facility, riding along on survey flights and attending daily science meetings. The teachers will trade off days flying and days on the ground during their stay, with activities such as a glacier field trip and excursion to a nearby fossil site.

Teachers looking at the day's survey map

From left: Teachers Peter Gross, Erik Jakobsen and Tim Spuck, and CReSIS instrument team member Aqsa Patel examine the day’s planned survey route. Credit: NASA/Jefferson Beck 

Meet the teachers

Peter Gross is a physics and math teacher at the Roskilde Technical Gymnasium in Roskilde, Denmark. Gross uses the science and math skills he gained in his education and during his time as an engineer and his tremendous enthusiasm for teaching to educate a new generation of science, technology and mathematics (STEM) students.

Erik Winther Jakobsen teaches at the Aalborg Gymnasium in Aalborg, Denmark, and has for the past several years worked on the subject of human environmental impacts and climate change. While working on and teaching this subject, Jakobsen noticed a need for more reliable time-series data on ice sheets, something Operation IceBridge is working to achieve. 

Sine Madsen has been teaching biology with an emphasis on climate change in the Arctic at the Building and Construction school in Sisimiut, Greenland, for the past 10 years. Madsen hopes to use her new knowledge about how climate is changing in the Arctic and share these insights with her students back home. 

Tom Koch Svennesen is a chemistry and comparative religion teacher at Aasiaat GU in Aasiaat, Greenland. Svennesen has seen firsthand how the ice in Greenland has changed in recent years. In his time teaching in Greenland, he has faced a variety of challenges such as the disadvantages faced by Greenlandic youth whose parents don’t speak Danish and thus have a harder time learning the language used in Greenland’s education system. 

Tim Spuck joins IceBridge as part of NSF’s PolarTREC program, an effort designed to embed science teachers in with scientists doing polar research. Spuck teaches science in Oil City, Penn., and aims to use what he’s learned through the program to better reach STEM students in his school. 

The Greenlandic and Danish educators arrived in Kangerlussuaq on April 13 and leave on April 19. Spuck got there the following day and will remain with IceBridge until April 25. After landing, teachers had a chance to see the town, buy groceries and settle into their rooms in the KISS facility before heading to the airport to greet the returning P-3. After the April 13 flight, the teachers sat in on IceBridge’s daily science meeting, where they introduced themselves to the team and decided who among them would be the first to join a survey flight.

Teachers getting an explanation of DMS

DMS team member James Jacobson (left) explains the basics of  the P-3’s Digital Mapping System to Tom Koch Svennesen and Peter Gross. Credit: NASA/Jefferson Beck.

In the air and on the ground

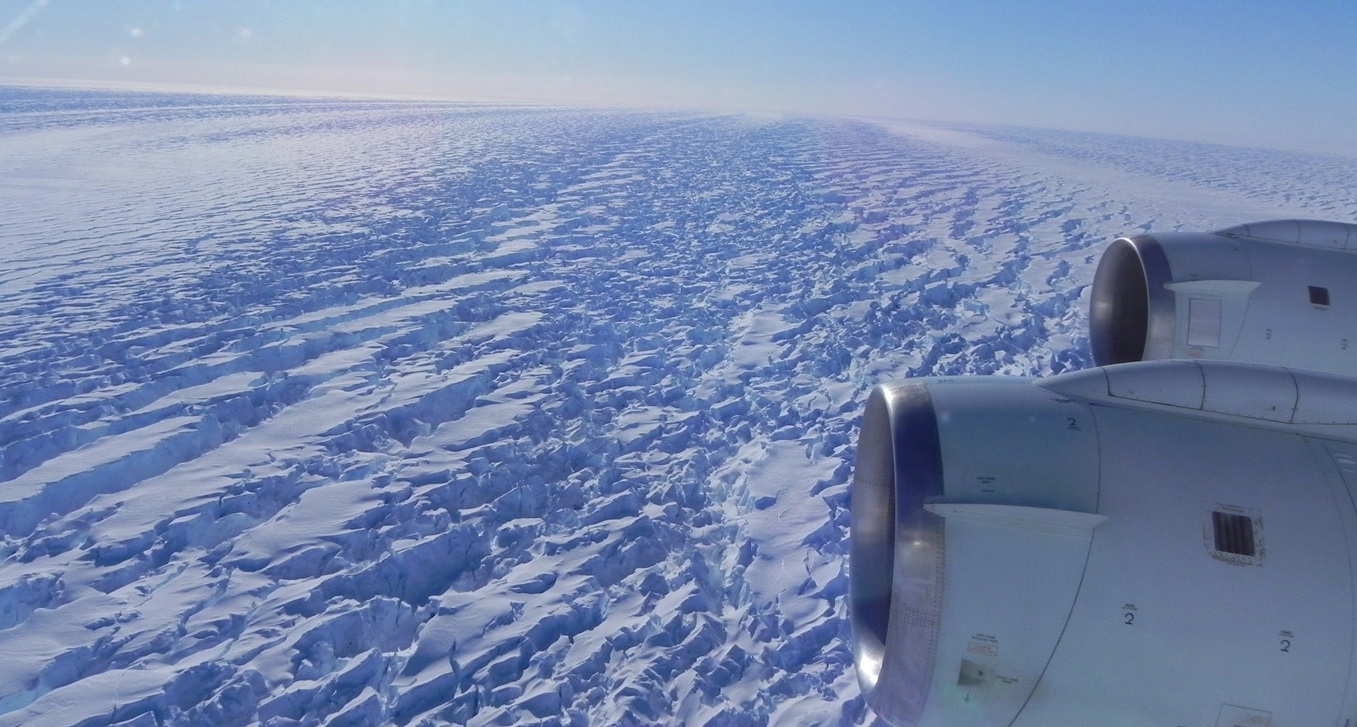
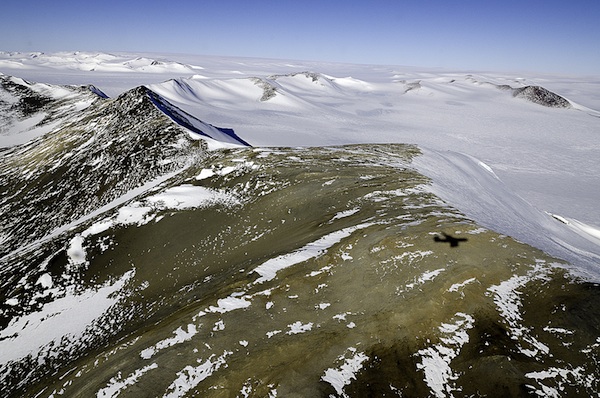
On the morning of April 14, Svennesen and Gross boarded the plane, and after a quick safety briefing by the flight crew, strapped into their seats for the Helheim-Kangerdlugssuaq Gap survey. On this flight, the P-3 would quickly transit the ice sheet and start a series of roughly north-south runs across several glaciers on the east coast of Greenland. This survey, informally known as mowing the lawn, would start close to the shore, gradually moving inland with each pass.

This flight yielded a large amount of data for IceBridge scientists and many sightseeing and photo opportunities for everyone on the plane. Unfortunately, the flight had to be cut short a little early due to concerns about a possible fuel leak in one of the engines. The P-3’s flight crew noticed streaks coming from the engine that could have indicated a leak and the pilots returned directly to Kangerlussuaq as a precaution. After an extensive engine test, the flight crew determined that what they saw was water from melting ice that caused the steaks.

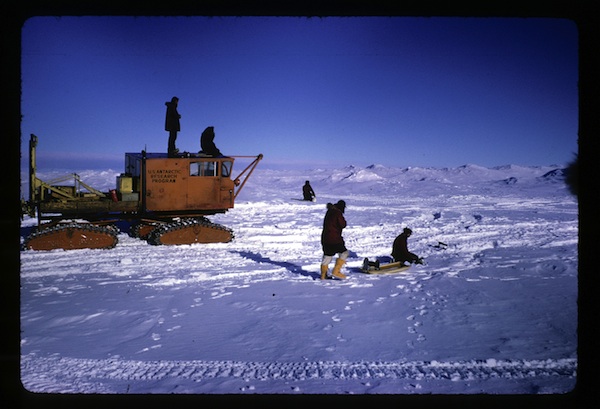
On Sunday the airport was closed, meaning a well-deserved day off for the P-3 flight crew. Without a flight, many IceBridge people, including the teachers, took advantage of their time on the ground to visit the nearby Russell Glacier. The trip gave teachers and scientists a chance to interact, take lots of photos and see part of the Greenland ice sheet up close. That evening, after a busy and windy day of hiking around the ice, everyone gathered for a group dinner in the downstairs kitchen of the KISS facility, which gave teachers more opportunity to learn from scientists and each other.

Early on April 16, Madsen, Spuck and Jakobsen—who didn’t get to fly on Saturday—joined the IceBridge team on another flight, this one a grid survey of glaciers in the Geikie peninsula. At the last minute, an extra seat opened on the P-3, and Gross joined the group while Svennesen stayed behind to work on the website he runs for his students. Despite a fair amount of cloud cover for part of the flight, this survey was another in a long line of IceBridge successes, with ATM only losing about five percent of its data due to clouds. When asked about his favorite moment during the flight, Jakobsen said he enjoyed seeing the interesting geology of the Geikie peninsula and, of course, the pitching maneuvers used to calibrate the radar.

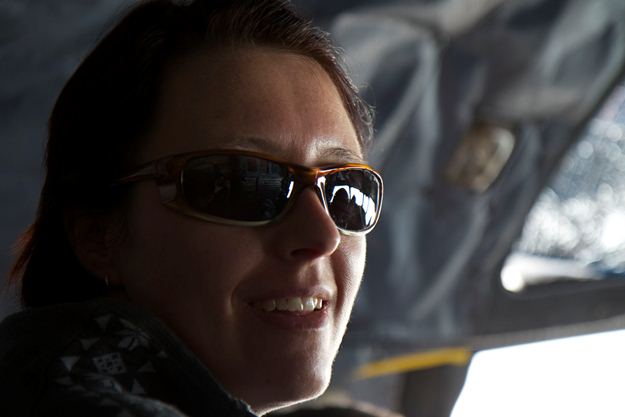
Sine Madsen sits in a jump seat in the P-3 cockpit during an IceBridge survey flight. Credit: NASA/Jefferson Beck

Teachable moments

On each flight the teachers take advantage of opportunities to talk to the science and instrument teams on board. Shortly after takeoff on both flights,  ATM program manager Jim Yungel gave a detailed explanation of the inner workings of the Airborne Topographic Mapper and the science behind using lasers to determine ice surface elevation from the air. They also got to learn more about the Digital Mapping System, gravimeter and magnetometer, and the P-3’s various radar instruments.

The IceBridge experience continued even on non-flight days. During and after a group dinner on Sunday, teachers talked with several members of the science and instrument teams, learning more about IceBridge’s instruments and polar science. Having educators working with scientists and living in the same facility allows for many of these informal question-and-answer sessions, which are often more enlightening than a lecture or information session, and gives them a taste of life as a polar scientist. The experience has also given these teachers new ideas for ways to teach science to their students in ways that are based on real world examples.

Witnessing the last P-3 Arctic sea ice flight for 2012

By George Hale, IceBridge Science Outreach Coordinator, NASA Goddard Space Flight Center

The transfer of IceBridge’s base of operations from Thule to Kangerlussuaq normally marks the end of sea ice surveys done by the P-3 for the campaign. At this time, scientists on the P-3 change their focus toward ice sheets and glaciers, while researchers aboard the Falcon jet using Land, Vegetation and Ice Sensor (LVIS) will continue studying sea ice. But with starting the campaign with a transit to Alaska and beginning operations in Kangerlussuaq by crunching data on the ground while the P-3 is in Wallops being repaired, this year has been anything but ordinary. I’ve been asked to give my views as a newcomer to IceBridge and first-time visitor to the Arctic and I’m happy to share.

First, I have to state that while I have a basic background and interest in science, I’m not a scientist by training. My role as a communicator is not to make scientific discoveries, but to spread the word about them. Part of my job as IceBridge’s science outreach coordinator is to help bridge the gap between what scientists find and what the public understands.

Being outside of the science of sea ice gives me a different perspective on things. I’ve been keeping up with news from the Arctic campaign, but it wasn’t until actually riding along on a sea ice flight that I felt I knew what was happening. Being with scientists as they gather data and sharing the flight experience with them will hopefully help me improve IceBridge’s educational and public outreach efforts.

New to the Program

I arrived in Kangerlussuaq on April 9, the same day as the P-3 returned from Wallops. While flying from Thule the week before, the P-3 started having issues with one of its engines, something unavoidable with the workload and conditions the P-3 is subjected to. In the interest of safety, the pilots shut the engine down and flew directly into Kangerlussuaq. After a one-day delay because of weather, the P-3 made its way back to the Wallops Flight Facility in Virginia for an engine replacement.

The P-3’s return flight to Greenland coincided with my scheduled arrival there, so I was extended an invitation to ride along. Unfortunately, this didn’t work with the arrangements for my commercial return flight, so I wasn’t able to go. I arrived in Kangerlussuaq on an Air Greenland flight Monday morning with enough time to unpack, check my email and buy some groceries before joining others at the airport to see the P-3 arrive.

Bright and early Tuesday morning, I joined 23 other people in braving the 12 degree Fahrenheit weather to board the P-3 for one last sea ice flight along the east coast of Greenland that would put us on an intersecting path with the NASA ER-2 carrying MABEL. At this point in the campaign, IceBridge normally flies glacier surveys, but weather conditions made that unfeasible.


A map of the 2012 Arctic campaign’s sea ice flight. Credit: Michael Studinger/NASA

Sea Ice in Review

This flight was another in a long line of successful sea ice surveys and joint operations with other aircraft. IceBridge has flown 15 sea ice flights, including several along CryoSat orbits and two joint flights with aircraft from the European Space Agency as part of CryoVEx, their CryoSat validation campaign.

Aside from the highly successful joint ESA/NASA flights, this year’s Arctic campaign stands out as completing several more sea ice flights than previous years, covering a distance greater than the circumference of the Earth around the equator. In total, IceBridge has collected huge amounts of sea ice data from instruments like ATM, DMS and the new KT-19 temperature sensor used for sea ice lead detection.

And this data is just sitting around waiting to be processed. This year IceBridge scientists are working to build a quick sea ice product from information that’s only days old. If this proves successful, it has the potential to improve sea ice forecasts and statements for the general public. IceBridge scientist Nathan Kurtz talks about his work with sea ice and the quick sea ice product in his earlier blog post.

A diagram showing sea ice thickness

A diagram showing sea ice thickness and the role snow cover plays

Having successes like these early on sets the bar for the rest of the campaign, and after hearing about IceBridge’s success for several weeks, I now get the chance to witness it first-hand.

My First Sea Ice Flight

I’ve been hearing about IceBridge’s campaign successes since operations began in March. Knowing I would join the team in April and get to see these successes first-hand was very exciting. Being there as things happen promises to be a great experience, and I can only hope to avoid getting in the way. On the morning of my first survey flight, I strap into my seat. I’m not entirely sure what to expect, but I’m ready to see IceBridge at work.

I am in some ways grateful that my first flight was over sea ice. Although it may have been a letdown for those who have flown many sea ice flights this year already, I was glad to have a relatively gentle introduction. Compared to glacier surveys, sea ice flights are smooth and easy, with no crosswinds coming out of fjords and far less turbulence.

As I walked around the cabin I saw members of the IceBridge team working diligently, recording data and making necessary adjustments to their instruments. I also looked out the P-3’s side windows to watch sea ice as we passed 1,500 feet overhead. The flight wasn’t all straight and level though. The pilots put the P-3 through a series of pitching and rolling maneuvers at higher altitude for instrument calibration. The up and down parabolic arcs and resulting feeling of lessened gravity seem to be a favorite, bringing smiles to the faces of both novices such as myself and IceBridge veterans.

A Cold Ride Home

Several hours later we returned to the airport, with the bulk of the team ready to get off the plane and warm up. During the return leg a mechanical issue caused the plane’s climate control to start blowing cold air instead of warm. By the end of the flight, it was around 40 degrees Fahrenheit in the back of the cabin and some bottles of water sitting on the deck were starting to form ice on the bottom.

After landing we take a short break (to warm up) and then head off to the daily science meeting, where we discuss the day’s events and look at weather forecasts to make plans for tomorrow’s flight. The plan is to survey some of the eastern glaciers, which means a more turbulent flight for my second day on the P-3. I’m looking forward to riding along on as many flights as I can in the following days, and to working with the American, Danish and Greenlandic teachers arriving soon to participate in IceBridge.

Synchronized NASA and ESA flights across Arctic Ocean — a success!

By Malcolm Davidson/ESA and Michael Studinger/NASA


Arctic sea-ice from the NASA P-3

Arctic sea-ice from the NASA P-3 (NASA/M. Studinger)

Monday April 2 has been much anticipated bythe teams in Thule, Greenland (NASA) and Alert, Canada (ESA). While the objectivesfor the day were clear – jointly fly with all available planes beneath CryoSat’searly morning pass over the Arctic Ocean – the execution of such flights is andalways will be a challenge. 

Flying joint multi-plane missions is arather daunting task. Departure and rendezvous times and locations need to becalculated and maintained to ensure that the instruments on the differentplanes will see the same sea-ice floes below (these move after all), flightaltitudes need to be established and maintained for safety reasons, instrumentsneed to be warmed up and ready ‘in-time’, somewhat grumpy firefighters need tobe coaxed out to the airstrip ahead of working hours to support an earlydeparture and the list goes on.

With both teams committed to the flights,the first task early this morning was to check the weather forecast for theday. These proved to be good with temperatures of –29°C (–20°F) and generally clear skies; but not ideal! Some rather worryingcloud formations featured near the coast in satellite images.

NASA P-3 cockpit

NASA P-3 cockpit (NASA/M. Studinger)

Nevertheless, after a quick phone callbetween the NASA and ESA coordinators (at a time before most people have yet toreach for their mug of morning coffee) the decision was made: it’s a go.

From then on it there was a flurry ofactivity on both sides, pilots warmed up their planes, instrument teams checkedout their instruments, flight plans were programmed into the onboard computersand so on.

Twin Otter takes off

Twin Otter takes off

The NASA P-3 plane was the first to go out, leaving Thule a full hour before the two ESA planes located closer to the track. On the tarmac in Alert there was the first casualty of the day – despite heroic efforts the EM-bird ice-thickness instrument could not be coaxed into life. The die was cast – the second Twin-Otter plane would have to go it alone and meet up with the NASA P-3.

NASA's sea-ice mission plan for April 2

NASA’s sea-ice mission plan for April 2 (yellow). We teamed up with ESA at 10520 north of Alert. (NASA/M. Studinger)

Around 07:30 (local time) the CryoSat satellite – always on schedule – ripped above the Arctic Ocean taking about one minute to race along the 500-km (310 mile) transect that would later take several hours of plane time to cover.

At 08:00 both the ESA and NASA planes reached the edge of the Arctic Ocean almost simultaneously and headed across the sea ice flying exactly along the same line that CryoSat had just covered. The timing was so good that, for the first time, there was visual contact between the planes, a remarkable achievement!

The image below, which is a DMS mosaic from Eric Fraim shows one of the many leads we saw from the NASA P-3 today with a variety of different types of sea ice.

DMS mosaic of lead in the sea ice

DMS mosaic of lead in the sea ice (NASA/DMS/E. Fraim)

The rest of the day turned out very well indeed. The clouds that had worried the teams in the morning only formed only a thin band near the coast. The rest of the line out on the ocean was clear and beautifully lit by the oblique Arctic Sun. All the onboard scientific instruments on both planes worked well so that by the end of the day it was clear that the day had been a success.

By joining forces both the ESA and NASA teams collected a highly valuable dataset that will benefit the scientific achievements of ESA’s CryoSat and NASA’s future ICESat-2 mission to better monitor sea ice from space.

For more about ESA’s CryoSat mission and CryoVEx campaign, visit their Campaign Earth blog 


In the spirit of international collaboration: Honoring the Terra Nova Expedition

By Michael Studinger, IceBridge Project Scientist, NASA Goddard Space Flight Center/UMBC

Thule Air Base, Greenland – March 29, 2012 is a special day for polar researchers worldwide. It marks the centennial of Sir Robert Falcon Scott’s death on the Ross Ice Shelf. Many commemorative events have taken place around the world to remember the scientific accomplishments of the Terra Nova Expedition, particularly those of the Pole Party consisting of Robert Falcon Scott, Edward Wilson, Henry Bowers, Lawrence Oates and Edgar Evans. The most prominent event was a National Service of Commemoration for Captain Scott and the Pole Party at St. Paul’s Cathedral in London, with IceBridge’s own Seelye Martin attending as a guest of honor.

In 2008 I had the privilege to visit Captain Scott’s historic Terra Nova Hut on Cape Evans in Antarctica, and the geographic South Pole, where the National Science Foundation installed a sign bearing Scott’s famous quote said when the party realized the Norwegian expedition, led by Roald Amundsen, had been there first: “The pole. Yes, but under very different circumstances from those expected.” These are moments in my life that I will never forget. Walking through the Terra Nova Hut, which looked like it has been frozen in time, took my breath away.

Inside Captain Scott’s Terra Nova Hut on Cape Evans. The hut was built in 1911 by members of the British Antarctic Expedition (Terra Nova Expedition) and used as base for the trek to South Pole from which Scott and four of his team members never returned. The hut is remarkably well preserved but is undergoing restoration by the Antarctic Heritage Trust to protect it from further decay. The kitchen area on the left is one of the many areas inside and outside the hut that are being worked on. The hut is part of the 100 most endangered sites on the World Monuments Watch List. It is a remarkable place to be to say the least. Credit: Michael Studinger/NASA.

One hundred years later polar research has changed dramatically. On the day of the centennial, NASA’s Operation IceBridge and the European Space Agency’s CryoVEx campaign coordinated flights of two aircraft from different locations over the Arctic Ocean on a track flown shortly before by ESA’s CryoSat-2 spacecraft 600 km (370 miles) above us. We are able to do this because we have modern satellite images that are a few hours old and computer models showing the cloud cover in the survey area. We have modern means of communication that allow us to coordinate these science flights a few hours before takeoff. We know our position within a few feet and the NASA Airborne Science program flight tracker shows our position in real time. A lot has changed to say the least, but nevertheless operating in the remote polar regions remains a challenge even today. Modern navigation computers routinely get confused within a few miles of either the North or South Pole, the extreme cold still poses a challenge and weather predictions can be wrong. The safety and success of our operations is only possible because of extremely experienced and skilled members of the aircrew and instrument teams that excel in meeting the challenges of the polar environment every day.

Discovery Hut near McMurdo Station in Antarctica

McMurdo Station in Antarctica with the historic Discovery Hut in the foreground. The hut was built during Scott’s 1901-1903 expedition. The contrast between old and new is amazing. Observation Hill, the site of the Terra Nova memorial cross can be seen in the background on the right. Credit: Michael Studinger/NASA.

Today’s polar research is driven by a spirit of international collaboration and the joint NASA/ESA flight on March 29, 2012 is a fine example of what can be accomplished when many nations and organizations team up instead of competing with each other. Recognizing the enormous accomplishments of the early polar explorers, we dedicate this flight to the members of the Terra Nova Expedition, who died in Antarctica one hundred years ago.

NASA P-3 flight path

Flight path of the NASA P-3 Orion in yellow during the joint sea ice science mission with ESA’s CryoVEx airborne campaign stationed in Alert on Ellesmere Island and CryoSat-2.


Operation IceBridge surveys new areas in the Beaufort and Chukchi Seas north of Alaska

By Michael Studinger, IceBridge Project Scientist, NASA Goddard Space Flight Center/UMBC

Fairbanks, AK – The two most important sea ice flights every year are two crossings of the entire Arctic Basin, north of Greenland and Canada all the way to Alaska. This year we decided to make the flights to and from Fairbanks earlier than usual because of the weather. The forecast at Thule was predicting a major storm system for the next few days. Storm season in Thule lasts Sept. 15–May 15, and every year blizzards with wind speeds of over 100 miles per hour and white out conditions hit the base, locking us down for a few days.

There are several challenges involved with these two flights. First, the survey lines are 1600 miles long and it is very rare to have such a large area free of clouds and fog, particularly over the Arctic Ocean. Imagine flying from New York to Colorado at 1500 feet above the surface and having neither clouds nor fog the whole way. Getting good data from our optical sensors, such as laser altimeters and digital cameras, we need clear conditions between the aircraft and the ice surface.


IceBridgeflight from Thule, Greenland to Fairbanks, AK that surveyed sea ice along atransect over the entire Arctic Basin. Basemap is MODIS satellite image showingcloud cover and sea ice over the Arctic Ocean.

A second challenge comes from predicting the weather in such a remote area. We have infrared satellite images and computer models available, but these models cannot be validated because there are no weather stations in the Arctic Ocean. Also, neither the forecast models nor satellite images show the weather features that are most important to us: low clouds and ice fog that disrupt the laser and camera measurements.

The third challenge is that we have to relocate the aircraft, crew and scientists to Fairbanks on very short notice, since the frequent changes in weather allow us to make this decision only a few hours before takeoff.

The NASA P-3 aircraft is being prepared on a chilly morning for a sea ice mission over the Beaufort and Chukchi Seas from Fairbanks, Alaska. Photo: Michael Studinger/NASA.

TheNASA P-3 aircraft is being prepared on a chilly morning for a sea ice missionover the Beaufort and Chukchi Seas from Fairbanks, Alaska. Photo: MichaelStudinger/NASA.

In order to characterize the state of the Arctic ice pack we need to survey large regions and determine the thickness of the multiyear ice that remains from the previous summer and the growth of new first year ice during the winter. We have had several successful flights over the Beaufort and Chukchi Seas from Fairbanks that surveyed primarily the newly formed first year ice in this area. This is a new area for IceBridge and an important data set to monitor changes in the Arctic environment.

We are planning to stay here in Fairbanks for a few more days before we return to Thule Air Base in Greenland to continue our campaign and survey the sea ice north of Greenland.

The margin of a large lead of open water (dark) and thingrease ice (gray, right) in the Chukchi Sea between Alaska and Russia. Theimage was create using several frames from the Digital Mapping System (DMS)onboard the NASA P-3. Image: NASA/DMS/Eric Fraim.


Getting Ready for the 2012 Arctic Campaign

By Michael Studinger, IceBridge Project Scientist, NASA Goddard Space Flight Center/UMBC

Wallops Flight Facility, Wallops Island, VA – Welcome to the fourth annual Arctic campaign with NASA’s Operation IceBridge. Over 75 days, we will collect data with two aircraft over the Greenland Ice Sheet, the Arctic Ocean and the Canadian ice caps. We will be based in Kangerlussuaq and Thule Airbase in Greenland, and in Fairbanks, Alaska for sea ice flights over the Beaufort Sea.

During the past several weeks, Operation IceBridge teams have worked at NASA’s Wallops Flight Facility on the eastern shore of Virginia, installing cutting-edge laser altimeters and extremely sensitive radars that will allow us to measure changes in sea ice thickness in the Arctic Ocean. We will also be monitoring changes in the thickness of ice sheets and glaciers that cover most of the subcontinent of Greenland and the Canadian Arctic Archipelago. We will start our campaign with NASA’s P-3B Orion research aircraft from Wallops at Thule Airbase in northern Greenland with sea ice missions over the Arctic Ocean. The extent and thickness of the sea ice cover in the Arctic Ocean is declining quickly and we are there to take measurements that document this change from year to year. The second plane in this year’s Artic campaign, a Falcon HU-25 jet operated by NASA’s Langley Research Center in Hampton, Va., will join the campaign later in April carrying the Land, Vegetation, and Ice Sensor (LVIS), a high-altitude laser altimeter capable of measuring a 2-km-wide (1.2-mile-wide) swath.

The P-3B aircraft inside the hangar at NASA’s Wallops Flight Facility in Virginia.

The P-3B aircraft inside the hangar at NASA’s Wallops Flight Facility in Virginia. Credit: Michael Studinger.

Before we can start collecting data over the Artic we have to make sure that all installed sensors on the P-3 work and are calibrated. In order to make extremely precise laser altimeter measurements of the ice surface elevation we calibrate the instruments using target sites at the Wallops Flight Facility that we have surveyed on the ground. A second test flight takes us out over the Atlantic Ocean, some 200 miles away from the coast, where we can switch on the radar systems from the Center for Remote Sensing of Ice Sheets (CReSIS) at the University of Kansas, without interfering with other systems. We use the radar signal that is bouncing back from the ocean surface to calibrate the radars. We also did a couple of maneuvers at high-altitude over the Atlantic to calibrate the antennas of the ice-penetrating radar systems that we will use to survey the sea ice, glaciers and ice sheets.

Research flying has little in common with everyday air travel. One of the maneuvers that we do during the test flights is to fly the aircraft at a 90° roll angle with the wings perpendicular to the horizon. Fasten your seat belts! You will (hopefully) never experience something like this on a commercial flight.

The P-3B on the ramp before a test flight. The antennas of the ice-penetrating radar system can be seen mounted under the wings.

The P-3B on the ramp before a test flight. The antennas of the ice-penetrating radar system can be seen mounted under the wings. Credit: Michael Studinger.

We are collaborating with other experiments such as CryoVEx, the CryoSat-2 calibration and validation campaign from the European Space Agency. We will also work closely together with teams that work on the ground and take measurements over sea ice in the Arctic Ocean, and do coordinated flights with an ER-2 high-altitude aircraft from NASA’s Dryden Flight Research Center in Edwards, Calif. The ER-2, a civilian research version of the Air Force’s U-2 , will carry the Multiple Altimeter Beam Experimental Lidar (MABEL). The ER-2 will fly out of Keflavik, Iceland, and climb to 60,000 feet on its way to Greenland to measure the same tracks as the P-3B Orion.

We have now completed all our test flights here at Wallops and are ready to go to Greenland where we hope to map much of the sea ice cover over the Arctic Ocean and the Greenland Ice Sheet.

A Rare Trip To Recovery Glacier

By Christopher Shuman, Goddard Space Flight Center, University of Maryland Baltimore County/JCET

Hello. As we head away from East Antarctica over a pretty substantial cloud deck, I thought I’d take this opportunity to give you a sketch of our day (Oct. 29) on the DC-8.

After arriving at the airport about 7 am, we faced a tough weather situation with clouds across almost all targets. In the end, we decided to head out towards a feature called Recovery Glacier – really an ice stream – that has some unique characteristics that make it worth the long flight there and back and the fuel we need to burn. For background, Robin Bell at Lamont-Doherty Earth Observatory at Columbia University led a paper that got published in Nature (2007) where we documented that this fast flowing ice extends deep inside East Antarctica. It also widens as it goes inland. Only the Lambert Glacier and its adjoining Amery Ice Shelf can really compare to the extent of the Recovery Glacier with the Filchner Ice Shelf. Its scale alone makes understanding the Recovery Glacier important. Because of its isolation from research stations on the continent, it is also rarely measured either from an airborne platform or traverse.

The ice stream of Recovery Glacier distinguishes itself from slower-moving ice by its shredded, rough appearance. Credit: Christopher Shuman/NASA, UMBC/JCET

In the Nature paper, we documented that the Recovery widens its velocity field upstream most likely because of some unique characteristics at the ice-bedrock interface, including some probable lakes – trapped pockets of water or very wet sediment basins. Even some distinct geologic edifices penetrate up into the overlying ice. We showed that these features are located where the ice sheet distinctly changes in character. Here it flattens, accelerates and forms flow features visible at the ice sheet’s surface.

Only two ground traverses have reached the Recovery, the US-UK South Pole to Dronning Maud Land effort in 1965-1966 and the Norwegian-US International Polar Year program in 2007-2009. So today’s mission and one earlier this season have taken advantage of the DC-8’s long range to get a suite of geophysical sensors along and across it – to define its width, depth (using radar), elevation (using laser altimetry) and the area’s bedrock character including possible subglacial lakes (using gravity and radar). This mission focused on the lower reaches of the Recovery as it bends around the Shackleton Range, joins the smaller Slessor Ice Stream, and pushes off the bedrock to form the majority of the floating Filchner Ice Shelf. If you are trying to place it on the globe, today’s research target is almost due south of the Atlantic Ocean.

The US Antarctic Research Program took part in the first traverse across Recovery Glacier in 1965-66. Credit: US Antarctic Research Program

With better luck, we’d see some of the Antarctic Peninsula as we fly to and from our base of operations in Punta Arenas, Chile. We crossed over the Larsen C ice shelf on our way back and it was obvious that the peninsula is once again covered in clouds. The glaciers of the Antarctic Peninsula are much smaller than the Recovery but have been changing dramatically recently. Some glaciers there have lost hundreds of feet in elevation and retreated inland in the past decade due to the collapse of their fringing ice shelves. For example, the Crane Glacier now flows freely into the ocean since the Larsen B ice shelf collapsed in 2002. The significance of ongoing changes to Antarctica’s fringing ice shelves is something that has only recently begun to be fully documented by researchers.

Punta Arenas is currently hosting a US Antarctic Program (USAP) ship, the ARSV Laurence M. Gould, that is doing research in the oceans off of Antarctica, as well as supplying the USAP’s Palmer Station. Punta Arenas is also a logistics hub for a number of other nations who have stations in the Antarctic Peninsula including the British Antarctic Survey (BAS). Two of their Twin Otter support aircraft were at the airport today and are quite distinctive in their black and red paint schemes. Even better though, one of my all-time favorite planes was also there this morning: a modified DC-3 equipped with skis for snow runways. There is just something timeless about its design with its nose up and tail tipped down with big tires under the engines. It reminds you of past explorers in remote Antarctica and reminds you to appreciate all that can be accomplished with it and other great aircraft like the DC-8.

NASA’s DC-8 casts its shadow on a peak of the Shackleton Range during a flight to the remote Recovery Glacier region on Oct. 30, 2011. Credit: Michael Studinger/NASA