The Big Three

From: Kathryn Hansen, NASA’s Earth Science News Team/Cryosphere Outreach Specialist

KANGERLUSSUAQ — The evening before the second science flight, IceBridge scientists Michael Studinger and John Sonntag visited Kangerlussuaq’s weather office — a small building adjacent to the town’s grocery store. Weather can make or break a mission, as clouds interfere with instruments’ ability to map the ice.

This time there was another factor to contend with. Ash from Iceland’s Eyjafjallajokull volcano had made its way over the southeast side of Greenland. Comparing the proposed flight path with the position of ash, IceBridge crew decided the flight was a “go.”

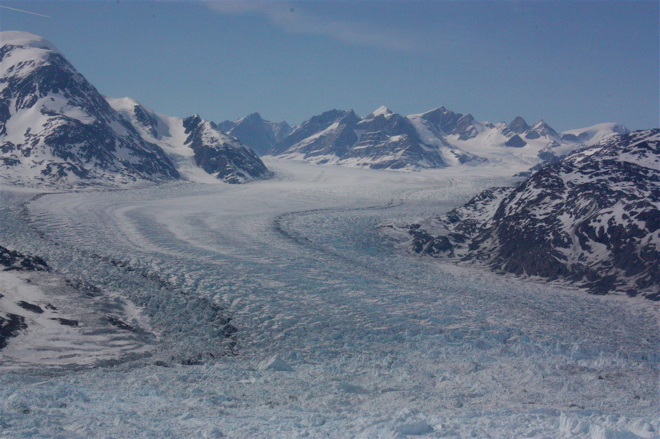
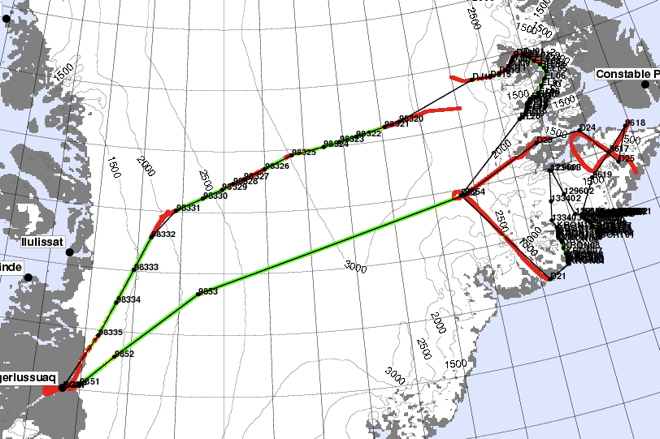
Mission managers selected the Helheim-Kangerd flight plan, which called for mapping two of three glaciers deemed “the big three.” (The third is Jacobshavn, to be surveyed in a separate mission).

Helheim and Kangerdlugssuaq glaciers are quickly accelerating, speeding up ice loss to the ocean. Steep beds and the influence of saltwater working its way under the glaciers are thought to be playing a role. Annual data collected during IceBridge will help scientists maintain a record of the ice loss and learn more about the factors driving the change.

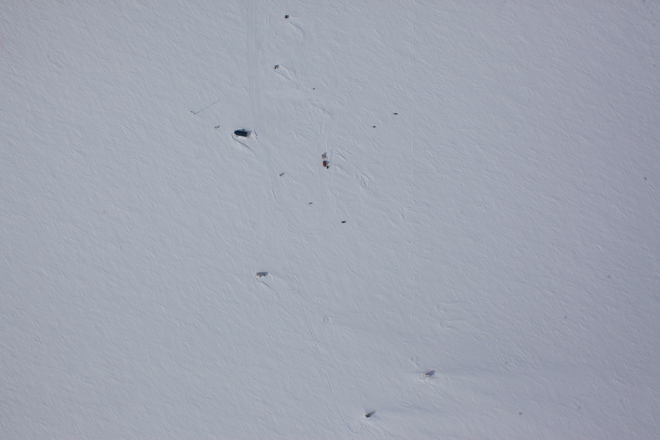
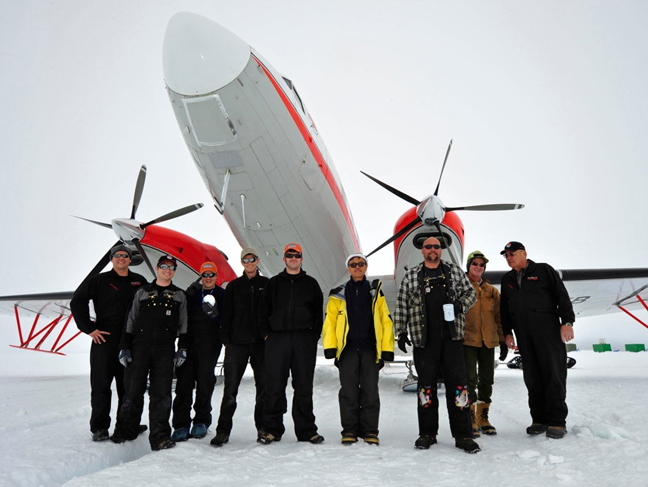
After mapping Kangerdlugssuaq, the P-3 passed over a ground team on an expedition collecting ice cores. The overflight was intentional — multiple sources of data over a single location can prove useful for calibrating data and for research. Similarly, IceBridge flights frequently reexamine tracks previously observed by the ICESat satellite. The ice coring crew was caught on camera (below) by the Digital Mapping System — a digital camera mounted in the underbelly of the P-3.

Isolation

From: Kathryn Hansen, NASA’s Earth Science News Team/Cryosphere Outreach Specialist

KANGERLUSSUAQ — There was a rumor that the flight on Friday, May 10, would be among the most scenic of the 2010 Arctic campaign. The high-priority flight along Greenland’s southeast coast required clear weather for pilots to maneuver along the sinuous glaciers at low altitudes. We were fortunate. The first opportunity to fly from Kangerlussuaq with the P-3 on this Arctic 2010 campaign turned up clear skies and relatively balmy temperatures, and we lifted off for Geikie Plateau shortly after 8 a.m.

Why Geikie? The plateau is “dynamically isolated” from the rest of the ice sheet. That means what happens to the main ice sheet is not necessarily also happening to Geikie. So, IceBridge scientists want to collect Geikie’s vitals — ice thickness, surface elevation, bedrock profile — and compare them with the rest of the ice sheet. “They’re potentially doing very different things, which can tell you something about climate’s impact on the region,” said John Sonntag, Senior Scientist with the ATM laser instrument and IceBridge management team member.

The survey of Geikie Plateau called for about eight hours of total flight time. Credit: NASA/John Sonntag

Observing from one of the P-3’s few windows, I was struck by the scale of the landscape. As we closed in on the southeast coast, the flat barren ice sheet soon mingled with occasional hills and then steep mountains with sharp peaks. Ice appeared to be making its escape, flowing down valleys and merging with the glacial superhighway. Some glaciers terminated in cliffs half a mile high. For others, all that remained were the brown, silty remnants.

Ice works its way down between mountains before joining a larger glacier. Credit: NASA

At the same time that I was making my visual inspection, however, IceBridge instruments were collecting a more scientific type of information. Lasers mapped the surface while radars dove down for a look below. Will scientists find that Geikie indeed acts in isolation? They’ll have a better idea after deciphering and analyzing the data. In the meantime, the IceBridge team is plotting to visit a few other isolated ice sheets throughout the mission — if time and weather permit.

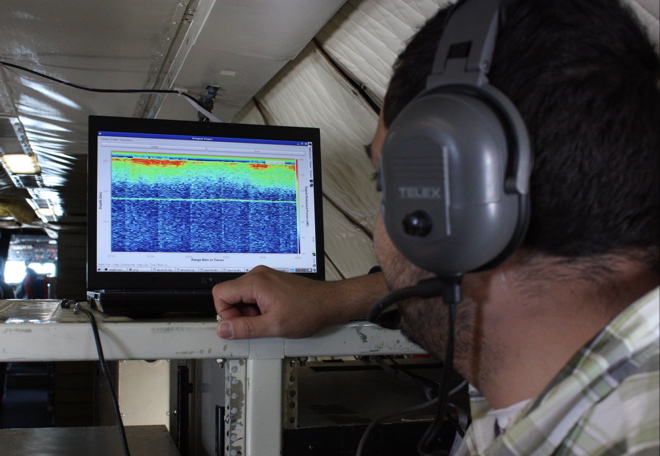
The Multichannel Coherent Radar Depth Sounder instrument shows ice characteristics at depth and also the shape of the bedrock below (thin green line). Credit: NASA

Fasten Your Seat Belts: Mid-Mission Test Flights Complete


From: Michael Studinger, IceBridge project scientist, Goddard Earth Science and Technology Center at the University of Maryland

NASA Wallops Flight Facility, Virginia — During the past week, Operation IceBridge teams have worked at NASA’s Wallops Flight Facility on the eastern shore of Virginia, transferring the science instruments from the DC-8 onto a NASA P-3 Orion aircraft that we will use for the second half of our Greenland campaign. NASA’s fleet of research aircraft allows us to choose the aircraft that is best suited for the science goals that we want to accomplish with IceBridge. We began our work in Greenland with the DC-8 because of its range, load carrying capability, and its ability to fly very high. With the DC-8 we have surveyed the sea ice in the Arctic Ocean and numerous glaciers in northern Greenland. For the second half of the Greenland campaign we will focus on mapping glaciers in southern Greenland using the NASA P-3. The aircraft’s range and maneuverability are ideally suited for low-altitude glacier flying.

The inside of NASA’s P-3 Orion aircraft during installation of Operation IceBridge science instruments at NASA’s Wallops Flight Facility. Credit: Michael Studinger

During the past three months, IceBridge teams from the Center for Remote Sensing of Ice Sheets (CReSIS) at the University of Kansas and Wallops have worked hard to make the impossible possible: designing and manufacturing a complex array of 16 ice-penetrating radar antennas mounted under the wings and the belly of the P-3 and installing and test flying it in only three months! The array of radar antennas is a new development that has never been flown before, allowing us to map heavily crevassed outlet glaciers in unprecedented detail. We will collect several Terabytes of data during each flight that will be processed on a supercomputer at CReSIS when we are back home. The complex array of antennas will allow IceBridge teams to distinguish between radar clutter from surface crevasses and the very weak echo reflected from the base of the glacier of interest. 

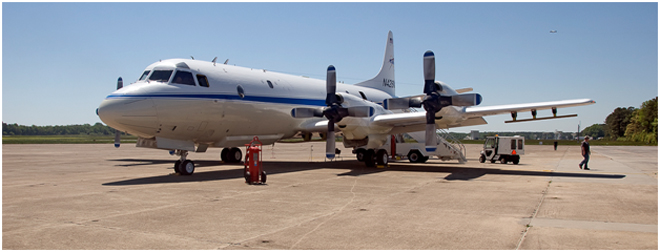
NASA’s P-3 research aircraft waits on the ramp at Wallops shortly before taking off for a test flight. The antennas for the ice-penetrating radar system are mounted under the wings. Credit: Michael Studinger

We have now completed a series of mandatory test flights at Wallops to verify the antenna installation and aircraft performance during flight and to check out our science equipment before we leave for Greenland. Research flying has not much in common with everyday air travel. One of the maneuvers that we do during the test flights is to fly the aircraft at a 90° roll angle with the wings perpendicular to the horizon. Fasten your seat belts! You will never experience something like this on a commercial flight. If you do, you might want to consider using a different airline next time.

NASA’s P-3 aircraft during a test flight over Wallops Island, Va. The ice-penetrating radar antennas for Operation IceBridge are mounted under the wings and the belly of the aircraft. Images are courtesy of Rick Hale, CReSIS.

One of the major science goals of Operation IceBridge is to understand the contributions of the Greenland and Antarctic ice sheets to global sea-level rise. During one of the test flights we use the Airborne Topographic Mapper laser system and high resolution aerial photography to map beach erosion on Wallops Island, the location of NASA’s rocket launch facility. Here, at the coast of Wallops Island, rising sea-levels and increased beach erosion are real and need to be considered in long-term planning for the launch facility.

We have now completed all our test flights here at Wallops and are ready to go back to Greenland where we hope to map many of the outlet glaciers and contribute to our understanding and knowledge of future sea-level rise.

Zachariae and 79 North

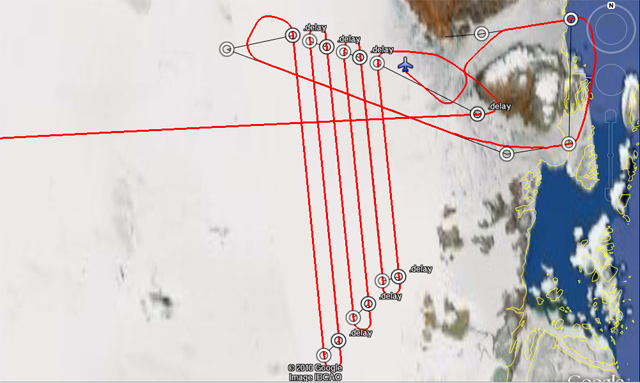
The IceBridge flight on Tuesday, March 30, marked the first of a four-flight series to measure the Zachariae and 79 North glaciers in northeast Greenland. The flight made six parallel passes up and down the uppermost, inland portion of the glaciers. The beds of these glaciers are below sea level, which has implications for how the glaciers interact with ocean water and how they lose ice. The planned part of the survey concluded early, so the crew decided on-the-fly to add two extra flight lines — one pass down the middle of each glacier. Jim Yungel, of NASA’s Wallops Flight Facility, captured a series of photos throughout the low-altitude flight:

The actual flight path, including two extra flight lines down the middle of the glaciers. 

Thule plow and sweeper clear the ramp and taxiway before the flight. Credit: Jim Yungel/NASA’s Wallops Flight Facility

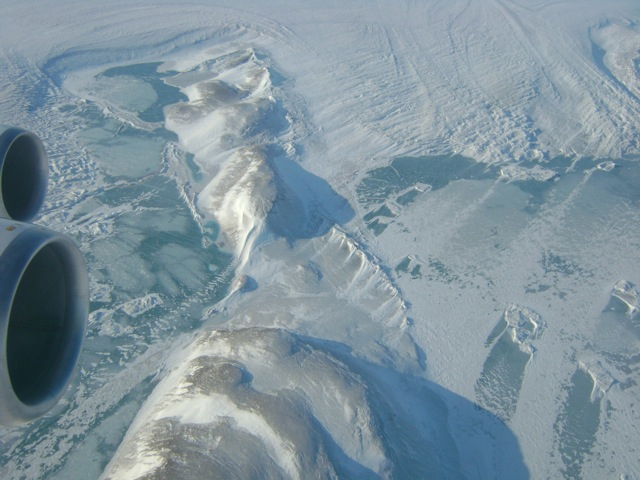
Nunataks — hills or mountains encircled by a glacier — are seen among the ice. Credit: Jim Yungel/NASA’s Wallops Flight Facility

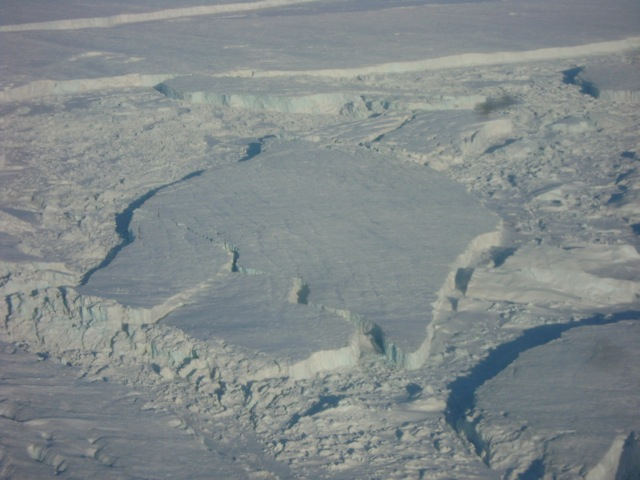
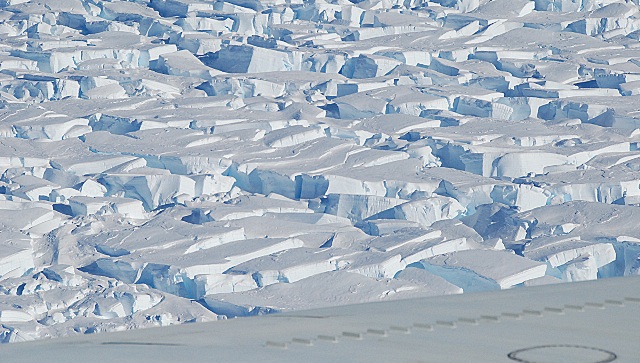
Glacial blocks are seen near Zachariae Glacier. Credit: Jim Yungel/NASA’s Wallops Flight Facility

A close up view shows details within glacial blocks seen near Zachariae Glacier. Credit: Jim Yungel/NASA’s Wallops Flight Facility

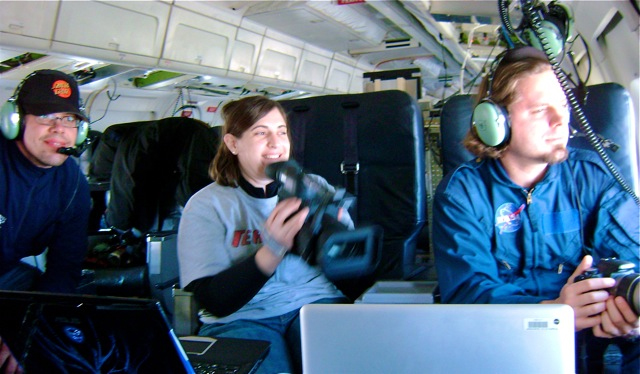
The science team and a NASA video producer watch the glacier. Credit: Jim Yungel/NASA’s Wallops Flight Facility

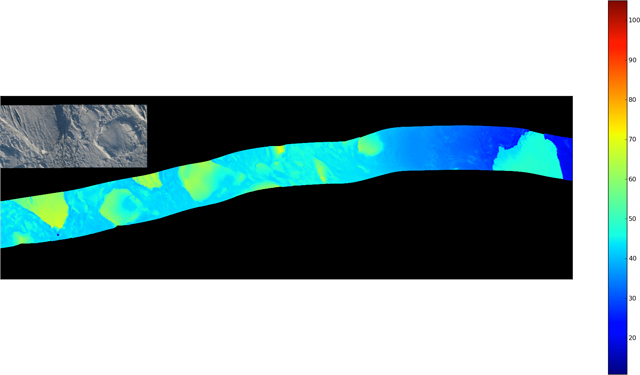
Preliminary data from the Airborne Topographic Mapper (ATM) show the topography around the Zachariae Glacier calving front region. The image contains preliminary data and is not for scientific analysis. Credit: Rob Russell/ATM team

Welcome to the Start of the Operation IceBridge 2010 Campaign


From: Lora Koenig, IceBridge project scientist, NASA’s Goddard Space Flight Center
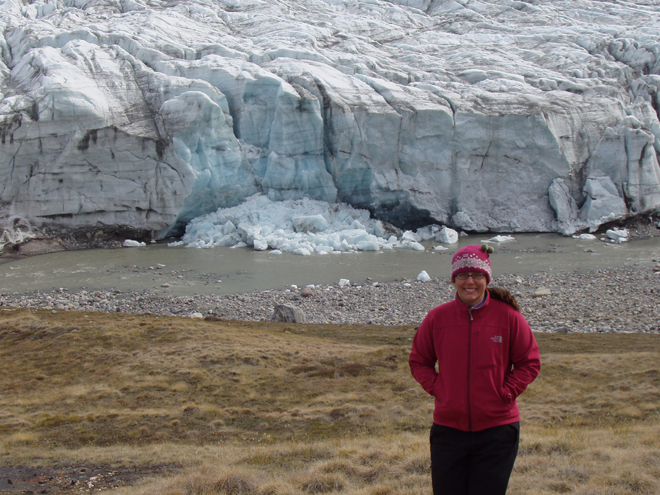


Credit: Image is courtesy of Lora Koenig, NASA’s Goddard Space flight Center

Hello, and welcome to the start of the Operation IceBridge Greenland 2010 campaign. Over the next few months we will be blogging about the science, research, aircraft, and day to day activities of our airborne campaign. The NASA DC-8 aircraft is fully loaded in Palmdale, Calif., and will take off late Sunday night to fly scientists, crew and instruments to Thule, Greenland. The DC-8 will stay in Greenland until the end of April at which time the NASA P-3B aircraft will take over for another month of flights monitoring the changes occurring over the Greenland ice sheet and the Arctic sea ice. Hopefully some of you are returning to the blog after our previous Greenland 2009 and Antarctic 2009 campaigns. Please check in often to follow our progress and learn more about our exciting Arctic research.

My name is Lora Koenig and I am a physical scientist in the Cryospheric Sciences Branch at NASA’s Goddard Space Flight center. You may be asking, what is cryospheric science? Well, it is the branch of science that studies the areas of frozen water on Earth. This includes science related to snow, sea ice, ice sheets, glaciers and permafrost. My research is focused on monitoring changes over the Greenland and Antarctic Ice Sheets and for the last five months I have been one of the NASA project scientists in charge of IceBridge. In this blog I will tell you a little about the planning that has gone on behind the scenes for this campaign.

For the last five months, starting while most of the IceBridge team was still in Antarctica, NASA started planning for the Greenland 2010 Campaign. Because the austral (Southern Hemisphere) spring and boreal (Northern Hemisphere) spring are only six months apart the IceBridge team is constantly planning for the next field campaign. Yes, the Antarctic 2010 campaign planning has already started and the DC-8 has yet to take off for Greenland.

What does planning for a major NASA airborne mission entail? Two things: logistics and flight line planning. A team at NASA’s Earth Science Project Office (ESPO) and the aircraft crews have been busily working to ensure that the instruments are ready to be loaded on the plane, flight clearances are in place, hangers are ready and sufficient for the planes to use, hotel reservations are made, airports are open, divert airports are nearby in case of bad weather, cargo is shipped, the science and instruments teams have flight reservations and passports, cold weather gear is assembled, food is available, internet is set up, and the list goes on and on. These behind the scenes logistics and preparation make for a successful field campaign.

While ESPO was dealing with the logistics, the IceBridge science team and I were tasked with planning flight lines. The Greenland ice sheet and the Arctic Ocean are large areas to monitor. Our aircraft cannot fly everywhere so the science community works together to decide where to fly, when to fly, and how often to fly. Flight decisions are made though a consensus process conducted by teleconferences and meetings with groups of scientists who specialize in studying sea ice, the Greenland ice sheet and ice sheet modeling. Most of the scientists are trying to answer one of the following questions: How are changes in the Greenland ice sheet affecting sea level rise? What changes are occurring to the Arctic sea ice extent and thickness? And in the future, what changes should we be preparing for as the Greenland ice sheet and Arctic sea ice cover change?

Each community of scientists requests specific areas where they want data, and each community desires a specific instrument to take their measurements. In many cases there is overlap in flight lines and instruments and in some cases there is not. Throughout this campaign you will hear about specific flights and the scientific reasons they were flown. Some flights will focus on sea ice, others will overfly glaciers that are changing rapidly and some will overfly scientist working on the ground so results can be extrapolated over a larger area. The IceBridge flight plans are designed to meet the needs of many within a limited amount of time. Flight line planning started in January and was just completed last week. John Sonntag, who you are sure to meet later in the campaign, is the master flight line designer and keeps the aircraft on track for making important scientific discoveries.

Well, I hope this gives you a bit of a flavor for the work that has been occurring by computer, phone and desk to get the Greenland 2010 Campaign up and flying. Next stop Thule, Greenland, with a transit flight that — weather dependant — was designed to monitor a small portion of the southeast Alaskan glaciers and the Arctic sea ice on a transect across the Arctic Ocean.
Operation IceBridge Off to a Successful Start in Greenland

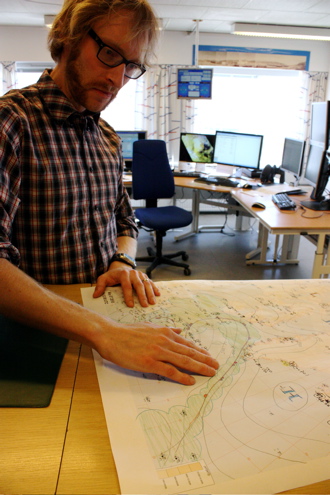
From: Michael Studinger, IceBridge project scientist, Goddard Earth Science and Technology Center at the University of Maryland

Hello and a warm welcome to all blog readers from the IceBridge team here at Thule Air Base in northern Greenland. After taking off on Sunday night from NASA Dryden’s Aircraft Operations Facility in Palmdale, Calif., the NASA DC-8 arrived at Thule Airbase on Monday afternoon. Both the aircraft and science teams have done an incredible job in setting up operations in record time here in Thule. 


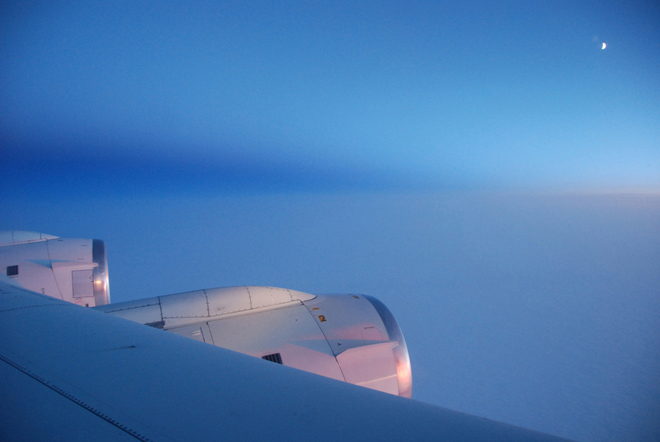
The moon and sunrise are visible over the Arctic Ocean during the flight from Palmdale, Calif., to Thule, Greenland. Credit: Michael Studinger

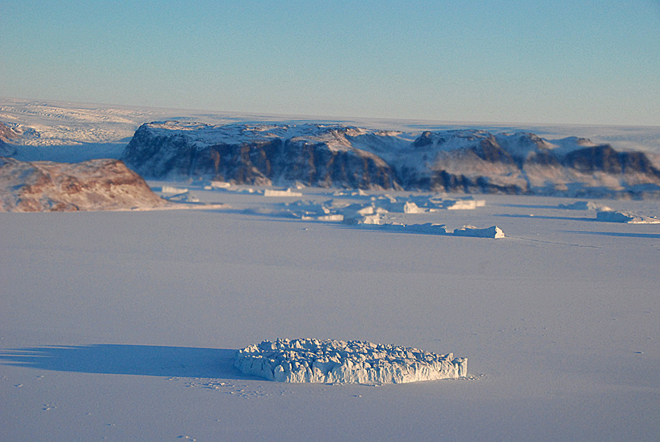
We were able to take off for an eight-hour science flight on Tuesday morning to survey the sea ice in the Arctic Ocean north of Ellesmere Island. Wednesday’s science flight was targeted at several glaciers north of Thule. Some of the glaciers have been surveyed for the first time last year and we are back this year to monitor the changes that have occurred since last spring. We begin the day with flying over a small glacier called Heilprin Glacier. We are very early in the season and the sun is just above the horizon in the morning hours, illuminating the coast of Greenland with its frozen fjords, icebergs and glaciers in a beautiful light. 


The sun is very low and only barely above the horizon at the beginning of the third science flight, creating beautiful illumination of the cost of Greenland with its frozen fjords, icebergs and glaciers. Credit: Michael Studinger

After an hour of flying we begin to fly a grid pattern in the catchment area of Petermann Glacier to measure the thickness of the ice with a radar system from the University of Kansas. These data will be used as input for computer models that will allow us to better predict how the Greenland ice sheet will respond to environmental changes in the Arctic.

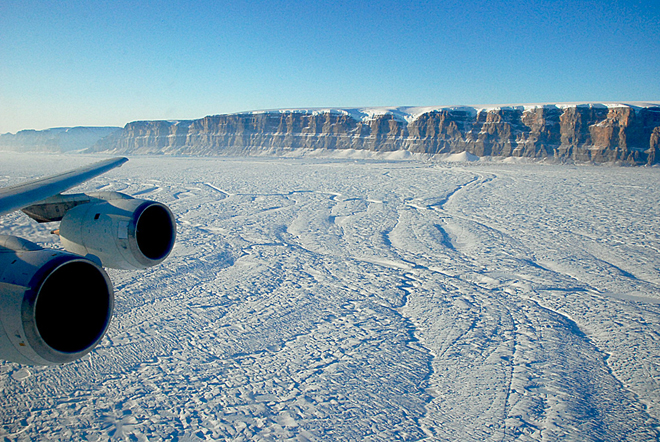
We continue our flight by repeating two survey lines along Petermann Glacier that have been surveyed several years before. The scenery with the steep sidewalls is spectacular. We can see huge meltwater channels on the surface that will be filled with water running down the glacier when the Arctic melt season starts in a few months. 


The IceBridge crew fly down Petermann Glacier in northern Greenland with NASA’s DC-8 aircraft. Credit: Michael Studinger

After completing the flight lines over the Petermann Glacier we turn back towards Thule Air Base and measure the ice surface elevation with a laser altimeter along a track that has been measured many times by NASA’s ICESat satellite. We are heading back to Thule Airbase to land before the tower and airfield close for the day. 


At the end of a day of glacier flying, Dundas Mountain — a major Greenland landmark — can be seen during the approach to Thule Air Base. Credit: Michael Studinger

We have had an incredibly successful start of the 2010 Arctic campaign. We have been able to collect LVIS laser data along the transit from California to Greenland and have been flying 3 days in a row collecting huge amounts of data. A storm system here in Thule has forced us today to stay on the ground and everyone is catching up with sleep and data processing. With a little bit of luck we hope to fly the DC-8 again on Friday. Thanks to all the aircraft and science teams, the staff at Thule Air Base, and many people back home who have made such an incredible start of the IceBridge 2010 campaign possible!


Mowing the Lawn at Pine Island Glacier


From: Jill Hummels, Public Information Officer, University of Kansas School of Engineering


PUNTA ARENAS, Chile, Oct. 20 — Today’s high-altitude flight took NASA’s Operation Ice Bridge researchers over Antarctica’s Pine Island region (75° 25’ S and 98° 25’ W and surrounding area).


“We’re really pumped. We’re getting some really good data,” says Chris Allen from the University of Kansas about midway through the 11-hour flight. The electrical engineering professor and four graduate students are operating three different radars developed at the university through the National Science Foundation Center for Remote Sensing of Ice Sheets.


Chris Allen at the controls of the MCoRDS radar, over Antarctica. (Jill Hummels/University of Kansas)


“A while back, we were over the ice shelf, and it was very distinct.” Now, as the plane progresses over the land formation, the vibrant multicolored display offers less clear information. But the raw data is still being captured. “That’s where the signal processing comes in,” Allen says.


The display offers a cactus-like spectrum of color, with spikes protruding from separate layers of color. The uninitiated eye can clearly see a “surface” in the image. That would be the top of the ice layer, Allen explains. The more trained eye knows that where the yellow, aqua and blue colors intermingle is where the real action lies. More sophisticated methods will be needed to coax meaning from the raw data.


Already the Kansas team is eliciting “oohs” and “ahhs” from other science team members through data they’ve collected with the MCoRDS radar in the mission’s two previous flights.  In a recent evening briefing at the hotel in Punta Arenas, an image being displayed for all to see appeared to show that in one inland area of Antarctica the ice sheet is several kilometers thick and is nestled in a channel of bedrock that appears to be well below sea level.


Five hours after today’s flight started, the plane has gone through several passes over the glacier and still has many more to go. The proscribed flight path — called “mowing the lawn” — includes 11 parallel lines and a couple perpendicular ones. Each parallel path is about five miles apart. However, the flight crew skips the adjacent path in order to comfortably make the wide turn to the next run. A couple “teardrop turns,” wider turns that loop back nearly 360 degrees to a narrower path, have been thrown in for good measure to ensure the science and engineering teams are on the exact positions they need.  It also helps break the monotony of flying over endless tracks of white.


Even after the flight crew has maneuvered the DC-8 through its perpendicular labyrinth and is making the long stretch home across the Antarctic Ocean, the Kansas team will still be hard at work crunching numbers and distilling hard truths from the icebergs of raw data.  With significant computing power aboard the plane, the team has made it a goal to try to deliver detailed information about ice sheet thickness and more by the time the plane lands in Punta Arenas.


The DC-8’s flight plan (dark lines) and actual flight paths (red lines) mid-way through the “mowing” of Pine Island Glacier. (Pine Island Bay is on the left side of this image.)


Up and Down Thwaites Glacier


From: Kathryn Hansen, Science Writer, NASA Goddard Space Flight Center


NASA’s DC-8 returning from its second Antarctic flight of the mission.  (NASA/Steve Cole)


On Sunday, Oct. 18, researchers and crew flew on the DC-8 aircraft’s second Antarctic flight of the Operation Ice Bridge Campaign. The mission was dedicated to reflying areas of Thwaites Glacier previously mapped by the ICESat satellite to see how the glacier has changed.


The team took advantage of the good weather, flying at low altitude, spending about three hours surveying the glacier with the Airborne Topographic Mapper (ATM), the campaign’s primary instrument. ATM pulses laser light in circular scans on the ground, which reflects the pulses back to the aircraft. The laser data are then converted into elevation maps of the ice surface.


Another instrument, the Multichannel Coherent Radar Depth Sounder (MCoRDS), collected thickness measurements over the glacier. The instrument team’s initial analysis of the data turned up unexpected depth.


ICECAP Investigates East Antarctica


From: Kathryn Hansen, Science Writer, NASA’s Earth Science News Team

Operation Ice Bridge scientists and crew completed 21 successful flights over West Antarctica and returned home in time for Thanksgiving. Still flights over the icy continent continue. Scientists with another field campaign — Investigating the Cryospheric Evolution of the Central Antarctic Plate, or simply ICECAP — are making ongoing airborne investigations over East Antarctica.


The ICECAP Casey/DDU survey team at Casey from left to right: Dean Emberley (KBA), Jamin Greenbaum (Texas), Jorge Alvarez (Texas), Andrew Wright (Edinburgh), Duncan Young (Texas), Young Gim (JPL), Dave Meyer (KBA), Noel Paten (AAD), Ray Cameron (KBA); not pictured Glenn Hyland (AAD). Credit: Todor Iolovski (Bureau of Meteorology)


ICECAP, for which NASA’s Ice Bridge is funding some of the flights, is an international collaboration with principal investigators from University of Texas at Austin’s Jackson School of Geosciences, the University of Edinburgh, and the Australian Antarctic Division. The goal is to use airborne instruments to chart ice-buried lowlands, which could show how Earth’s climate changed in the past and how future climate change will affect global sea level.

Where have they flown and what have they observed? ICECAP’s University of Texas researcher Duncan Young provided some updates from the field:

Dec. 8, 2009

Right now we are preparing to begin our shift from McMurdo to Australia’s Casey Station via the joint French-Italian base on top of the ice sheet, Concordia, after completing our ICECAP flights out of McMurdo today with Flight 16, right down the maw of Byrd Glacier. Tomorrow we will use our survey plane to move people and cargo to Concordia, surveying all the way, and then return to McMurdo. On Wednesday we will move the rest of our people using our aircraft all the way to Casey from McMurdo. It is a complex multinational ballet, where the timing of weather at locations over 1,250 miles (2,012 kilometers) apart is critical. Then we will begin our ICECAP/Ice Bridge operations out of Casey Station with our Australian colleagues.

Dec. 22, 2009

Using an upgraded DC-3, we have completed five flights, each about seven hours long out of Casey Station, in addition to the 20 flights we completed out of McMurdo Station. Three of these Casey based flights have flown over 2,330 miles (3,750 kilometers) of ICESat tracks, over the rapidly lowering Totten and Denman Glaciers.


Denman Glacier; Credit: Jamin Greenbaum, University of Texas at Austin


T
oday we are conducting an ambitious 10-hour flight to finish off our Casey work for this season. We will be flying to Concordia Station in the center of the ice sheet, picking up fuel and base GPS data we have been gathering over the past ten days to help improve our aircraft positions, and thus the surface elevations we have been measuring.

Then we will fly along a ‘tie-line’ to connect several transects we flew last season to the Dome C ice core. By tracking ice layers in the radar data, we have a chance to find where some of the oldest ice in Antarctica might lie, perhaps more than a million years old. This old ice would contain greenhouse gasses from the past, leading to a better understanding of climate change if it is drilled. The aircraft will then return to Casey station along our last targeted ICESat line along Totten Glacier.

After this flight, we plan to move to Dumount d’Urville Station in time for a French Christmas dinner — if the katabatic winds there allow it …


Flying Low Over Pine Island Glacier


From: Michael Studinger, Lamont-Doherty Earth Observatory, co-principal investigator, gravimeter team


PUNTA ARENAS, Chile – After flying for several hours over a windswept Southern Ocean on Tuesday, Oct. 27, the mission director announces that we will be slowly descending towards Antarctica’s Pine Island Glacier. Just below are the Hudson Mountains, a small group of extinct volcanoes poking through the ice.


As we approach our survey area, John Sonntag with NASA’s Wallops Flight Facility and I watch the navigation display and admire the pilots’ precision as they steer the giant NASA DC-8 aircraft to the start of our first survey line.


We are here to measure the glacier’s ice surface with lasers, its bottom with radar, and estimate the depth of the water below it with an instrument that measures the gravity pull from above the glacier.


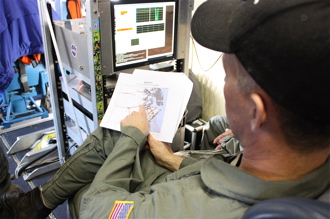
All systems are functioning well and we are excited about the data coming in. The computer screen mounted on the University of Kansas’ radar rack is a popular in-flight gathering spot since it provides a real-time view of the radar data that allows us to “see” the bottom of the glacier while we fly over it.


The structures we see are quite amazing and we toss around ideas about what this tells us about how the glacier is responding to warming temperatures. Science can be so much fun! After criss-crossing Pine Island Glacier several times, it’s time to head home to Punta Arenas.


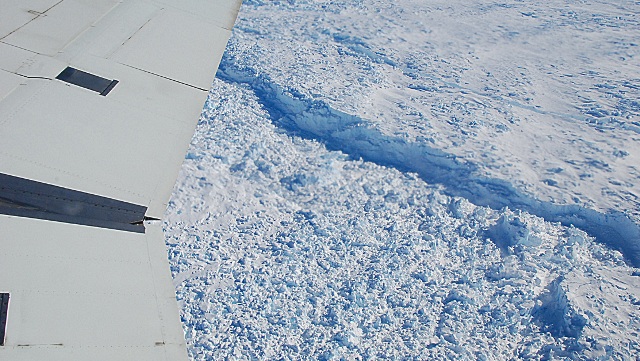
A heavily crevassed area of Pine Island Glacier. Shows you how very difficult it would be to travel and work on the surface of this glacier. Data are best collected from aircraft flying over the glacier or from space.


The calving front of Pine Island Glacier. This is the end of the glacier where pieces of ice break apart from the floating glacier and become icebergs.


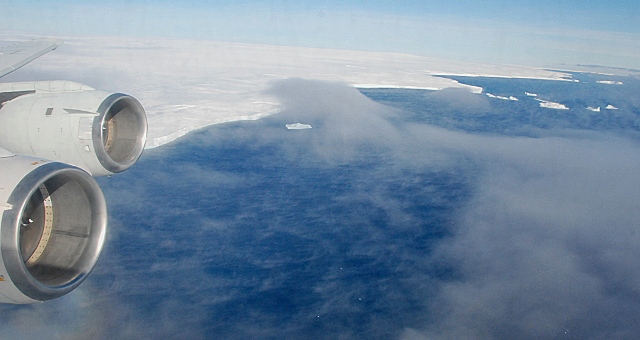
Flying at low elevation over the edge of the floating part of Pine Island Glacier. Winds have blown away the sea ice resulting in an area with open water called a polynya. The goal of this flight is to estimate the thickness of the water layer beneath the floating ice shelf from gravity data.


The Hudson Mountains near the edge of Pine Island Glacier are a small group of extinct volcanoes that poke through the ice and make for spectacular scenery.