From: Sinéad Farrell, sea ice team member, Earth System Science Interdisciplinary Center at the University of Maryland
The penultimate sea ice flight to be conducted during phase one of the Arctic 2010 IceBridge campaign was exciting. After days of bad weather and confinement to quarters at Thule Air Base, the flight team was finally able to accomplish the remaining sea ice flights. With only three days left in the campaign, and three sea ice surveys to complete, the pressure was on!
Favorable weather conditions on April 20, 2010, meant that the “Sea Ice 07” flight plan could be attempted. For the ad-hoc sea ice team back home, anticipation was mounting. Several days earlier, on April 8, the European Space Agency (ESA) launched the CryoSat-2 satellite to monitor changes in the thickness of polar ice. By April 11, CryoSat-2’s main sensor — the Synthetic Aperture Interferometric Radar Altimeter (SIRAL) — was turned on and meant that an underflight of CryoSat-2 by the DC-8 and its onboard sensors was possible.
To mitigate against the impact of the drifting sea ice pack, detailed planning and coordination was required to ensure the IceBridge sea ice flight was timed to be coincident with the satellite overpass near-by the North Pole. International collaboration between IceBridge team members at NASA, ESA and NOAA, as well as at a number of academic institutions, ensured the flight was both spatially and temporally coincident with CryoSat-2’s transit across the Arctic Ocean (see map below).
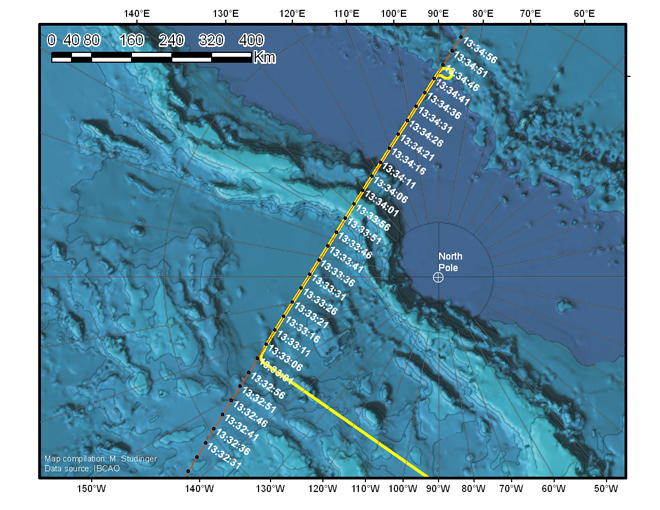
A map of the “Sea Ice 07” flight path, flown on April 20, illustrates the coincident DC-8 flight trajectory (yellow) and the CryoSat-2 orbit (orange) with the times of the satellite over-pass indicated (white). Image is courtesy of Michael Studinger.
Although clouds were encountered en-route to the North Pole, the DC-8 began surveying the CryoSat-2 ground-track just 14 minutes after the satellite passed overhead, in cloud-free conditions. A suite of instruments on the DC-8 including the Land, Vegetation and Ice Sensor (LVIS) and the Airborne Topographic Mapper (ATM) surveyed sea ice elevation along a 465-mile (750-kilometer) CryoSat-2 track at two altitudes: 25,000 feet (LVIS) and 1,500 feet (ATM).
LVIS’s wide swath was particularly suited to capturing the footprint of the satellite’s main sensor. Optical mapping systems, a snow radar, and a gravimeter onboard the DC-8 provided further science data. When analyzed in concert these data provide a valuable baseline for evaluating CryoSat-2’s capabilities for measuring Arctic sea ice thickness.
The flight demonstrated successful collaboration between federal agencies in the United States as well as international cooperation with ESA. Not only did the IceBridge mission carry out the first attempt by aircraft to validate the state-of-the-art radar altimeter onboard CryoSat-2, it contributed to a number of other firsts. The flight marked the most northerly IceBridge survey thus far, utilizing airborne laser and radar altimetry to survey sea ice at a latitude of 88oN. The flight also provided the first opportunity to compare the airborne ATM and LVIS instruments, which use lasers to gather complimentary surface elevation data over sea ice, with a new snow radar system. The sea ice science community looks forward to analyzing the wealth of data gathered during this flight.
A long ways from Tara! Great job. Many thanks for posting.
This thickness Data is EAGERLY awaited. EAGERLY.
… the recent high Ice Extent — and it’s sudden decline —
have driven fears the unexpectedly strong 1.8 El Nino — 2007’s was only 1.1 — will melt off the whole Arctic Ice in 1 gulp — triggering AT LEAST Drought West of the Mississippi (the Ewing-Donner and pre-5000 BP weather Pattern, recently confirmed as due to an Open Polar Sea by studies of Beach formation on Greenland’s North Shore)
Drought is — at best — at worst, Ocean Current Stoppage & 300 mph winds. 6 Billion Dead.
… 2007’s El Nino cut Ice Volume by 4000 cubic km below 2006’s minimum: as Last Years’ was 5800, IF it was the El Nino, then The Arctic Ocean will lose 1.8/1.1 x 4000 = 6545
An unexpected SUPER-El Nino AT the end of the 60-year PDO ( = low Ice, as in 1950 ), without Volcanic Sulphur, not in a Little Ice Age, etc. is about a 2000:1 Shot.
Is the thickmness Up or Down ? How Much ?
Even More important: CLOUDS … there are 3 Major theories as to why 2007 melted Soo much:
1. El Ninos make it Warmer (December 2009 broke the record for warmest anomaly for any month over the Arctic Ocean (Lower Tropospheric, by satellite) so expect the worst).
http://www.cpc.noaa.gov/products/analysis_monitoring/ensostuff/ensoyears.shtml
2. Winds push the Ice both out of the Basin & to 1 side of it (if so, this year, again, should be Worse than 2007)
3. Clouds were down 16% in 2007 & the increased SUN did MOST of the Melting according to a paper by Graeme Stephens at Colorado University (http://www.arm.gov/science/highlights/pdf/Roo143.pdf)
As this El Nino is a Western or El Nino “Modoki”, 2010 is NOT reversing to the opposite type or “La Nina” as did 2007 but only slowly decreasing. Ie. it is a 1.2 still, in the same month (a 3 month average of Feb-Mar-April, actually) that 2007’s was only at 0.1 & about to reverse.
Thus Cloudiness might well be UP this Melting Season, IF the quick reversal in 2007 caused it.
>> I would REALLY love Cloudiness to be up.
And the Cryosat-2 THICKNESS data, as well as your own, could either
STOP A PANIC
… or get the Government to ACT (something as simple as routing (?military?) Planes over the Polar Sea to add Contrails which cool the Continetal USA a couple degrees — could actually be done IN TIME, if needed.
But I see no figures.
Perhaps I’m not looking in the right Place ?
The Ice Area & Ice Extent are now a near DAILY debate on Global Warming Sites (e.g. wattsupwiththat.com). Thickness is charted only by the Polar Science Center’s PIOMAS model — do they use YOUR data ?
…Hoping for some reassuring News, or at any rate SOME news (about either Thickness And/Or Clouds):
— Charles Wilson