Notes from The Shack


From: Colleen McIntosh, data analyst/programmer, Sigma Space/NASA’s Goddard Space Flight Center


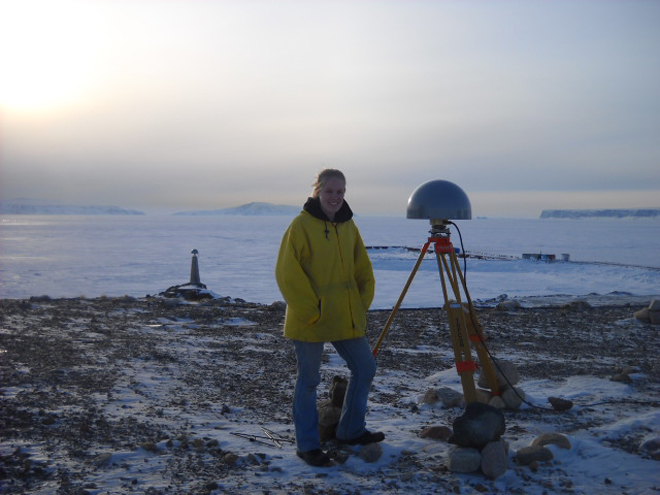
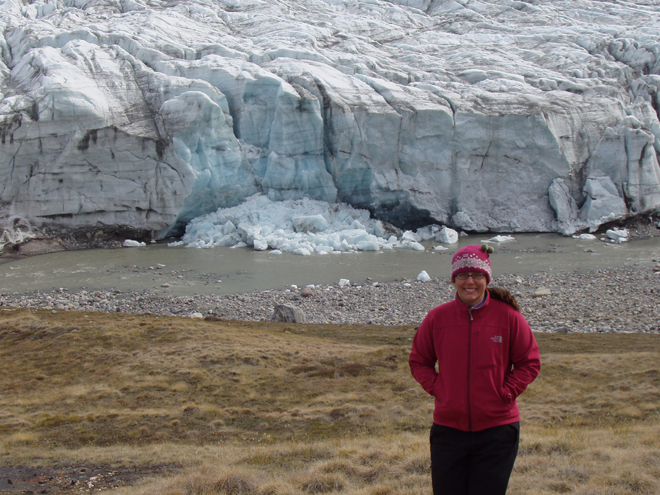
Colleen McIntosh stands by the ground-based GPS antenna for the airborne Land, Vegetation, and Ice Sensor. Credit: Image courtesy of Colleen McIntosh

I am the GPS processor for the Land, Vegetation, and Ice Sensor (LVIS) team, along with Michelle Hofton. After arriving in Thule, Greenland, Michelle showed me the GPS Shack, which is where I will be working during the IceBridge mission. That’s where the ground-based GPS antennas and receivers for both the airborne LVIS and Airborne Topographic Mapper (ATM) instruments are located.

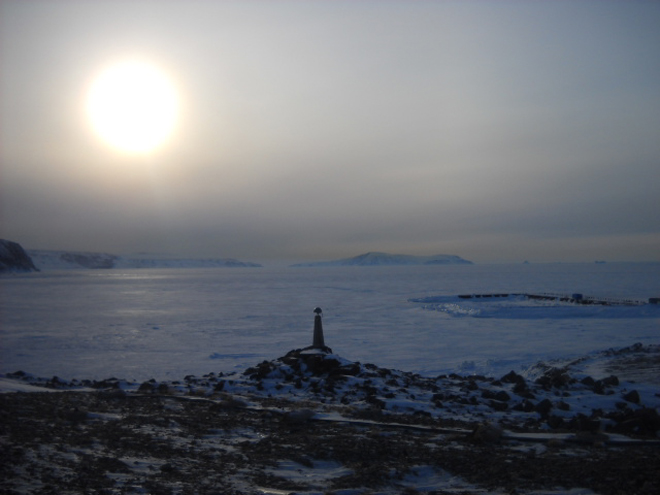
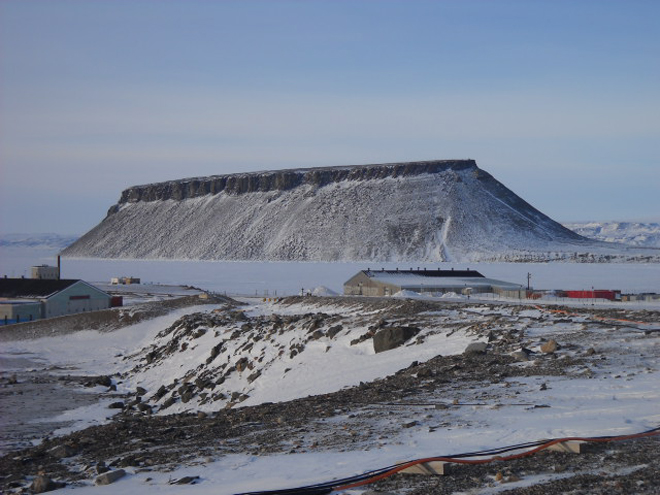
“The Shack,” as we call it, happens to be on the opposite side of the base from rest of the buildings. It is very small — just big enough for a couple computers, receivers, and some chairs. Just outside the Shack is the pier in the North Star Sea. There is also a great view of Dundas Mountain, which we may be able to climb if it gets warm enough while we are here.

The view of the North Star Sea as seen from just outside the GPS Shack. Credit: Image courtesy of Colleen McIntosh

The view of Dundas Mountain as seen from the GPS Shack. Credit: Image courtesy of Colleen McIntosh

While at the Shack, both the ATM GPS person and I check on the height of our antennas as well as replace data cards and download the GPS data from our receivers. The winds always seems to pick up once we get to the Shack since we are right on the frozen water, so measuring the height of the antenna can be rather difficult. As you can see in the picture we have several rocks weighing the antenna’s tripod down so it does not blow over.

Over the years and several trials later, the LVIS group has, I believe, come up with the best standing position for our tripod set up, so the wind doesn’t blow it over and so it doesn’t sink into the ground too much. The antenna is checked and the data is downloaded about twice a day, usually before and after a flight. But we also leave the receivers running on days we don’t fly to collect as much data as possible. This allows us to get the best position possible for the antenna, which in turns gives us an accurate position when we combine it with the flight GPS data.

Once the GPS data is collected, then the processing fun begins. Collecting data is a daily job for the GPS ground crew, and at the end of a mission, boy do we have a lot of data to process!

Sea Ice in HD

From: Michelle Williams, video producer, NASA’s Goddard Space Flight Center

Flying in a four-engine jet at 1500 feet above Arctic sea ice for eight hours sounded a little nerve-racking before I left for Thule, Greenland with Operation IceBridge. I am tagging along as a video producer for the first two weeks of the mission, and it has been a fascinating experience so far.


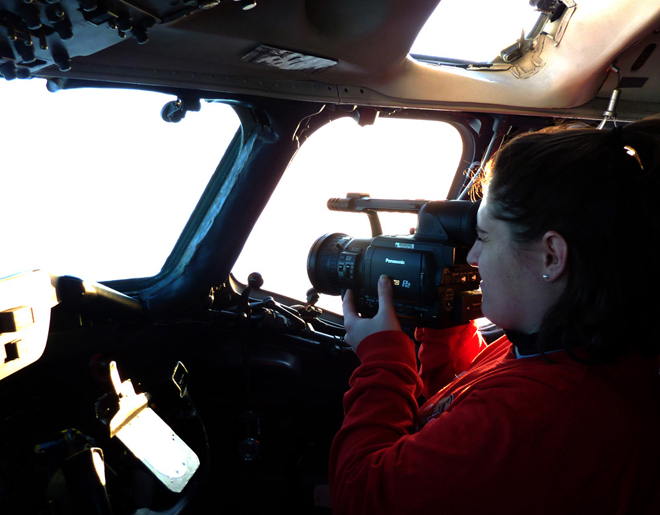
Video producer Michelle Williams shoots high-definition video on a camera that is versatile and lightweight, which Williams says is ideal for capturing footage from Icebridge flights. Credit: NASA/Dick Ewers

We landed in Thule on Monday, March 22, after an overnight transit flight from Palmdale, California. As we approached the airstrip, the pilots kindly invited me to film the landing from the cockpit.


Stunning scenery from the flight on March 22 overshadowed the anxiety that video producer Michelle Williams felt prior to the IceBridge mission. Credit: NASA/Michelle Williams

Our science flight on Tuesday, March 23, was a sea ice flight near Canada’s Ellesmere Island. We flew at an altitude of about 20,000 feet for an hour and then descended to between 600-1500 feet for the remainder of the flight over the frozen surface of the Arctic Ocean.


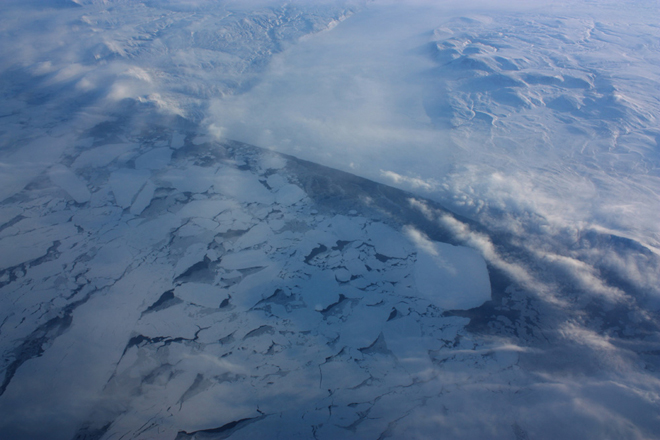
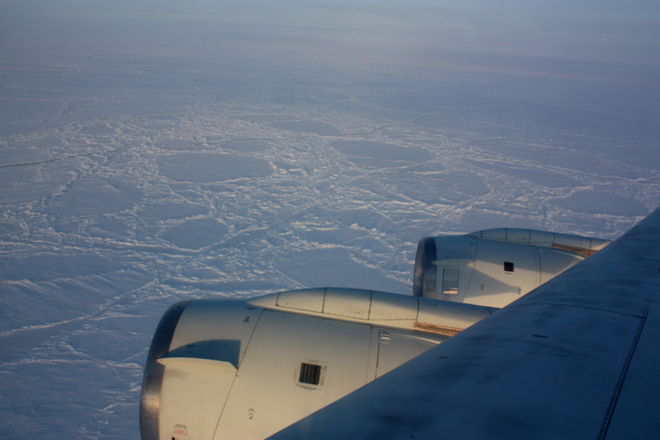
Sea ice is visible from the window of the DC-8 during a mission to map the ice near Ellesmere Island. Credit: NASA/Michelle Williams

NASA’s 40-year old DC-8 is a workhorse, and it is surprisingly steady at such a low altitude. The plane was not originally designed for low-altitude flying, but it performs well in this environment. Pilots Dick Ewers and Bill Brockett have over 80 years of experience between the two of them, and with the help of navigator Manny Antimisiaris and flight engineer Doug Baker they expertly maneuver the plane over the ice.

The glacier flight on Wednesday, March 24, was just as spectacular. We flew a grid pattern over the upper and lower segments of the Petermann Glacier, winding along the river of ice to sea level and back to the interior of the island.


Ice in the shadow of Arctic hills poses a stark, surreal contrast. Video producer Michelle Williams darts from window to window, trying to get a clear and steady shot of the ice below and the cliffs on either side of the plane. Credit: NASA/Michelle Williams

The footage I’ve collected so far will be used for a number of IceBridge videos when I return to NASA’s Goddard Space Flight Center in April. Keep an eye on the IceBridge site and the multimedia gallery.

Calibrating in California

Before the IceBridge crew flew to Thule, Greenland, they performed a test flight on March 17 in California to calibrate the aircraft’s science instruments.


From: John Sonntag, senior scientist with the IceBridge management team, URS Corporation in Wallops Island, Va.

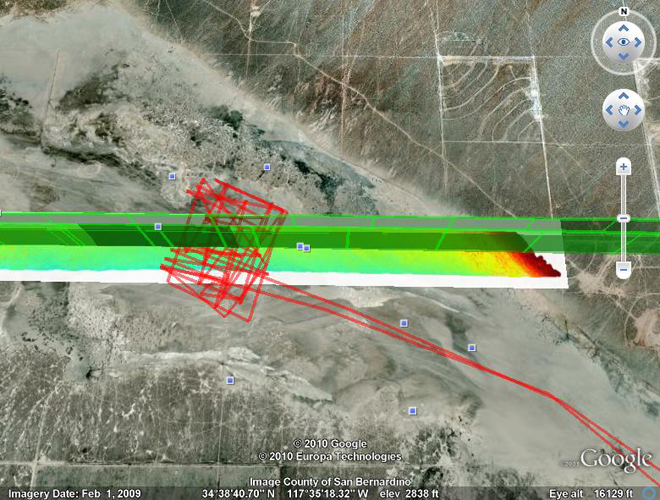
This Google Earth image graphically illustrates one of the many techniques the Airborne Topographic Mapper (ATM) team utilizes to calibrate and validate our instrument.

The image shows El Mirage Dry Lake, about 25 miles east of Palmdale, Calif. We overflew the lakebed three times on the March 17 test flight — the flight paths are shown in green. The extremely detailed elevation measurements made by the ATM are depicted by the multi-colored swath, with warm colors depicting topographic “highs” and cool colors depicting lows. The red path is a survey we conducted of the lake surface with a GPS-equipped vehicle.

By comparing the ATM laser swath measurements with the surface measurements we made using the GPS-equipped vehicle, we can derive a variety of calibration measurements for the ATM, which we use to improve its accuracy and precision, ultimately to the level of a few centimeters. This process has just begun and will be supplemented by many other datasets as we proceed with the campaign.

Another aspect this image illustrates is the extremely high precision of our navigation systems, which are also part of the ATM system. The flight crew “coupled” their autopilot to our precise navigation system for all three of these passes. The result was that all three passes were within just a few meters of each other — pretty impressive when we’re flying at 250 knots!

NASA Readies for Spring 2010 Ice Bridge Campaign

From: Kathryn Hansen, Science Writer, NASA’s Earth Science News Team


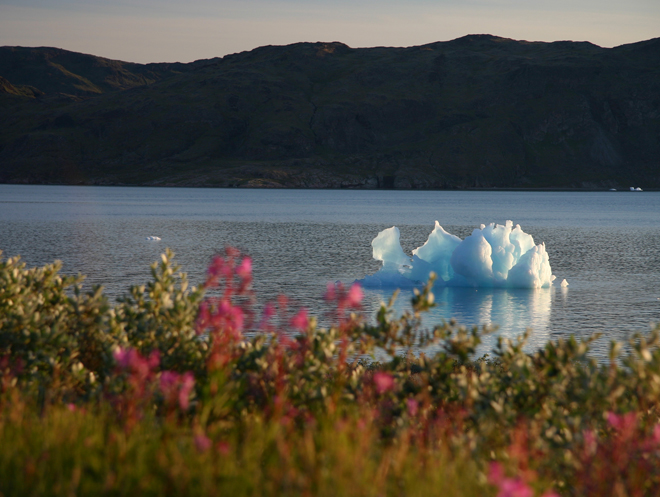
Credit: John Sonntag/Wallops Flight Facility

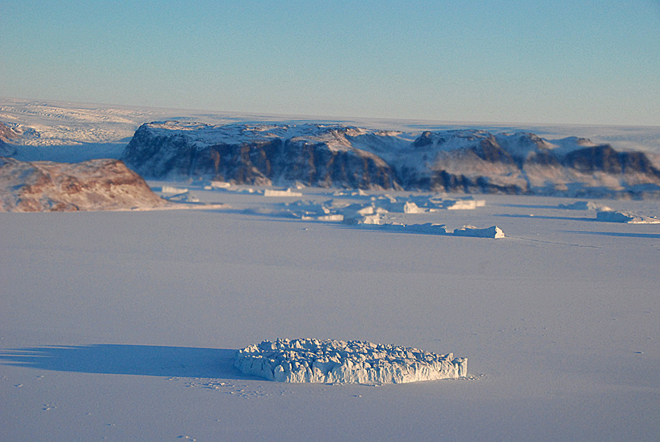
In August 2008, NASA scientist John Sonntag, of NASA’s Wallops Flight Facility in Wallops Island, Va., captured this view of a small iceberg as it moved down the Narsarsuaq fjord in southern Greenland. “I spent about half an hour watching that little berg, which was in the process of disintegrating during the time I was watching,” Sonntag said. “It went from a complete, small berg to a collection of floating ice rubble within that small span of time. The place was so quiet that the noise of the berg softly coming apart was the only sound present.”

Sonntag’s observation took place during the 2008 NASA and Center for Remote Sensing of Ice Sheets (CReSIS) airborne deployment in Greenland. This spring, Sonntag and other scientists return to the Arctic for big picture and little picture views of the ice as part of NASA’s six-year Operation Ice Bridge mission — the largest airborne survey of Earth’s polar ice ever flown — now entering its second year. The project team is finalizing flight paths over Greenland’s ice sheet and surrounding sea ice, where scientists will collect measurements, maps and images from a suite of airborne instruments. Such information will help scientists extend the record of changes to the ice previously observed by NASA’s Ice, Cloud, and land Elevation Satellite (ICESat), while uncovering new details about land-water-ice dynamics.

NASA aircraft have made numerous science flights over Greenland, most recently during the spring 2009 Ice Bridge campaign and also in 2008 as part of the NASA/CReSIS deployment. Smaller-scale airborne surveys have been made by William Krabill, of NASA Wallops, and colleagues nearly every spring since 1991.

Visit the Operation Ice Bridge Web page throughout the spring 2010 campaign for news, images, and updates from the field. Flights from Greenland are scheduled to begin no sooner than March 22.


Welcome to the Start of the Operation IceBridge 2010 Campaign


From: Lora Koenig, IceBridge project scientist, NASA’s Goddard Space Flight Center


Credit: Image is courtesy of Lora Koenig, NASA’s Goddard Space flight Center

Hello, and welcome to the start of the Operation IceBridge Greenland 2010 campaign. Over the next few months we will be blogging about the science, research, aircraft, and day to day activities of our airborne campaign. The NASA DC-8 aircraft is fully loaded in Palmdale, Calif., and will take off late Sunday night to fly scientists, crew and instruments to Thule, Greenland. The DC-8 will stay in Greenland until the end of April at which time the NASA P-3B aircraft will take over for another month of flights monitoring the changes occurring over the Greenland ice sheet and the Arctic sea ice. Hopefully some of you are returning to the blog after our previous Greenland 2009 and Antarctic 2009 campaigns. Please check in often to follow our progress and learn more about our exciting Arctic research.

My name is Lora Koenig and I am a physical scientist in the Cryospheric Sciences Branch at NASA’s Goddard Space Flight center. You may be asking, what is cryospheric science? Well, it is the branch of science that studies the areas of frozen water on Earth. This includes science related to snow, sea ice, ice sheets, glaciers and permafrost. My research is focused on monitoring changes over the Greenland and Antarctic Ice Sheets and for the last five months I have been one of the NASA project scientists in charge of IceBridge. In this blog I will tell you a little about the planning that has gone on behind the scenes for this campaign.

For the last five months, starting while most of the IceBridge team was still in Antarctica, NASA started planning for the Greenland 2010 Campaign. Because the austral (Southern Hemisphere) spring and boreal (Northern Hemisphere) spring are only six months apart the IceBridge team is constantly planning for the next field campaign. Yes, the Antarctic 2010 campaign planning has already started and the DC-8 has yet to take off for Greenland.

What does planning for a major NASA airborne mission entail? Two things: logistics and flight line planning. A team at NASA’s Earth Science Project Office (ESPO) and the aircraft crews have been busily working to ensure that the instruments are ready to be loaded on the plane, flight clearances are in place, hangers are ready and sufficient for the planes to use, hotel reservations are made, airports are open, divert airports are nearby in case of bad weather, cargo is shipped, the science and instruments teams have flight reservations and passports, cold weather gear is assembled, food is available, internet is set up, and the list goes on and on. These behind the scenes logistics and preparation make for a successful field campaign.

While ESPO was dealing with the logistics, the IceBridge science team and I were tasked with planning flight lines. The Greenland ice sheet and the Arctic Ocean are large areas to monitor. Our aircraft cannot fly everywhere so the science community works together to decide where to fly, when to fly, and how often to fly. Flight decisions are made though a consensus process conducted by teleconferences and meetings with groups of scientists who specialize in studying sea ice, the Greenland ice sheet and ice sheet modeling. Most of the scientists are trying to answer one of the following questions: How are changes in the Greenland ice sheet affecting sea level rise? What changes are occurring to the Arctic sea ice extent and thickness? And in the future, what changes should we be preparing for as the Greenland ice sheet and Arctic sea ice cover change?

Each community of scientists requests specific areas where they want data, and each community desires a specific instrument to take their measurements. In many cases there is overlap in flight lines and instruments and in some cases there is not. Throughout this campaign you will hear about specific flights and the scientific reasons they were flown. Some flights will focus on sea ice, others will overfly glaciers that are changing rapidly and some will overfly scientist working on the ground so results can be extrapolated over a larger area. The IceBridge flight plans are designed to meet the needs of many within a limited amount of time. Flight line planning started in January and was just completed last week. John Sonntag, who you are sure to meet later in the campaign, is the master flight line designer and keeps the aircraft on track for making important scientific discoveries.

Well, I hope this gives you a bit of a flavor for the work that has been occurring by computer, phone and desk to get the Greenland 2010 Campaign up and flying. Next stop Thule, Greenland, with a transit flight that — weather dependant — was designed to monitor a small portion of the southeast Alaskan glaciers and the Arctic sea ice on a transect across the Arctic Ocean.

Operation IceBridge Off to a Successful Start in Greenland

From: Michael Studinger, IceBridge project scientist, Goddard Earth Science and Technology Center at the University of Maryland

Hello and a warm welcome to all blog readers from the IceBridge team here at Thule Air Base in northern Greenland. After taking off on Sunday night from NASA Dryden’s Aircraft Operations Facility in Palmdale, Calif., the NASA DC-8 arrived at Thule Airbase on Monday afternoon. Both the aircraft and science teams have done an incredible job in setting up operations in record time here in Thule. 


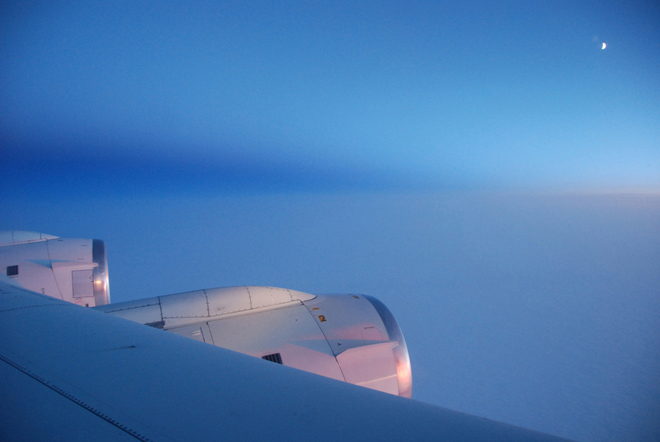
The moon and sunrise are visible over the Arctic Ocean during the flight from Palmdale, Calif., to Thule, Greenland. Credit: Michael Studinger

We were able to take off for an eight-hour science flight on Tuesday morning to survey the sea ice in the Arctic Ocean north of Ellesmere Island. Wednesday’s science flight was targeted at several glaciers north of Thule. Some of the glaciers have been surveyed for the first time last year and we are back this year to monitor the changes that have occurred since last spring. We begin the day with flying over a small glacier called Heilprin Glacier. We are very early in the season and the sun is just above the horizon in the morning hours, illuminating the coast of Greenland with its frozen fjords, icebergs and glaciers in a beautiful light. 


The sun is very low and only barely above the horizon at the beginning of the third science flight, creating beautiful illumination of the cost of Greenland with its frozen fjords, icebergs and glaciers. Credit: Michael Studinger

After an hour of flying we begin to fly a grid pattern in the catchment area of Petermann Glacier to measure the thickness of the ice with a radar system from the University of Kansas. These data will be used as input for computer models that will allow us to better predict how the Greenland ice sheet will respond to environmental changes in the Arctic.

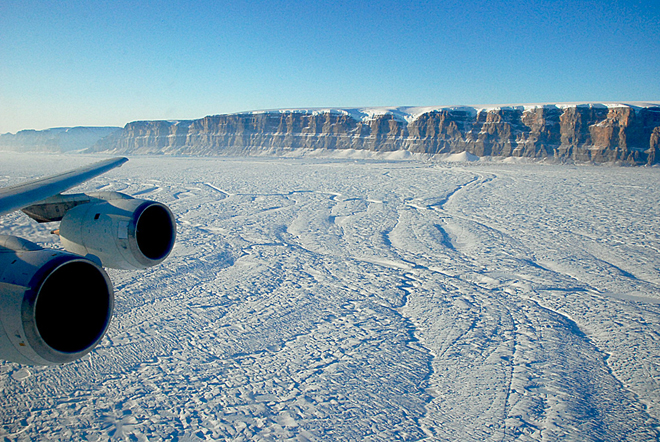
We continue our flight by repeating two survey lines along Petermann Glacier that have been surveyed several years before. The scenery with the steep sidewalls is spectacular. We can see huge meltwater channels on the surface that will be filled with water running down the glacier when the Arctic melt season starts in a few months. 


The IceBridge crew fly down Petermann Glacier in northern Greenland with NASA’s DC-8 aircraft. Credit: Michael Studinger

After completing the flight lines over the Petermann Glacier we turn back towards Thule Air Base and measure the ice surface elevation with a laser altimeter along a track that has been measured many times by NASA’s ICESat satellite. We are heading back to Thule Airbase to land before the tower and airfield close for the day. 


At the end of a day of glacier flying, Dundas Mountain — a major Greenland landmark — can be seen during the approach to Thule Air Base. Credit: Michael Studinger

We have had an incredibly successful start of the 2010 Arctic campaign. We have been able to collect LVIS laser data along the transit from California to Greenland and have been flying 3 days in a row collecting huge amounts of data. A storm system here in Thule has forced us today to stay on the ground and everyone is catching up with sleep and data processing. With a little bit of luck we hope to fly the DC-8 again on Friday. Thanks to all the aircraft and science teams, the staff at Thule Air Base, and many people back home who have made such an incredible start of the IceBridge 2010 campaign possible!


Mowing the Lawn at Pine Island Glacier


From: Jill Hummels, Public Information Officer, University of Kansas School of Engineering


PUNTA ARENAS, Chile, Oct. 20 — Today’s high-altitude flight took NASA’s Operation Ice Bridge researchers over Antarctica’s Pine Island region (75° 25’ S and 98° 25’ W and surrounding area).


“We’re really pumped. We’re getting some really good data,” says Chris Allen from the University of Kansas about midway through the 11-hour flight. The electrical engineering professor and four graduate students are operating three different radars developed at the university through the National Science Foundation Center for Remote Sensing of Ice Sheets.


Chris Allen at the controls of the MCoRDS radar, over Antarctica. (Jill Hummels/University of Kansas)


“A while back, we were over the ice shelf, and it was very distinct.” Now, as the plane progresses over the land formation, the vibrant multicolored display offers less clear information. But the raw data is still being captured. “That’s where the signal processing comes in,” Allen says.


The display offers a cactus-like spectrum of color, with spikes protruding from separate layers of color. The uninitiated eye can clearly see a “surface” in the image. That would be the top of the ice layer, Allen explains. The more trained eye knows that where the yellow, aqua and blue colors intermingle is where the real action lies. More sophisticated methods will be needed to coax meaning from the raw data.


Already the Kansas team is eliciting “oohs” and “ahhs” from other science team members through data they’ve collected with the MCoRDS radar in the mission’s two previous flights.  In a recent evening briefing at the hotel in Punta Arenas, an image being displayed for all to see appeared to show that in one inland area of Antarctica the ice sheet is several kilometers thick and is nestled in a channel of bedrock that appears to be well below sea level.


Five hours after today’s flight started, the plane has gone through several passes over the glacier and still has many more to go. The proscribed flight path — called “mowing the lawn” — includes 11 parallel lines and a couple perpendicular ones. Each parallel path is about five miles apart. However, the flight crew skips the adjacent path in order to comfortably make the wide turn to the next run. A couple “teardrop turns,” wider turns that loop back nearly 360 degrees to a narrower path, have been thrown in for good measure to ensure the science and engineering teams are on the exact positions they need.  It also helps break the monotony of flying over endless tracks of white.


Even after the flight crew has maneuvered the DC-8 through its perpendicular labyrinth and is making the long stretch home across the Antarctic Ocean, the Kansas team will still be hard at work crunching numbers and distilling hard truths from the icebergs of raw data.  With significant computing power aboard the plane, the team has made it a goal to try to deliver detailed information about ice sheet thickness and more by the time the plane lands in Punta Arenas.


The DC-8’s flight plan (dark lines) and actual flight paths (red lines) mid-way through the “mowing” of Pine Island Glacier. (Pine Island Bay is on the left side of this image.)


Up and Down Thwaites Glacier


From: Kathryn Hansen, Science Writer, NASA Goddard Space Flight Center


NASA’s DC-8 returning from its second Antarctic flight of the mission.  (NASA/Steve Cole)


On Sunday, Oct. 18, researchers and crew flew on the DC-8 aircraft’s second Antarctic flight of the Operation Ice Bridge Campaign. The mission was dedicated to reflying areas of Thwaites Glacier previously mapped by the ICESat satellite to see how the glacier has changed.


The team took advantage of the good weather, flying at low altitude, spending about three hours surveying the glacier with the Airborne Topographic Mapper (ATM), the campaign’s primary instrument. ATM pulses laser light in circular scans on the ground, which reflects the pulses back to the aircraft. The laser data are then converted into elevation maps of the ice surface.


Another instrument, the Multichannel Coherent Radar Depth Sounder (MCoRDS), collected thickness measurements over the glacier. The instrument team’s initial analysis of the data turned up unexpected depth.


First Flight: Across the Getz Ice Shelf


From: Steve Cole, Public Affairs Specialist, NASA Headquarters


PUNTA ARENAS, CHILE – The first flight of Operation Ice Bridge was made from the southern tip of South America on Friday, Oct. 16. The primary target was the Getz Ice Shelf along Antarctica’s Amundsen Coast. The DC-8 flew two parallel tracks along the coast, one just offshore over the floating ice shelf, and one just inland. By measuring on either side of the “grounding line” between the floating ice and the ice on land, scientists can determine the rate at which this near-shore part of the ice shelf is melting.


This target area was selected from the series of flights planned because weather forecasts showed that this was the only clear area available. The low-altitude Getz grounding line paths would allow for a survey of the bottom topography with the MCoRDS instrument, a search for the presence of under-ice water with the gravimeter, and ice surface topography measurements with the ATM laser instrument.


The plane took off at 9:11 a.m. local time with 31 people onboard, including a videographer with the Associated Press. The DC-8 flew at 35,000 feet on the ocean transit to Getz. During this part of the flight, the LVIS laser and the DMS mapping camera made observations of the sea ice. The DC-8 covered 1630 nautical miles before getting to its science targets in Antarctica.


The DC-8 descended to about 1500 feet just east of the Scott Peninsula to begin the low-altitude observations. At the end of the flight path over the Getz Ice Shelf, the plane turned out over the sea ice, which was characterized by open water.


The DC-8 then flew up the DeVicq Glacier to an elevation of about 5,000 feet. Returning to the onshore survey line, the pilots were able to fly the entire line with clear skies. We completed a total of 3.5 hours of low-level flight. The ATM team reported collecting about 200 million laser measurements during the flight. The DC-8 landed at about 9 pm.  Total flight time: 11 hours, 45 minutes.


— Based on reports from Seelye Martin (University of Washington) and James Yungel (NASA Wallops Flight Facility)


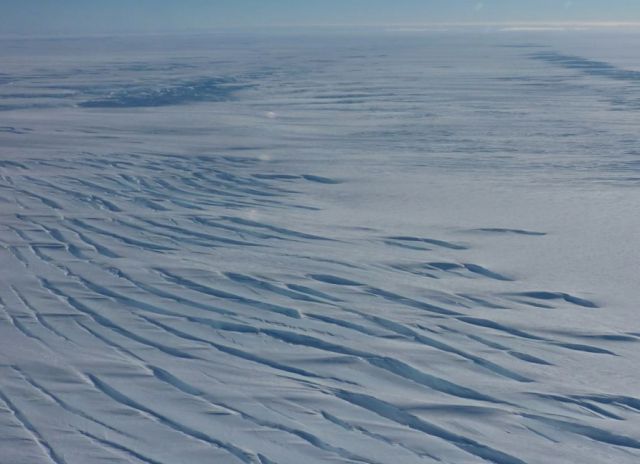
Getz Ice Shelf at low altitude (Photo courtesy Seelye Martin)


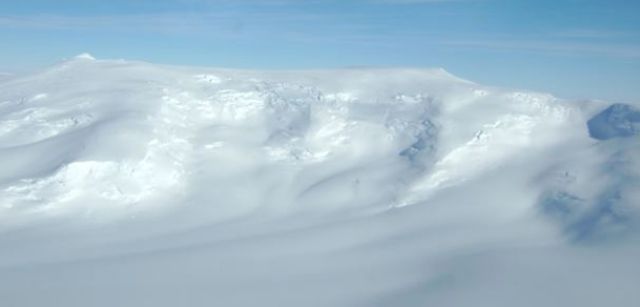
Mount Kauffman at the head of the DeViqc glacier (Photo courtesy John Yungel)


Antarctic sea ice from 20,000 feet. (Photo courtesy John Arvesen)


On Sea Ice


From: Kathryn Hansen, Science Writer, NASA Goddard Space Flight Center


The Operation Ice Bridge team is just about to start science flights over two main Antarctic targets: ice sheets and sea ice. Thorsten Markus, principal sea ice investigator for the mission, chatted with me at NASA Goddard in Greenbelt, Md., about sea ice and how measurements from the air will differ from what’s possible on the ground or from space.


We hear a lot about sea ice in the Arctic. How is sea ice in Antarctica different?
 

Markus: The immediate response is that the Antarctic sea ice is experiencing a decline in cover. The problem with Antarctica is that you don’t have an easy one-sentence answer. The Arctic is sort of easy: the ice is decreasing, and we’ll eventually see ice-free summers. In Antarctica, the system is more complex. Next to West Antarctica, sea ice is decreasing. Around the Peninsula it’s also decreasing and probably getting more snowfall, so we see big changes there, too. But for more of the continent, we actually see a slight increase in sea ice. It has to do with the ocean underneath the ice, the ozone hole, and a combination of both. A big difference is also that Arctic sea ice is centered at pole with land masses around it. In Antarctica, we have the opposite scenario:  A landmass centered at the pole, the Antarctic ice sheet, and sea ice around it in full contact with the world’s ocean.


What are the potential global impacts of changes to Antarctica’s sea ice?


Markus: Sea ice formation and melt have a really strong impact on ocean circulation, which acts like a huge heat pump keeping our climate stable. This “thermohaline circulation” is driven by temperature and salinity. The interesting part of this circulation is that the deep, bottom water masses of the ocean only make contact with the atmosphere only at polar latitudes, in the Arctic or the Antarctic. Change ocean salinity — by growing or melting sea ice, which is inherently salt-free — and you can affect global circulation. The process is complex, but that’s basically why it’s so critically important.


Sea ice in Antarctica is also important for the global energy balance, just as in the Arctic. It’s a white surface that reflects solar energy, which affects Earth’s whole energy system.


Do we have a good idea of what the thickness is?


Markus: There are some measurements from drillings or from icebreakers, but those are snapshots in time and very sparse. The area you cover with a ship is excruciatingly small. So we do have some idea, but it’s not great. With the ICESat satellite and the Operation Ice Bridge airborne campaign, we have a chance to get ice thickness measurements over larger scales than we have been able to get before.


We have more instruments on the plane than we have on the satellite. So while aircraft don’t provide nearly the coverage of satellites, you do get additional information — such as thickness — that should be really useful.


What sea ice information will we get from the aircraft campaigns?


Markus: We have a laser altimeter, Bill Krabill’s instrument, that’s similar to ICESat and is the primary instrument of the mission. The laser bounces off the surface, whether it’s snow or ice, and provides a measure of surface elevation. But we also have radars on this plane, developed by the University of Kansas, which penetrate the snow. If you look at the difference between the laser and radar results, ideally you get the snow depth.


Accurate snow depth is important for estimating sea ice thickness, which is done with a conceptually simple calculation: if you know how much ice is above the water, then you can estimate how much is below the water. The problem occurs when you have snow on top, which submerges the ice to some extent.


Snow depth is a bigger issue for Antarctica because we have overall thinner ice and more snow than we have in the Arctic. It can vary quite significantly — anywhere from zero to a few meters — and it can be so heavy that the ice itself is submerged below sea level and you get flooding on the interface.


ICESat does not have radar, so in this regard we are getting a value-added product in Ice Bridge. In an ideal world, people would put a radar altimeter together with a laser altimeter — something you can do on a plane, but not as easily on a satellite.

So there’s a need to continue flying airplanes?


Markus: Yes. Some people are saying “Wow, we can do everything with airplanes,” which is wrong because the Antarctic is huge. It looks great on paper because all the flight lines that we draw on maps are pretty thick. But if you drive with your car across the United States and measure something, does this represent the entire United States? If you drive too far south, you miss the Rockies, and if you drive too far north, you miss the desert Southwest, so you get a completely wrong picture of the United States.


We can, however, look at critical areas in the sea ice, as well as over the ice sheets and see how they are changing in the time between ICESat and ICESat-II, so that we are not completely blind. 


Why is it important to have that continuous coverage in Antarctica?


Markus: We want to establish a consistent long-term record so that we have continuous coverage. A gap in data leaves you with just a snapshot in time and poses a problem. For example, if you measured Washington, D.C.’s temperature in December 1990 at 70 F and then again on that date 10 years later at 30 F, you might assume a dramatic cooling trend. We want to avoid a similar misinterpretation of changes in Antarctica. We now have five years of data from ICESat, but we have just started to understand the processes.


Have you been to Antarctica?


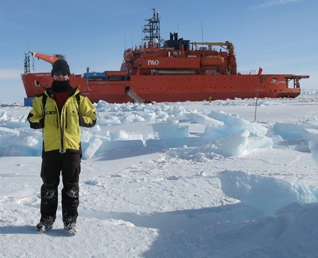
Markus: Yes, several times for field work. On an icebreaker mostly.


The irony is that from a plane, as well as from on the ice, it looks and feels like really solid ground.  It looks perfectly still. You’re in an ice desert.  On previous field expeditions that were on the ice, we would take out drills and hammers and more sophisticated instruments and do our work; it looks pretty much like a construction site. The captain would tell us afterward that we drifted 10 miles while we were working. It’s just incredible if you think about it: standing on ice we would measure its thickness with all these drills and know we were on 15-20 centimeters of ice, and that underneath is 4,000 meters of water. You’re floating out there, it’s a terribly cool thing.


What about from the sky?


Markus: Ice Bridge flights won’t land in Antarctica, but even from a plane, sea ice looks static. An animation compiled from satellite images of Antarctic sea ice shows you how dynamic the sea ice is — how it looks like a living thing. In Greenland, I showed a similar movie of Arctic sea ice to the pilots while we were flying and they were amazed when they saw what’s really happening. Only since satellites did people get a better understanding how dynamic the sea ice is.
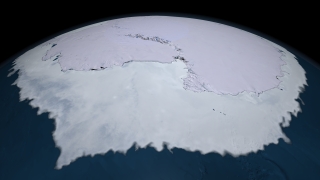


Sea ice surrounding the Antarctic landmass is dynamic, shifting in location, extent and thickness. This animation shows the sea ice motion around Antarctica from June 4 through Nov. 18, 2005. Credit: NASA/Goddard Space Flight Center Scientific Visualization Studio