New perspectives on the IceBridge sea ice campaign

By Nathan Kurtz, IceBridge scientist, NASA Goddard Space Flight Center/Morgan State Univ.

As the IceBridge Arctic sea ice campaign continues another successful year, I’ve been given this wonderful opportunity to discuss my experiences on the mission, and more importantly, how they relate to the critical science questions that need to be answered. I realize that there are many details I find intriguing as a scientist that are inherently uninteresting to non-scientists, so I won’t wax philosophical about how impressed I was to see things like the self-similar structure of deformation patterns in sea ice (if you actually came here for that, I apologize). My aim is to communicate the importance of what we are learning to the broader public who funds and ultimately benefits from this work. I hope you learn something about why we are devoting so many resources to this scientific study, as this is perhaps the most effective type of ‘bridge’ the IceBridge mission can make: to raise awareness of the state of the climate and present the scientific facts as we have gathered them through a long and arduous field campaign.
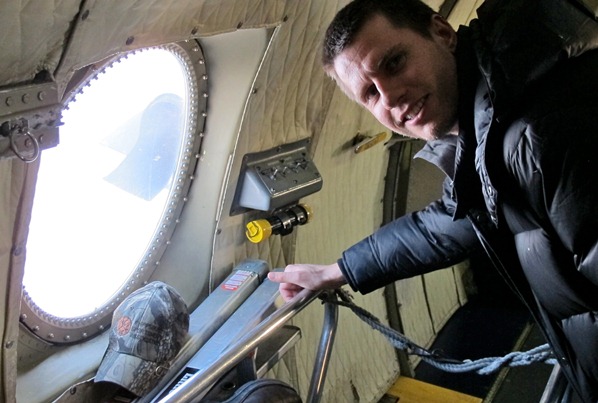
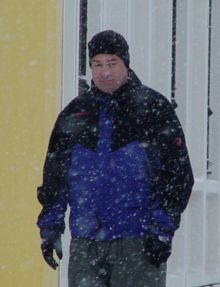
IceBridge science team member Nathan Kurtz checking out the sea ice conditions

IceBridge science team member Nathan Kurtz checking out the sea ice conditions. Credit: James Yungel/NASA.

This was my first trip to the ice-covered regions of the Arctic and I fully admit to reverting back to an excited childlike state of wonder as my initial flight to Thule, Greenland, touched down. It was quite striking to take in the sight of the vast snow-covered mountains and frozen sea, feel the bitter cold draining the heat and life from my body and realize that actual ‘monsters’ with an instinctive mindset to view humans as prey were all around. But I was shocked to see a hardened community of people standing resolute against these elements. Even more shocking, was to imagine why humans came here thousands of years ago without modern technology. What led them here? For me, the Arctic has always symbolized the unknown, but with hidden treasures awaiting anyone brave enough to explore it. But I realize my subjective symbolic interpretation is also remarkably universal in that native settlers, polar explorers and scientists must also have come to the Arctic with a desire to explore an unknown wilderness and gain some new knowledge from their experience. 

On the scientific end of this knowledge spectrum, recent studies have increasingly shown the importance of the Arctic to the climate. The once seemingly insignificant and remote Arctic region is now understood to be intimately connected to the rest of the planet. Sea ice variability affecting the severity of snow storms in Europe, melting sea ice increasing the absorption of sunlight by the Earth and melting ice sheets causing sea level rise are but a few of many such connections. We are learning that what happens in the Arctic will profoundly affect the whole of humanity all over the Earth. Viewed in this way, it is no longer a coincidence that humans have taken such a keen interest in the Arctic, and that this wild frontier is indeed a source of valuable knowledge waiting to be unearthed.
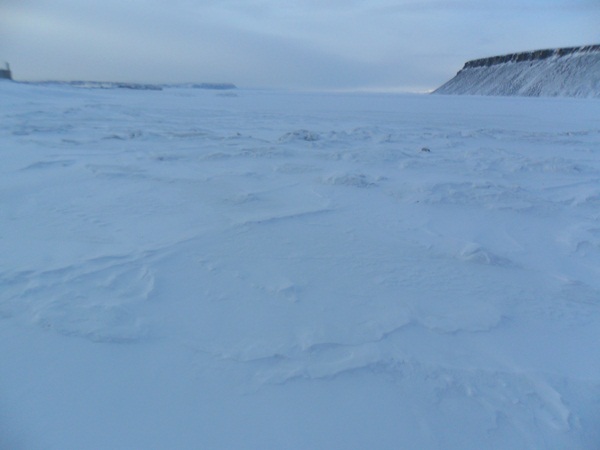
Looking out across the sea ice near Thule, Greenland

Looking out across the sea ice near Thule, Greenland. Credit: Nathan Kurtz/NASA

As a scientist, the purpose of my trip here is to learn more about the Arctic sea ice cover. My job is to use a combination of lasers, radars, cameras and infrared sensors to determine how the thickness of sea ice is changing, and whether any observed changes can be linked to the larger climate system. Flying over the sea ice with all the IceBridge instruments operating simultaneously has given me a whole new perspective on the mission. It has taken me from my normal desk job of looking at numbers on a computer screen, to the reality of what those numbers represent, and back again full-circle to connecting these concepts in a meaningful way. It has given me the opportunity to physically see that an increased laser surface elevation is actually a large sea ice pressure ridge, a widely spaced radar return is actually a snow drift. That, ultimately, all of the IceBridge results are indeed real and meaningful. It is this connection between numbers on a computer screen to the reality of the ground which will provide me and other scientists with the ability to come up with a rigorous scientific explanation of precisely what role sea ice thickness changes will have on the climate. 

In the course of my own analysis of the IceBridge data I have been constantly questioning my methods to ensure that my excursions into the abstract realm of mathematical and scientific theory do not lose sight of this connection to the things I’ve seen on the ground. Questions such as what do I do when I try to invert a matrix of IceBridge data and it explodes? How can I utilize statistics to determine just how accurate these measurements are? Are my solutions to these problems in tune with the physical environment I have witnessed? This ultimately translates into maintaining high standards and objectivity, which is critical to any scientific research area.
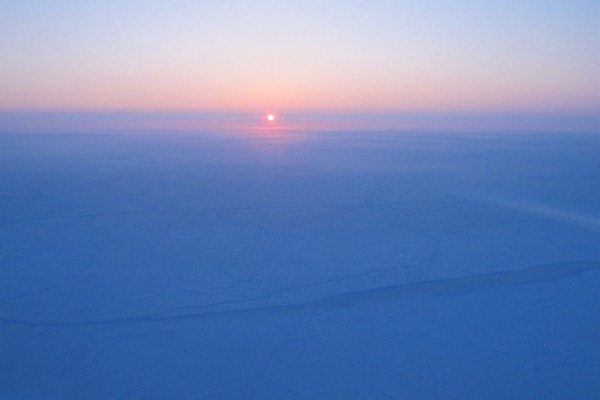
Sunrise over sea ice near the North Pole

Sunrise over sea ice near the North Pole. Credit: James Yungel/NASA

But this is, admittedly, my own subjective understanding of my role in this project. More important, is how my understanding and use of these concepts relates to the scientific results being obtained, and how these results can then be translated into a general statement for the public such as ‘the sea ice thickness decreased by x centimeters’ Towards this end, I and a large team of people have worked for the past two years on developing methods to turn the instrument data from IceBridge into clear and understandable scientific data products. We recently reached a major milestone in the project by demonstrating our ability to produce easy to understand products such as snow depth and sea ice thickness from past missions. In the interest of promoting honest and open exchange of scientific knowledge, we have given public access to these data sets (http://nsidc.org/data/idcsi2.html) in such a way that anyone can look at the latest results of the project. In doing so, we went from the realm of raw instrument data, to something that anyone can understand and interpret.

To further improve the utility of the IceBridge sea ice campaigns, we are attempting an unprecedented feat: to produce a quick version of the scientific products to support operational forecasting of sea ice. This is shaping up to be a monumental undertaking, and we are working hard to understand how to work with days-old field data. It remains to be seen what role IceBridge can play in sea ice forecasting and how we can interpret the data to come up with statements about the state of Arctic sea ice for the general public. But, so far the results from the first few flights look fantastic! We have also provided our preliminary results to support an ESA sponsored campaign conducting field missions in the area. Everything is proceeding in a positive direction, so stay tuned for more updates as the IceBridge mission continues!

Operation IceBridge surveys new areas in the Beaufort and Chukchi Seas north of Alaska

By Michael Studinger, IceBridge Project Scientist, NASA Goddard Space Flight Center/UMBC

Fairbanks, AK – The two most important sea ice flights every year are two crossings of the entire Arctic Basin, north of Greenland and Canada all the way to Alaska. This year we decided to make the flights to and from Fairbanks earlier than usual because of the weather. The forecast at Thule was predicting a major storm system for the next few days. Storm season in Thule lasts Sept. 15–May 15, and every year blizzards with wind speeds of over 100 miles per hour and white out conditions hit the base, locking us down for a few days.

There are several challenges involved with these two flights. First, the survey lines are 1600 miles long and it is very rare to have such a large area free of clouds and fog, particularly over the Arctic Ocean. Imagine flying from New York to Colorado at 1500 feet above the surface and having neither clouds nor fog the whole way. Getting good data from our optical sensors, such as laser altimeters and digital cameras, we need clear conditions between the aircraft and the ice surface.


IceBridgeflight from Thule, Greenland to Fairbanks, AK that surveyed sea ice along atransect over the entire Arctic Basin. Basemap is MODIS satellite image showingcloud cover and sea ice over the Arctic Ocean.

A second challenge comes from predicting the weather in such a remote area. We have infrared satellite images and computer models available, but these models cannot be validated because there are no weather stations in the Arctic Ocean. Also, neither the forecast models nor satellite images show the weather features that are most important to us: low clouds and ice fog that disrupt the laser and camera measurements.

The third challenge is that we have to relocate the aircraft, crew and scientists to Fairbanks on very short notice, since the frequent changes in weather allow us to make this decision only a few hours before takeoff.

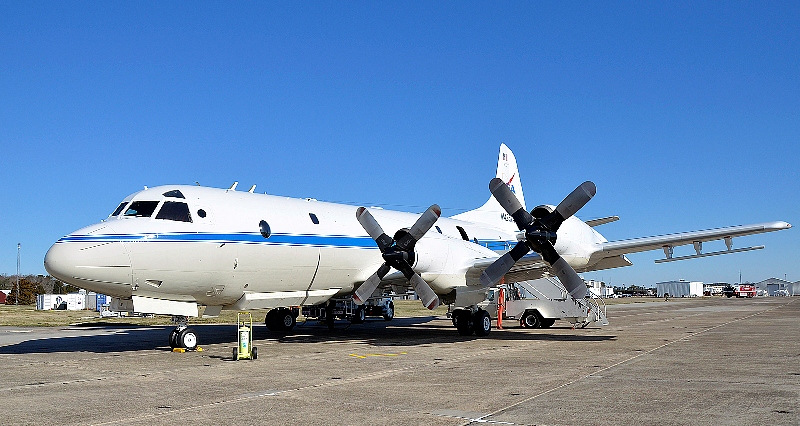
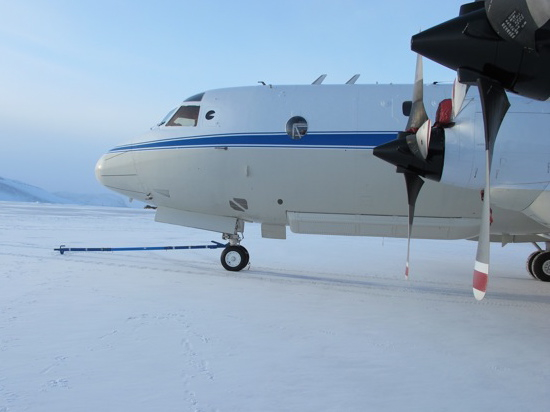
The NASA P-3 aircraft is being prepared on a chilly morning for a sea ice mission over the Beaufort and Chukchi Seas from Fairbanks, Alaska. Photo: Michael Studinger/NASA.

TheNASA P-3 aircraft is being prepared on a chilly morning for a sea ice missionover the Beaufort and Chukchi Seas from Fairbanks, Alaska. Photo: MichaelStudinger/NASA.

In order to characterize the state of the Arctic ice pack we need to survey large regions and determine the thickness of the multiyear ice that remains from the previous summer and the growth of new first year ice during the winter. We have had several successful flights over the Beaufort and Chukchi Seas from Fairbanks that surveyed primarily the newly formed first year ice in this area. This is a new area for IceBridge and an important data set to monitor changes in the Arctic environment.

We are planning to stay here in Fairbanks for a few more days before we return to Thule Air Base in Greenland to continue our campaign and survey the sea ice north of Greenland.

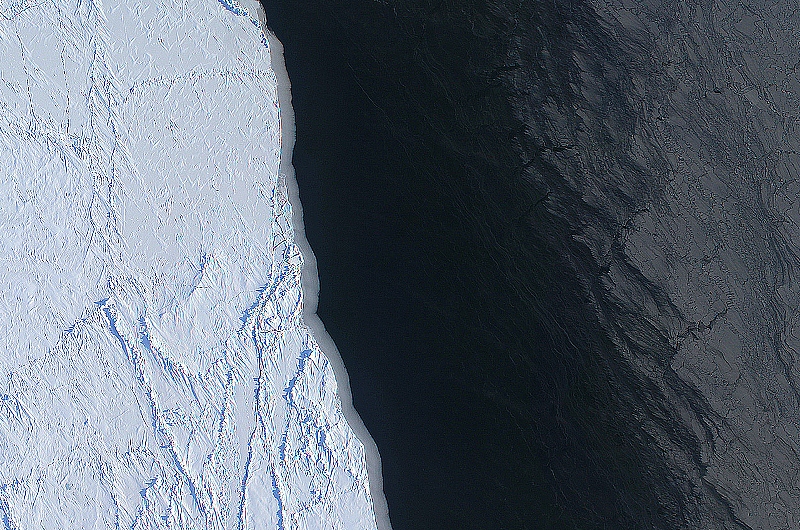
The margin of a large lead of open water (dark) and thingrease ice (gray, right) in the Chukchi Sea between Alaska and Russia. Theimage was create using several frames from the Digital Mapping System (DMS)onboard the NASA P-3. Image: NASA/DMS/Eric Fraim.


Getting Ready for the 2012 Arctic Campaign

By Michael Studinger, IceBridge Project Scientist, NASA Goddard Space Flight Center/UMBC

Wallops Flight Facility, Wallops Island, VA – Welcome to the fourth annual Arctic campaign with NASA’s Operation IceBridge. Over 75 days, we will collect data with two aircraft over the Greenland Ice Sheet, the Arctic Ocean and the Canadian ice caps. We will be based in Kangerlussuaq and Thule Airbase in Greenland, and in Fairbanks, Alaska for sea ice flights over the Beaufort Sea.

During the past several weeks, Operation IceBridge teams have worked at NASA’s Wallops Flight Facility on the eastern shore of Virginia, installing cutting-edge laser altimeters and extremely sensitive radars that will allow us to measure changes in sea ice thickness in the Arctic Ocean. We will also be monitoring changes in the thickness of ice sheets and glaciers that cover most of the subcontinent of Greenland and the Canadian Arctic Archipelago. We will start our campaign with NASA’s P-3B Orion research aircraft from Wallops at Thule Airbase in northern Greenland with sea ice missions over the Arctic Ocean. The extent and thickness of the sea ice cover in the Arctic Ocean is declining quickly and we are there to take measurements that document this change from year to year. The second plane in this year’s Artic campaign, a Falcon HU-25 jet operated by NASA’s Langley Research Center in Hampton, Va., will join the campaign later in April carrying the Land, Vegetation, and Ice Sensor (LVIS), a high-altitude laser altimeter capable of measuring a 2-km-wide (1.2-mile-wide) swath.

The P-3B aircraft inside the hangar at NASA’s Wallops Flight Facility in Virginia.

The P-3B aircraft inside the hangar at NASA’s Wallops Flight Facility in Virginia. Credit: Michael Studinger.

Before we can start collecting data over the Artic we have to make sure that all installed sensors on the P-3 work and are calibrated. In order to make extremely precise laser altimeter measurements of the ice surface elevation we calibrate the instruments using target sites at the Wallops Flight Facility that we have surveyed on the ground. A second test flight takes us out over the Atlantic Ocean, some 200 miles away from the coast, where we can switch on the radar systems from the Center for Remote Sensing of Ice Sheets (CReSIS) at the University of Kansas, without interfering with other systems. We use the radar signal that is bouncing back from the ocean surface to calibrate the radars. We also did a couple of maneuvers at high-altitude over the Atlantic to calibrate the antennas of the ice-penetrating radar systems that we will use to survey the sea ice, glaciers and ice sheets.

Research flying has little in common with everyday air travel. One of the maneuvers that we do during the test flights is to fly the aircraft at a 90° roll angle with the wings perpendicular to the horizon. Fasten your seat belts! You will (hopefully) never experience something like this on a commercial flight.

The P-3B on the ramp before a test flight. The antennas of the ice-penetrating radar system can be seen mounted under the wings.

The P-3B on the ramp before a test flight. The antennas of the ice-penetrating radar system can be seen mounted under the wings. Credit: Michael Studinger.

We are collaborating with other experiments such as CryoVEx, the CryoSat-2 calibration and validation campaign from the European Space Agency. We will also work closely together with teams that work on the ground and take measurements over sea ice in the Arctic Ocean, and do coordinated flights with an ER-2 high-altitude aircraft from NASA’s Dryden Flight Research Center in Edwards, Calif. The ER-2, a civilian research version of the Air Force’s U-2 , will carry the Multiple Altimeter Beam Experimental Lidar (MABEL). The ER-2 will fly out of Keflavik, Iceland, and climb to 60,000 feet on its way to Greenland to measure the same tracks as the P-3B Orion.

We have now completed all our test flights here at Wallops and are ready to go to Greenland where we hope to map much of the sea ice cover over the Arctic Ocean and the Greenland Ice Sheet.

Welcome to the 2011 Arctic Campaign

From: Kathryn Hansen, NASA’s Earth Science News Team/Cryosphere Outreach Specialist


On March 14, NASA’s P-3B landed in Thule, Greenland, for the start of the Arctic 2011 campaign of Operation IceBridge. Credit: NASA/Jim Yungel


On March 14, NASA’s P-3B aircraft landed in Thule, Greenland, where it will be based for the first leg of the Arctic 2011 campaign of Operation IceBridge. It’s our third annual campaign over the frozen north, ensuring the continuity of ice elevation measurements that scientists use to monitor change. This year, IceBridge is bigger than ever before and delving into new areas of exploration. Read more about the Arctic 2011 campaign and watch the video here.

Follow this blog throughout the 10-week campaign to read about the mission from the perspective of the scientists and crew on the ground (and in the air) who make the mission possible. They will give a behind-the-scenes account of individual flights and daily life in the field. They will share pictures and video from the sky and ground. And they will discuss the science questions being probed by the array of instruments onboard the flying laboratories. Welcome aboard!

Mission participants chat inside the P-3B during transit on March 14 from NASA’s Wallops Flight Facility in Wallops Island, Va., to the mission’s base in Thule, Greenland. Credit: NASA/Jim Yungel

IceBridge teams arrive in cold and sunny Thule, Greenland. Credit: NASA/Jim Yungel

Second Weddell Sea Ice Mission and CryoSat Underflight

From: Nathan Kurtz, NASA’s Goddard Space Flight Center/University of Maryland, Baltimore County

Our flight today, Oct. 28, was a partial repeat of a mission conducted last year. The flight was to take place at 1,500 feet along the western edge of the Weddell Sea following the Antarctic Peninsula, turning south and east along the Ronne Ice Shelf, then heading north into the central Weddell Sea. The primary instruments used on this flight were a specially designed suite of laser and radar altimeters for measuring the thickness of the snow and ice underneath.

I began my journey in the cockpit of the NASA DC-8, my first time seeing what all is involved in bringing a large aircraft from the runway into the sky. We took off on schedule flying briefly around the countryside surrounding Punta Arenas, heading back over the airport ramp to calibrate some of the instruments. We then started our push towards the Weddell Sea. Along the way there were spectacular views of the normally cloud enshrouded mountains and glaciers of Tierra del Fuego. Even at an altitude of 18,000 ft the 8,000 ft peaks looked a bit too close for comfort, but the calmness and confidence of the pilots helped rid my mind of any thoughts of catastrophe.

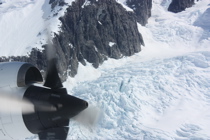
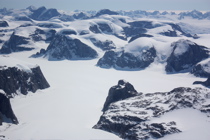
After a couple hours transiting through serene blue skies we spotted the Antarctic Peninsula and began our descent to low altitude. My first ever science flight to the polar regions from two days ago was still fresh in my mind, but the view of the pristine landscape still captivated me. As we passed over the peninsula, there were breathtaking views of jagged brown mountains, bright white snow, sky blue glacier ice, and murky black water all mixed together in a chaotic jumble. I was struck by how truly remote and harsh the world down below was. A place only for well prepared humans and the hardiest of animals. Despite the uninviting look of the land below, I couldn’t help imagining what it might be like to ride a sled or go skiing down some of the mountains.

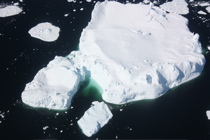
As we left the peninsula, we passed southward over still waters filled with icebergs, finally entering into the sea ice region to begin our science mission. We first entered into a region of small sea ice floes which had been broken up by wind and waves. The aircraft instruments showed the surface and air temperatures were near the freezing point, probably the reason for the absence of any newly growing ice in the open water areas. As we continued our flight southward we entered the consolidated ice cover of the western Weddell Sea. The region we were flying over today is some of the thickest and most compact ice in the Southern Ocean. The vastness of the sea ice cover became readily apparent as this leg of the journey consisted of miles of ice extending into the horizon in all directions. The area was a mixture of open water, freshly grown ice, smooth areas, rubble fields, ridges, and many other ice types each with intricate geometries reflecting the physical processes which shaped their formation. Towards the end of the peninsula region we turned east following the outline of the Ronne Ice Shelf. Though we couldn’t see it in the distance, evidence of its presence was all around us as numerous icebergs could be seen. The huge size of the icebergs dwarfed the surrounding sea ice, but the icebergs were held steady inside like giants chained into a prison of sea ice.

The sea ice itself looked benign and serene, like a vast unmoving and unchanging landscape. But looks can be deceptive as the aircraft instruments showed temperatures of -10 C and 60+ mph winds outside. Telltale signs of the force of wind and water acting on the ice could be seen in the piled up and crushed ice of the ridges. The wind had also blown the snow into patterns called sastrugi, some of them looked like flowers dotting the landscape. The plane marched on relentlessly throughout the day as miles of sea ice passed below us. The last leg of the science portion of the flight took us underneath the orbit of CryoSat-2, a radar altimeter launched earlier this year by ESA.


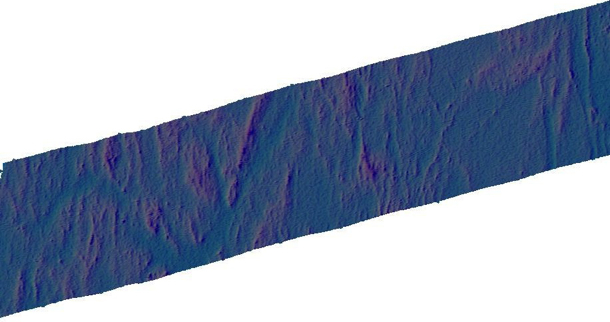
Data from the Airborne Topographic Mapper (ATM) show a swath of sea ice at the time of the CryoSat-2 overpass on Oct. 28, 2010. Data in this image are preliminary. Credit: NASA/ATM Group

One goal of this mission was to collect coincident data between IceBridge and CryoSat-2 for doing intercomparisons between the various altimeter data sets used in cryospheric research. We were a bit ahead of schedule however, so we looped back over portions of our flight line to ensure that we were still collecting data when the satellite crossed over. Finally, as the sun hung began to sink low on the horizon, hundreds of miles above us CryoSat-2 passed silently overhead covering hours of our flight track in a matter of minutes. We continued flying northward a little while longer towards the edge of the ice pack where the ice became less consolidated and more broken up. Our mission finished, we climbed high into the sky and sped back to our temporary home in Punta Arenas.

Image is courtesy of NASA/Jim Yungel

It’s difficult for me to tell much about the ice cover properties from the limited perspective of my human eyes, but memories of the journey will remain with me for a long time to come. An enduring and detailed record has also been written into the hard drives of the IceBridge instrument archives. I and other scientists are eagerly anticipating doing a thorough analysis of the data collected. Hopefully it will tell us more about what we saw today and how this record can be used to enhance our understanding of the climate system.

A Sea Ice Mission Over the Weddell Sea

From: Seelye Martin, University of Washington

The Weddell Sea mission is a pair of lines repeated from last year that extend across the sea ice from the tip of the Antarctic Peninsula to south of Cape Norvegia, and back again (see above). The flight path crosses the tip of the Peninsula, then proceeds on a long straight line to the eastern Weddell Coast, transits down the coast about 200 nautical miles, then transits back, where the sea ice coverage is at 1,500 feet. The primary instruments will be the ATM to measure sea ice freeboard and the snow depth radar for snow depth on the sea ice.

The past five days have been very difficult, in that the weather has been poor, with low clouds or storms over all of our sites. This was stressful for all of us, in that on the previous evening, we would choose a potential target, then get up at 5:00 am local, transit to the airport at 6:30, get to the airport at 7, stare at maps and imagery until 7:30, then consult with the weather office until 8 am. At this point, we would discover the weather was so marginal that we were forced to cancel. But today our forecasts showed a high pressure system over the Weddell Sea, the Chileans said go, so we flew the mission. This is the first in a series of 14 flight plans.

In this mission, our first problem involves the production of accurate weather forecasts. To produce these, we use the following sources: First, the Antarctic Mesoscale Prediction System, which at 00 and 12 UTC, produces a five day forecast at 3-hour increments. This forecast in particular shows the location and height of the cloud layers. Second, the satellite imagery acquired by the NASA Rapidfire system, pressure field forecasts from the European Center for Medium Range Weather Forecasting (ECMWF) and the expertise of Chilean Airport Meteorologists. So what’s the weather like down here? Imagine a circular icecap centered at the South Pole. Under these conditions, there would be a high pressure system over the ice cap, and a series of lows moving around the cap. Now add the Antarctic Peninsula to the icecap, a 4,000-meter-high barrier extending 700 nautical miles toward South America. The lows still rotate around the continent, but now the peninsula causes the lows to stall in the Bellingshausen Sea. This creates the bad weather for the critical region around Pine Island Bay. For the Weddell, this is the first open day since we arrived, and we hope that the mission is free of low clouds.

A second problem involves the avoidance of bird and seal colonies. Low overflights stress the birds and seals; so we need to stay 4,000 feet away from the colonies in the vertical, or 1 nautical mile in the horizontal. We are making every effort to avoid the colonies, many of which are concentrated along our path in the northern peninsula.
A third problem involves the snow depth radar. This is an innovative radar from the University of Kansas, that measures snow depth on sea ice. Last year, the transmit and receive antennas were located adjacent to one another in a fairing attached to the belly of the plane. This year, to improve performance, the receiving antennas were relocated to compartments in the wing roots, one each on each side. The relocation of these antennas involved having a contractor replace the aircraft aluminum panels with a radar transparent material, which is used instead of the aluminum panels, with the antennas mounted behind. The radar is now more sensitive, but it has yet to be tested over sea ice, something we had hoped to do on an earlier flight, so we need to allow for roughly half an hour to take data at low elevations, then analyze it, to make sure that the instrument is working properly before taking data along the line. Having this instrument work will improve the accuracy of the snow depth retrieval. So, weather, penguins, snow radar, all must all be considered for a successful flight.

Here is the timeline of the mission:

0905: Take-off to 33,000 ft, airspeed 450 kts.

1030: We are approaching the peninsula, still at high altitude. Islands are just coming into view, poking up above the clouds, this would be Greenwich Island, straight ahead. Cloud deck is below us, clouds should clear as we cross the peninsula.

1026: Approaching peninsula, high clouds

1051: Passing over the peninsula at 34,000 ft, turbulence shakes plane.

1110: Cleared peninsula, avoided penguin colonies, sea ice is visible straight ahead, dropping our altitude to 1,500 ft. Someone just handed me a paper towel, they are concerned about possible precipitation inside the plane as we descend.

1112: Descending to 1500’ for snow radar calibration.

1113: At 1,500’, approaching sea ice under clouds, snow radar is running

1115: Transiting sea ice edge. small broken floes, sunlight on ice. Surface temp from infrared radiometer is about -2 C. It is warm and sunny out here.

1146: Surface temp as low as -6C, we have good snow. Ice consists of large floes surrounded by open water, occasional nilas (thin ice). Small icebergs visible in distance. This is wonderful flying, horizon visible in all directions, blue sky above. Very different than last year. Gives some faith to the forecast.

1201: Suddenly flying above dense low clouds without breaks.

1208: Dropped to 1,000 ft, still in clouds, some turbulence. I sure hope we fly out of this.

1217: Intermittent cloudiness, now appears to be sharpening up. Pilots do not want to go below 1,000 ft. Now it is really clear again, a whole lot better.

1219: Looks really clear again, good horizon, occasional puffs of clouds, blue sky overhead.

1225: Winds up to 25 kts at right angles to the plane, Langmuir streaks in water. Winds should blow the clouds out of here. Ben reports that the snow radar is working.

1230: Return to 1,500 ft.

1311: Cross-track wind up to 31 kts.

1318: Clouds at horizon, 2 hours to the coast. Ice and blue sky still present.

1350: We are about an hour out from the eastern Weddell coast.

1400: Back into low clouds, some chop, wispy ground fog is back, surface still visible at times, still at 1,500 ft.

1413: Clear again at surface, but overcast overhead. 26 minutes to end of line. Losing the horizon. Turbulence, socked in again, no, I can still see the surface. These cloudy interludes are pretty intermittent. Can sort of see the horizon. Ben reports from early processing of snow radar, 75 cm of snow depth near the peninsula.

1435: Approaching the coast for our turn south. Then about 200 nm on the southern leg, then head back to the peninsula.

1440: Begin turn to the southwest. This is about as close as we will get to the eastern Weddell coast, the British station Halley Bay is off here somewhere, looks like we are on the new trajectory. We are in a heavy haze, but surface is still visible. Good surface visibility.

1530: Just finished traverse along the Brunt ice shelf, very beautiful as we came out from under a cloud deck.

1552: On return track to the tip of the peninsula, good surface visibility but hazy.

1700: Perfect weather on the return line, just heard from pilots that they can finish the line at 1,500 ft. Our low altitude airspeed is 250 knots.

1820: Approaching the peninsula at low altitude, weather remains excellent, beautiful sunset across the Peninsula.

1840: 15 minutes out from waypoint marking the end of the line. We can just about make out the Antarctic Peninsula. Ice is thicker adjacent to the peninsula, this is where the second year ice occurs in the Weddell Sea. The tabular icebergs we are seeing out here probably calf off the Ronne/Filchner Ice Shelves.

1850: Reached waypoint, starting to climb for home, at a sufficient altitude to avoid the penguin colonies.

1900: Cleared the peninsula, at 34,000 ft, headed for home, but encountered 60 kt headwinds.

2120: Landed at Punta Arenas, flight duration was 12.4 hrs.

Welcome to the Operation IceBridge 2010 Antarctic Campaign

From: Michael Studinger, IceBridge project scientist, Goddard Earth Science and Technology Center at the University of Maryland


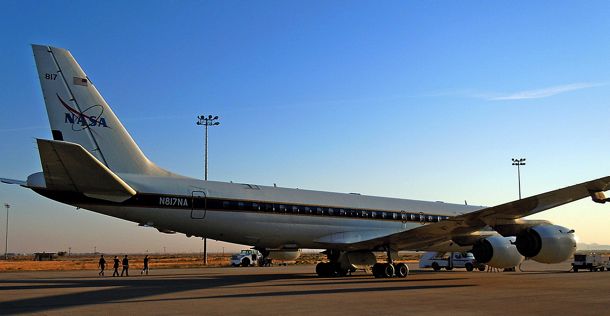
The DC-8, parked outside the hanger at NASA’s Dryden Flight Research Center, is prepared for a instrument test flight. Credit: NASA/Michael Studinger

Oct. 17, 2010

Dryden Flight Research Center, CA — Welcome to our 2010 Antarctic campaign with NASA’s DC-8 Flying Laboratory. For the past two weeks Operation IceBridge teams have been busy installing instruments and sensors onto the DC-8 aircraft here in Palmdale, Calif., at NASA’s Dryden Flight Research Center. Over the next couple of weeks we will fly with the DC-8 over Antarctica to measure changes in thickness of the sea ice surrounding Antarctica and to monitor changes in the thickness of ice sheets and glaciers that cover 98% of the Antarctic continent. 

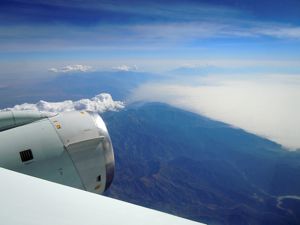
But before we can go south we have to go through a series of test flights here in California to make sure that all the installed sensors work and to calibrate our science instruments. In order to do this we fly over target sites in the Mojave Desert that we have surveyed on the ground a few days before the test flights. The desert environment that we have selected for our test flights here is very different from the barren land of snow and ice that we will be flying over the next couple of weeks and we all enjoy the low altitude flights over the Mojave Desert, the San Gabriel Mountains and the San Andreas Fault. When the pilots ask you if it would be a problem if the belly of the aircraft is facing the sun you know that you are in the world of research flying. We did a couple of 90 roll maneuvers at high altitude over the Pacific Ocean to calibrate the antennas of the ice-penetrating radar systems that we will use to survey sea ice, glaciers, and ice sheets.
Instrument test flight over the San Gabriel Mountains in California. Credit: NASA/Michael Studinger

The IceBridge teams have enjoyed a few days of work here in warm and sunny California and we are now ready to fly to Punta Arenas in southern Chile, which will be the base of operation for our Antarctic flights. We are looking forward to another successful campaign with exciting new data and spectacular Antarctic scenery.

Back from Greenland, No Rest for the Weary

NASA and university partners returned from Greenland on May 28, concluding Operation IceBridge’s 2010 field campaign to survey Arctic ice sheets, glaciers and sea ice.

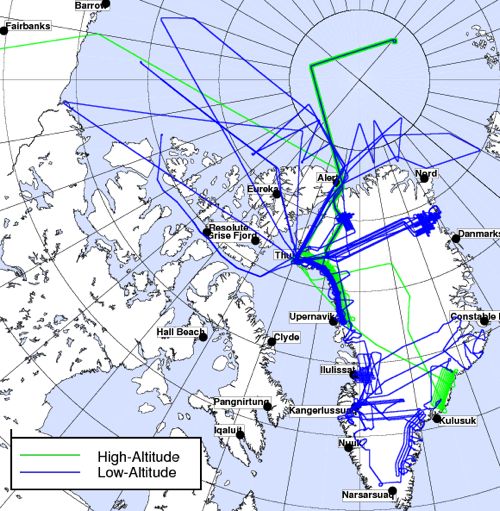
Over the span of almost 10 weeks, crew flew 28 science flights between the DC-8 and P-3 aircraft. Flight paths covered a total of 62,842 nautical miles, equivalent to about 2.5 trips around Earth at its equator. Credit: NASA

IceBridge — the largest airborne survey ever flown of Earth’s polar ice — has now completed two successive Arctic campaigns, adding a multitude of new information to the record from previous surveys.

Continue to follow the IceBridge blog and twitter feed to read updates as science results emerge. Also hear from scientists already planning the return to Antarctica this fall.

IceBridge project scientist Michael Studinger, recently back from the field, offered words of thanks to those who helped made the 2010 Arctic campaign a success.

“A project of this size with two aircraft and multiple deployment sites and a fairly complex instrument payload is only possible with the support of many people. I would like to thank everyone from NASA’s Dryden Aircraft Operations Facility, NASA’s Wallops Flight Facility and NASA’s Earth Science Project Office, who all provided excellent support for Operation IceBridge. We also had excellent support from the NASA instrument teams, the science teams from the universities, and many of our science colleagues, both, from the teams in the field and from people back home in the labs. IceBridge also would like to thank the many people in Kangerlussuag and at Thule Air Base in Greenland who provided excellent support while we were there. We could not have accomplished our goals without their terrific help.”

Michael Studinger (right) readies for a science flight from Kangerlussuaq, Greenland, during the Arctic 2010 IceBridge field campaign. Credit: NASA/Jim Yungel

An Inland Connection?

From: Kathryn Hansen, NASA’s Earth Science News Team/Cryosphere Outreach Specialist

Scientists have long been tracking Greenland’s outlet glaciers, yet aspects of glacier dynamics remain a mystery. One school of thought was that glaciers react to local forces, such as the shape of the terrain below. Then, researchers noticed that glaciers in different regions were all thinning together, implying a connection beyond local influences. Scientists have posed theories about what that connection might be, but the jury is still out.
Recently, the landscape in southeast Greenland has started to change. Helheim Glacer, which was thinning at 20-40 meters per year, slowed dramatically to just 3 meters per year while thinning of the nearby Kangerdlugsuaq also slowed. Further south, two neighboring glaciers showed the opposite trend and started thickening by as much as 14 meters per year. Neighboring glaciers behaving in similar ways implies a connection, but what exactly?

The IceBridge flight on May 12 will help scientists learn how changes to outlet glaciers affect the ice sheet inland. Instruments on the P-3 surveyed in detail three southeast glaciers: Fridtjof-Nansen, Mogens North and Mogens South. Next they flew four long lines mapping changes near the ocean and up to 60 kilometers inland, capturing the extent, if any, at which thinning near coast reflects on changes to the ice inland. It’s an important connection to make; while the loss of outlet glaciers alone would not contribute much to sea level rise, loss of the ice sheet could have a dramatic impact.

IceBridge crew and researchers board the P-3 on May 12 for a flight to study glaciers and the ice sheet in southeast Greenland. Credit: NASA/Kathryn Hansen


The P-3 flew over areas of sea ice wile mapping glaciers and the flight line closets to the coast. Credit: NASA/Kathryn Hansen

Mountainous terrain along Greenland’s southeast coast led to short-lived periods of turbulence and spectacular scenery. Credit: NASA/Kathryn Hansen

Underflying CryoSat-2 at the North Pole


From: Sinéad Farrell, sea ice team member, Earth System Science Interdisciplinary Center at the University of Maryland

The penultimate sea ice flight to be conducted during phase one of the Arctic 2010 IceBridge campaign was exciting. After days of bad weather and confinement to quarters at Thule Air Base, the flight team was finally able to accomplish the remaining sea ice flights. With only three days left in the campaign, and three sea ice surveys to complete, the pressure was on!

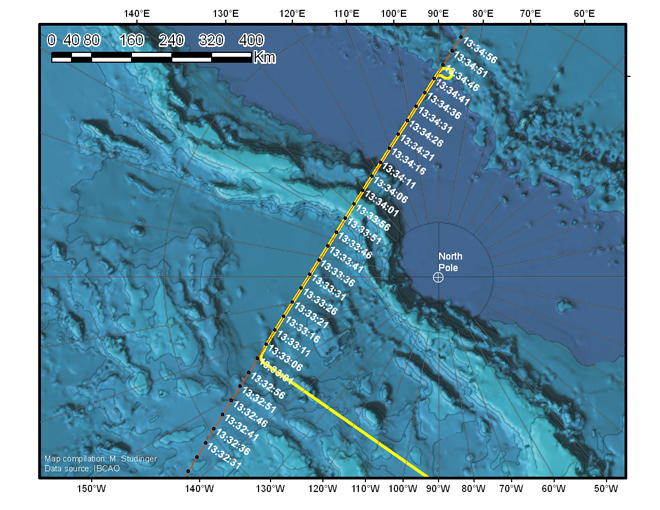
Favorable weather conditions on April 20, 2010, meant that the “Sea Ice 07” flight plan could be attempted. For the ad-hoc sea ice team back home, anticipation was mounting. Several days earlier, on April 8, the European Space Agency (ESA) launched the CryoSat-2 satellite to monitor changes in the thickness of polar ice. By April 11, CryoSat-2’s main sensor — the Synthetic Aperture Interferometric Radar Altimeter (SIRAL) — was turned on and meant that an underflight of CryoSat-2 by the DC-8 and its onboard sensors was possible.

To mitigate against the impact of the drifting sea ice pack, detailed planning and coordination was required to ensure the IceBridge sea ice flight was timed to be coincident with the satellite overpass near-by the North Pole. International collaboration between IceBridge team members at NASA, ESA and NOAA, as well as at a number of academic institutions, ensured the flight was both spatially and temporally coincident with CryoSat-2’s transit across the Arctic Ocean (see map below).


A map of the “Sea Ice 07” flight path, flown on April 20, illustrates the coincident DC-8 flight trajectory (yellow) and the CryoSat-2 orbit (orange) with the times of the satellite over-pass indicated (white). Image is courtesy of Michael Studinger.

Although clouds were encountered en-route to the North Pole, the DC-8 began surveying the CryoSat-2 ground-track just 14 minutes after the satellite passed overhead, in cloud-free conditions. A suite of instruments on the DC-8 including the Land, Vegetation and Ice Sensor (LVIS) and the Airborne Topographic Mapper (ATM) surveyed sea ice elevation along a 465-mile (750-kilometer) CryoSat-2 track at two altitudes: 25,000 feet (LVIS) and 1,500 feet (ATM).

LVIS’s wide swath was particularly suited to capturing the footprint of the satellite’s main sensor. Optical mapping systems, a snow radar, and a gravimeter onboard the DC-8 provided further science data. When analyzed in concert these data provide a valuable baseline for evaluating CryoSat-2’s capabilities for measuring Arctic sea ice thickness.

The flight demonstrated successful collaboration between federal agencies in the United States as well as international cooperation with ESA. Not only did the IceBridge mission carry out the first attempt by aircraft to validate the state-of-the-art radar altimeter onboard CryoSat-2, it contributed to a number of other firsts. The flight marked the most northerly IceBridge survey thus far, utilizing airborne laser and radar altimetry to survey sea ice at a latitude of 88oN. The flight also provided the first opportunity to compare the airborne ATM and LVIS instruments, which use lasers to gather complimentary surface elevation data over sea ice, with a new snow radar system. The sea ice science community looks forward to analyzing the wealth of data gathered during this flight.